HAL Id: hal-01194097
https://hal.archives-ouvertes.fr/hal-01194097
Submitted on 1 Jun 2021
HAL is a multi-disciplinary open access
archive for the deposit and dissemination of
sci-entific research documents, whether they are
pub-lished or not. The documents may come from
teaching and research institutions in France or
abroad, or from public or private research centers.
L’archive ouverte pluridisciplinaire HAL, est
destinée au dépôt et à la diffusion de documents
scientifiques de niveau recherche, publiés ou non,
émanant des établissements d’enseignement et de
recherche français ou étrangers, des laboratoires
publics ou privés.
variation in tolerance of food deprivation in juvenile
European sea bass, Dicentrarchus labrax
David J. Mckenzie, Alain Vergnet, Beatrice Chatain, Marc Vandeputte, Erick
Desmarais, John F. Steffensen, Bruno Guinand
To cite this version:
David J. Mckenzie, Alain Vergnet, Beatrice Chatain, Marc Vandeputte, Erick Desmarais, et al..
Phys-iological mechanisms underlying individual variation in tolerance of food deprivation in juvenile
Euro-pean sea bass, Dicentrarchus labrax. Journal of Experimental Biology, Cambridge University Press,
2014, 217 (18), pp.3283 - 3292. �10.1242/jeb.101857�. �hal-01194097�
The Journal of Experimental Biology
© 2014. Published by The Company of Biologists Ltd | The Journal of Experimental Biology (2014) 217, 3283-3292 doi:10.1242/jeb.101857ABSTRACT
Although food deprivation is a major ecological pressure in fishes, there is wide individual variation in tolerance of fasting, whose mechanistic bases are poorly understood. Two thousand individually tagged juvenile European sea bass were submitted to two ‘fasting/feeding’ cycles each comprising 3 weeks of food deprivation followed by 3 weeks of ad libitum feeding at 25°C. Rates of mass loss during the two fasting periods were averaged for each individual to calculate a population mean. Extreme fasting tolerant (FT) and sensitive (FS) phenotypes were identified that were at least one and a half standard deviations, on opposing sides, from this mean. Respirometry was used to investigate two main hypotheses: (1) tolerance of food deprivation reflects lower mass-corrected routine metabolic rate (RMR) in FT phenotypes when fasting, and (2) tolerance reflects differences in substrate utilisation; FT phenotypes use relatively less proteins as metabolic fuels during fasting, measured as their ammonia quotient (AQ), the simultaneous ratio of ammonia excretion to RMR. There was no difference in mean RMR between FT and FS over 7 days fasting, being 6.70±0.24 mmol h−1fish−1 (mean ± s.e.m., N=18) versus 6.76±0.22 mmol h−1fish−1(N=17), respectively, when corrected to a body mass of 130 g. For any given RMR, however, the FT lost mass at a significantly lower rate than FS, overall 7-day average being 0.72±0.05 versus 0.90±0.05 g day−1fish−1, respectively (P<0.01, t-test). At 20 h after receiving a ration equivalent to 2% body mass as food pellets, ammonia excretion and simultaneous RMR were elevated and similar in FT and FS, with AQs of 0.105±0.009 and 0.089±0.007, respectively. At the end of the period of fasting, ammonia excretion and RMR had fallen in both phenotypes, but AQ was significantly lower in FT than FS, being 0.038±0.004 versus 0.061±0.005, respectively (P<0.001, t-test). There was a direct linear relationship between individual fasted AQ and rate of mass loss, with FT and FS individuals distributed at opposing lower and upper extremities, respectively. Thus the difference between the phenotypes in their tolerance of food deprivation did not depend upon their routine energy use when fasting. Rather, it depended
RESEARCH ARTICLE
1UMR5119, Ecologie des systèmes marins côtiers (ECOSYM), Place Eugène Bataillon, Université Montpellier 2, 34095 Montpellier Cedex 5, France. 2Ifremer, Station expérimentale d’aquaculture, chemin de Maguelone, 34250 Palavas-les-Flots, France. 3INRA UMR1313, Génétique Animale et Biologie Intégrative, Domaine de Vilvert, 78350 Jouy-en-Josas, France. 4UMR5554, Institut des Sciences de l’Evolution de Montpellier (ISE-M), Place Eugène Bataillon, Université Montpellier 2, 34095 Montpellier Cedex 5, France. 5Marine Biological Section, University of Copenhagen, Strandpromenaden 5, DK-3000 Helsingør, Denmark.
*Author for correspondence (david.mckenzie@univ-montp2.fr) Received 2 January 2014; Accepted 23 June 2014
upon their relative use of tissue proteins as metabolic fuels when fasting, which was significantly lower in FT phenotypes.
KEY WORDS: Ammonia excretion, Ammonia quotient, Energetic strategy, Respirometry, Routine metabolic rate, Specific dynamic action
INTRODUCTION
Fishes can experience prolonged periods of food deprivation, as a result of seasonal or stochastic variations in availability, and an ability to tolerate extended fasting can be a critical factor in determining lifetime fitness (Byström et al., 2006; Heermann et al., 2009; McCue, 2010; Bar and Volkoff, 2012). Despite this major ecological significance, there is evidence that fishes exhibit significant individual variation in their ability to tolerate food deprivation, when this is measured as rates of mass loss (Dupont-Prinet et al., 2010; Grima et al., 2010; Killen et al., 2011). In a number of animal groups, including fishes, this variation appears to persist, at least in part, because tolerance of food deprivation trades off against a capacity for rapid growth, measured as rates of mass gain when feeding (Gotthard, 1998; Stoks et al., 2006; Scharf et al., 2009; Dupont-Prinet et al., 2010). It has been proposed that this trade-off has a straightforward physiological basis in fishes, as a direct consequence of different capacities for biosynthesis and growth (Bochdansky et al., 2005; Bang et al., 2007; Dupont-Prinet et al., 2010). Rapid growth brings ecological advantages if it allows individuals, particularly in their early life stages, to outgrow the gape of predators and out-compete conspecifics (Arendt, 1997). Greater growth capacity would, however, be attended by higher metabolic costs, so fuel stores are consumed rapidly during periods of food deprivation. Conversely, individuals that can tolerate periods of food deprivation can do so because they have low metabolic costs, but this is presumably because they lack the biosynthetic capacity to respond to opportunities for rapid growth (Bochdansky et al., 2005; Bang et al., 2007; Millidine et al., 2009; Dupont-Prinet et al., 2010). This physiological trade-off allows opposing energetic strategies to co-exist, such that variation in growth rate and fasting tolerance persists in populations (Dupont-Prinet et al., 2010).
Dupont-Prinet et al. (Dupont-Prinet et al., 2010) revealed a trade-off between tolerance of food deprivation and growth rate in the European sea bass, Dicentrarchus labrax Linnaeus 1758, in a population of 1920 individuals in aquaculture. When individuals selected from opposing ends of this trade-off were studied for their physiology, it was found that rapid growth phenotypes could digest and assimilate meals more rapidly, based upon the time to complete a specific dynamic action (SDA) response after consuming a fixed ration. This explained their more rapid growth because they could eat meals more frequently (Dupont-Prinet et al., 2010), as observed
Physiological mechanisms underlying individual variation in
tolerance of food deprivation in juvenile European sea bass,
Dicentrarchus labrax
David J. McKenzie1,*, Alain Vergnet2, Béatrice Chatain2, Marc Vandeputte2,3, Erick Desmarais4,
The Journal of Experimental Biology
in other fish species (Millidine et al., 2009). By contrast, Dupont-Prinet et al. (Dupont-Dupont-Prinet et al., 2010) did not find any differences in costs of maintenance, namely lower routine and standard metabolic rates in phenotypes tolerant of fasting, when these were measured over 48 h in post-absorptive animals. The overall objective of the current study was, therefore, to explore further the mechanistic basis for relative tolerance of food deprivation in juvenile D. labrax.
It is conceivable that differences in metabolic rate, linked to relative tolerance of food deprivation, might appear over a longer period of fasting than the 48 h reported by Dupont-Prinet et al. (Dupont-Prinet et al., 2010). When ectotherms are fasted they can show a progressive decline in metabolic rate, an energy-saving strategy that at least partially reflects progressive downregulation of superfluous organ systems, in particular the digestive tract (Wang et al., 2006; Hervant, 2012; Lignot, 2012; Zeng et al., 2012; Zeng et al., 2014). Phenotypes tolerant of food deprivation may implement a progressive downregulation of the gastrointestinal tract as fasting proceeds, with an associated decline in metabolic rate that manifests itself progressively over time. Rapid growth phenotypes may elect to maintain function of organs systems such as the gut, and their associated metabolic costs, for longer during food deprivation, to be able to quickly take advantage of any meals that present themselves. Gut downregulation is not easy to measure without sacrificing animals but there is evidence that one of its consequences can be a slowing and dampening of the SDA response (Zeng et al., 2012; Zeng et al., 2014), presumably because the uptake of nutrients at the intestine is retarded.
Although previous attention regarding individual variation in tolerance of food deprivation has focused on metabolic rate in fishes (Bochdansky et al., 2005; Bang et al., 2007; Dupont-Prinet et al., 2010), it is also possible that different rates of mass loss during fasting reflect individual variation in use of endogenous substrates as metabolic fuels (Lauff and Wood, 1996b). In carnivorous fish such as the sea bass, the main energy reserves that are mobilised during fasting are either lipids, stored in perivisceral fat or within tissues, or tissue protein itself, with a more minor role for glycogen stores (for a review, see Bar and Volkoff, 2012). Tolerance of fasting is typically measured as rates of mass loss or negative growth, and energy-dense lipid provides twice as much ATP per gram, in oxidative phosphorylation, as does protein plus associated water. Thus if individuals differ in their relative use of proteins versus lipids during food deprivation, they may show different rates of mass loss for the same metabolic rate. There is evidence that such a mechanism may underlie individual variation in rates of mass loss by dieting humans (Barwell et al., 2009) and also their tendency to accumulate adipose tissue when feeding (Ellis et al., 2010). When feeding routinely in aquaculture, fasting tolerant sea bass phenotypes accumulate larger intramuscular and perivisceral lipid stores (Grima et al., 2010; Daulé et al., 2013).
The relative use of lipids, proteins and carbohydrates is not easy to investigate directly because measuring proximal composition requires sacrifice of animals and interconversions among stores during fasting can complicate interpretation (Bar and Volkoff, 2012). Patterns of substrate utilisation can, however, be studied by simultaneous analysis of rates of O2uptake, CO2excretion and
ammonia excretion (Lauff and Wood, 1996a; Lauff and Wood, 1996b; Lauff and Wood, 1997; McKenzie et al., 2007). Unfortunately, measurements of CO2 excretion by fishes into
seawater are technically extremely challenging, so the role of lipids and carbohydrates cannot be resolved. Nonetheless, measurement of ammonia excretion reveals the proportion of metabolic rate directly
sustained by protein catabolism (Brett and Zala, 1975; Jobling, 1980; Kieffer and Wakefield, 2009), to investigate how individual tolerance of fasting might relate to reliance on tissue proteins as fuels, so providing insight into relative dependence on other major fuels such as lipids.
The current study therefore investigated the contribution of these potential mechanisms to variation in tolerance of food deprivation in juvenile European sea bass, D. labrax. A population of 2000 individually tagged juveniles were submitted to two ‘fasting/ feeding’ cycles, each comprising 3 weeks of food deprivation followed by 3 weeks of ad libitum feeding, at 25°C (Dupont-Prinet et al., 2010; Grima et al., 2010; Daulé et al., 2013). We took the average rate of mass loss (negative growth rate) for each individual for the two fasting intervals, and calculated a population mean and standard deviation for the 2000 animals. We then identified extreme phenotypes that were at least one and a half standard deviations from this mean, on opposing sides. Phenotypes were therefore either fasting tolerant (FT) that lost mass relatively slowly, or fasting sensitive (FS) that lost mass relatively rapidly. The rationale for selecting extreme phenotypes was to improve the likelihood of uncovering clear physiological mechanisms underlying their differences in fasting tolerance (Dupont-Prinet et al., 2010).
We used whole animal respirometry to investigate two main hypotheses. The first hypothesis was that tolerance of fasting simply reflected differences in mass-specific routine metabolic rate (RMR) by the phenotypes when deprived of food. To this end, RMR was measured as rates of oxygen uptake (ṀO2) over a period of 7 days
fasting. This interval is long enough to generate significant individual variation in rates of mass loss in a ‘standard’ population of 32 juvenile sea bass, which was directly dependent on their RMR while fasted (Killen et al., 2011). We predicted that the FT phenotypes would show a more pronounced progressive decline in
ṀO2as fasting proceeded, and therefore show a significantly lower
overall RMR than the FS, when calculated over the entire fasting interval. We went further to investigate whether a mechanism underlying this predicted gradual decline in RMR by FT phenotypes during fasting might be downregulation of gut function. We compared an SDA response to a fixed ration (Dupont-Prinet et al., 2010) prior to, and after, the period of 7 days food deprivation. The expectation was that, after fasting, the response would take relatively longer to complete in FT phenotypes, indicating that they had downregulated their intestinal function relatively more (Zeng et al., 2014). Secondly, we hypothesised that tolerance of fasting reflected differences in substrate utilisation. Rates of ammonia excretion (Ṁamm) were measured at 18 h of the first SDA response prior to
fasting, and at midday of the last day of food deprivation. These were related to the simultaneous ṀO2, to calculate the ammonia
quotient (AQ) and reveal the proportion of aerobic metabolism directly fuelled by proteins (Brett and Zala, 1975; Lauff and Wood, 1996b; McKenzie et al., 2007). The expectation was that FT phenotypes use relatively less proteins as metabolic fuels when fasting.
RESULTS
Selection of extreme phenotypes: growth rates during fasting/feeding cycles
Data were collected from N=18 FT and N=17 FS phenotypes, with a mean ± s.e.m. initial mass of 133±9 and 137±9 g, respectively. Their mean specific growth rates (SGR, in % day−1) during two
initial 3-week intervals of routine ad libitum feeding, and then the fasting/feeding cycles, are shown in Table 1. Both phenotypes grew at similar rates during routine feeding, with no effect of phenotype
The Journal of Experimental Biology
RESEARCH ARTICLE The Journal of Experimental Biology (2014) doi:10.1242/jeb.101857
[two-way ANOVA, general linear model (GLM), F=0.20, P=0.65], interval (F=0.39, P=0.53) or interaction (F=0.08, P=0.78). The selected phenotypes of course showed significant differences in growth rates during the fasting/feeding cycles. During the two periods of fasting there was a highly significant effect of phenotype (GLM, F=83.13, P<0.001), but not quite significant effects of interval (F=3.83, P=0.058), or interaction (F=3.86, P=0.057), i.e. the FT phenotype had a significantly smaller negative SGR (lower rate of mass loss) during fasting, for both periods (Table 1). During the periods of refeeding, there was also a highly significant effect of phenotype (GLM, F=16.93, P<0.001), but also an effect of interval (F=25.93, P<0.001) and an interaction (F=4.62, P=0.038). That is, as shown in Table 1, compensatory SGR was significantly lower in the FT than the FS phenotype. The interaction occurred because, although both groups showed lower SGR in the second period of compensatory growth, the extent to which this occurred differed between phenotypes. That is, the FT showed a less marked decline in SGR, because of their overall lower SGR.
Mechanisms underlying tolerance of fasting. Hypothesis 1: phenotypic variation in tolerance reflects differences in routine metabolic rate and gut downregulation
Fig. 1 shows the mean daily RMR for the two phenotypes during the 7-day experimental fast. There was no effect of phenotype (GLM,
F=1.02, P=0.32) but a significant effect of time (F=21.97, P<0.001)
and no interaction (F=0.87, P=0.59). The RMR declined significantly over time, in particular over the first 48 h after
handling, but the two phenotypes had essentially identical RMR throughout. The FT phenotypes, however, only lost mass at a rate of 0.72±0.04 g day−1fish−1(mean ± s.e.m.), whereas the FS phenotypes
lost mass significantly faster, at 0.90±0.05 g day−1fish−1 (t-test,
P=0.01), when all data are corrected for initial mass, to a fish of
130 g (see Materials and methods). Fig. 2 shows the relationship between individual mean RMR and individual mean rate of mass loss for the 7-day fast, with all data corrected to a body mass of 130 g. Both phenotypes showed a significant dependence of individual mass loss on RMR, such that individuals with higher
Table 1. Mean (±s.e.m.) specific growth rates (SGR, % day−1) of the fasting tolerant (FT) and fasting sensitive (FS) phenotypes selected to explore the mechanisms underlying variation in fasting tolerance Phenotype FT FS N 18 17 SGRr 0.66±0.04 0.68±0.04 SGRr1 0.68±0.05 0.71±0.06 SGRr2 0.63±0.08 0.65±0.07 SGRf −0.30±0.01 −0.45±0.01* SGRf1 −0.30±0.02 −0.43±0.02* SGRf2 −0.30±0.02 −0.48±0.01*,‡ SGRc 1.59±0.05 1.92±0.06* SGRc1 1.69±0.11 2.14±008* SGRc2 1.50±0.22‡ 1.67±0.06*,‡
Measurements were made when the phenotypes were housed in a population of 2000 tagged individuals in a single tank with food (when relevant) delivered by self-feeder (Grima et al., 2010). SGR was measured over two sequential 3-week intervals under routine ad libitum feeding, then during two sequential cycles each comprising 3 weeks of fasting followed by 3 weeks of ad libitum refeeding. Rates of mass loss during fasting were averaged for each individual to calculate a population mean. These FT and FS phenotypes were selected from among the 2000 as being at least 1.5 s.d., on opposing sides, from the population mean. Phenotypes were compared for the three conditions (routine feeding, fasting, ad libitum refeeding) separately with two-way ANOVA for repeated measures, one factor being phenotype, the repeated measure being the two measurement intervals, and each fish a subject. SGRr, routine growth overall, and for periods 1 and 2; SGRf, negative growth during fasting, overall or for two periods; SGRc, compensatory growth on refeeding, overall or for two periods.
*Difference between phenotypes for that measure (global score either for both periods, or each period separately).
‡Difference between repeated measures for that phenotype (Holm–Sidak post hoc test, P<0.05).
4 6 8 10
0 1 2 3 4 5 6 7
Routine metabolic rate (mmol O
2
h
–1
fish
–1)
Time fasting (days)
Fig. 1. Mean (±s.e.m.) 12-hourly rates of routine metabolic rate (RMR, as oxygen uptake) of the fasting tolerant (grey symbols, N=18) and fasting sensitive (dotted symbols, N=17) phenotypes during a 7-day fast in European sea bass, Dicentrarchus labrax. Although RMR declined
significantly in both phenotypes over time, there were no differences between phenotypes (Holm-Sidak tests following two-way ANOVA for repeated measures). Significances are not shown on the figure to ease reading. RMR is corrected to fish with a mass of 130 g (see Materials and methods for details).
0.1 0.3 0.5 0.7 0.9 1.1 1.3 4 6 8 10
Rate of mass loss (g day
–1
fish
–1
)
Routine metabolic rate (mmol O2 h–1 fish–1) Fig. 2. Least-squares linear regression of the relationship between individual mean RMR and individual mean rate of mass loss, during a
7-day fast. The relationship was significant and linear (N=35, R2=0.63,
P<0.0001) and the slopes of the two phenotypes were statistically
indistinguishable (GLM ANCOVA, F=0.13, P=0.72). The intercepts were, however, significantly different between phenotypes (GLM ANCOVA, F=14.7,
P<0.001). For fasting tolerant (grey symbols, continuous line), the relationship
was rate of mass loss=0.153RMR − 0.13; for fasting sensitive (dotted symbols, dashed line), rate of mass loss=0.153RMR − 0.31. Rates are corrected to a fish with a mass of 130 g (see Materials and methods for details).
The Journal of Experimental Biology
RMR, irrespective of phenotype, lost mass faster. The slopes for both phenotypes were statistically identical and the overall relationship was highly significant (Fig. 2). It is visible from Fig. 2, however, that for any given RMR the FT phenotypes were losing mass more slowly than the FS phenotypes. Indeed when analysed separately, the relationships for each phenotype were still highly significant, but the intercepts were significantly different (Fig. 2).
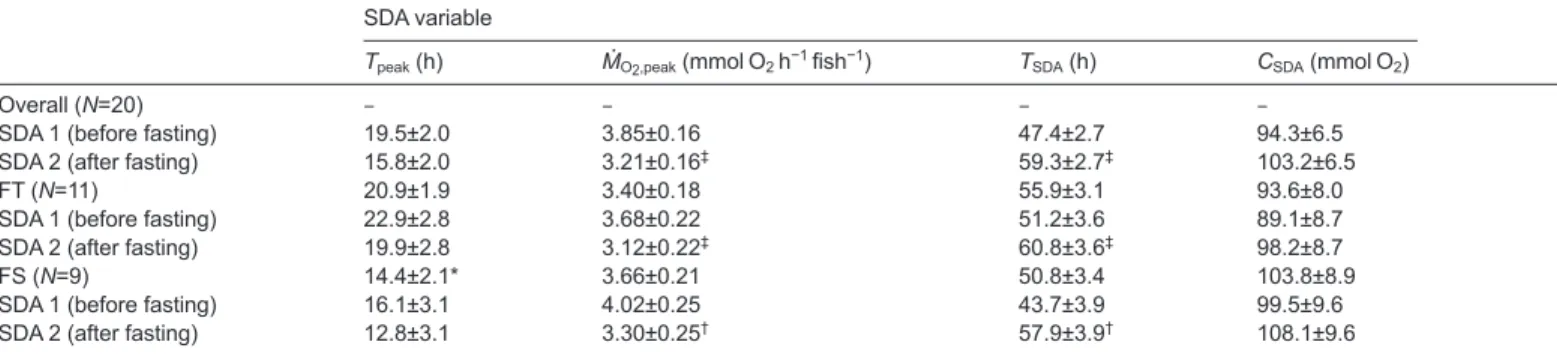
The SDA measurements, before and after the 7-day fast, were only completed for N=11 FT and N=9 FS phenotypes (initial masses 126±4 and 129±5 g, respectively). The ration of pelleted food caused a profound SDA response in both phenotypes, both before and after the fast (Fig. 3). Table 2 shows the SDA variables derived from these responses. The time to peak SDA (Tpeak) indicates how rapidly the
full response was engaged. This showed a significant effect of phenotype (F=5.27, P=0.034) but no significant effect of the fast (F=1.43, P=0.24) or interaction (F=0.01, P=0.91). Thus the FT phenotype took longer overall to engage the full response compared with the FS phenotype (Table 2), although when considered separately Tpeakfor each SDA did not differ significantly, and the fast
had no effect on this variable (Table 2). The peak oxygen uptake due to the SDA (ṀO2,peak) indicates how intense the response was. This
variable, by contrast, showed no effect of phenotype (F=0.87,
P=0.36) but a significant effect of the fast (F=12.18, P=0.003), and
no interaction (F=0.20, P=0.66). That is, the response intensity was generally similar between both phenotypes before and after (Fig. 3),
but the fast caused a significant decline in intensity in both phenotypes (Table 2). The total time for completion of the SDA (TSDA) is self-explanatory. It also showed no effect of phenotype
(F=1.28, P=0.28) but a significant effect of the fast (F=20.86,
P<0.001), and no interaction (F=0.81, P=0.38). Thus the 7-day fast
caused the SDA to take significantly longer to complete overall, in both phenotypes (Table 2). The SDA coefficient (CSDA) represents
the total amount of oxygen required to digest the ration. This did not show any significant effects of phenotype (F=0.72, P=0.41), fast (F=3.12, P=0.09) or their interaction (F<0.01, P=0.96). That is, as shown in Table 2, the total oxygen allocated to the SDA did not differ as a function of phenotype or the fast.
Mechanisms underlying tolerance of fasting. Hypothesis 2: phenotypic variation in tolerance reflects differences in substrate utilisation as fuels
Table 3 shows simultaneous Ṁammand ṀO2for the two phenotypes
during their first SDA or after the 7-day fast, and the corresponding AQ. Note once again that all rates are corrected to a body mass of 130 g. For Ṁamm, there was no significant overall effect of phenotype
(F=0.26, P=0.61) but a highly significant effect of the fast (F=98.54,
P<0.001) and a significant interaction (F=5.80, P=0.022). As seen in
Table 3, this interaction occurred because both phenotypes had similar
Ṁamm during their SDA and they then both showed a significant
decline in Ṁammafter the fast, but the mean Ṁammof fasted FT was
–0.5 0 0.5 1.0 1.5 2.0 2.5 3.0 3.5 0 12 24 36 48 60 72 –0.5 0 0.5 1.0 1.5 2.0 2.5 3.0 3.5 0 12 24 36 48 60 72
Oxygen uptake (mmol h
–1
fish
–1
)
Time (h)
A
B
Fig. 3. Mean (±s.e.m.) hourly rates ofoxygen uptake over 72 h due to specific dynamic action (SDA) following gavage with 2% body mass of feed pellets, either before (circles) or after (diamonds) a 7-day fast.
(A) Fasting tolerant phenotypes (grey symbols, N=11); (B) fasting sensitive phenotypes (dotted symbols, N=9). The net SDA response was calculated by difference of hourly oxygen uptake compared with a sham gavage protocol (see Materials and methods for details). Table 2 shows SDA variables derived from these responses. Rates of oxygen uptake are corrected to fish with a mass of 130 g (see Materials and methods for details).
Table 2. Mean (±s.e.m.) values for variables derived from a specific dynamic action (SDA) response following gavage with 2% body mass of feed pellets, either before or after fasting for 7 days in fasting tolerant (FT) or fasting sensitive (FS) phenotypes (see Fig. 5)
SDA variable
Tpeak(h) ṀO2,peak(mmol O2h−1fish−1) TSDA(h) CSDA(mmol O2)
Overall (N=20) – – – –
SDA 1 (before fasting) 19.5±2.0 3.85±0.16 47.4±2.7 94.3±6.5 SDA 2 (after fasting) 15.8±2.0 3.21±0.16‡ 59.3±2.7‡ 103.2±6.5
FT (N=11) 20.9±1.9 3.40±0.18 55.9±3.1 93.6±8.0 SDA 1 (before fasting) 22.9±2.8 3.68±0.22 51.2±3.6 89.1±8.7 SDA 2 (after fasting) 19.9±2.8 3.12±0.22‡ 60.8±3.6‡ 98.2±8.7
FS (N=9) 14.4±2.1* 3.66±0.21 50.8±3.4 103.8±8.9 SDA 1 (before fasting) 16.1±3.1 4.02±0.25 43.7±3.9 99.5±9.6 SDA 2 (after fasting) 12.8±3.1 3.30±0.25† 57.9±3.9† 108.1±9.6
Phenotypes were compared for the two conditions (before versus after fasting) by two-way ANOVA for repeated measures, one factor being phenotype, repeated measure being the variable across the two measurement intervals, and each fish a subject. Rates of oxygen uptake are corrected to fish with a mass of 130 g (see Materials and methods for details). Tpeak, time to peak SDA; ṀO2,peak, maximum net increase in ṀO2due to SDA; TSDA, total time to complete SDA; CSDA, SDA coefficient.
*Difference between phenotypes for that measure.
The Journal of Experimental Biology
RESEARCH ARTICLE The Journal of Experimental Biology (2014) doi:10.1242/jeb.101857
significantly lower than for fasted FS (Table 3). The corresponding values for ṀO2showed no effect of phenotype (F=0.84, P=0.36) but
a highly significant effect of the fast (F=50.72, P<0.001) with no interaction. Thus ṀO2 was similar in both phenotypes and both
showed a similar significant decline after the fast (Table 3). For AQ, there was no significant overall effect of phenotype (F=0.34, P=0.56) but a highly significant effect of the fast (F=47.11, P<0.001) and highly significant interaction (F=8.18, P=0.007). As seen in Table 3, this interaction occurred because AQ was statistically similar in both phenotypes during the SDA, but it then declined significantly after the fast and the fasted value was significantly lower in the FT compared with the FS phenotype (Table 3).
Fig. 4 shows the relationship between AQ at the end of the 7-day fast and the mean rate of mass loss over the 7 days. There was a clear dependence of individual mass loss on the fasted AQ and there was no difference between phenotypes in either gradient or intercept. They both showed the same significant relationship whereby the greater the AQ, the greater the rate of mass loss (Fig. 4). It is visible from Fig. 4, however, that the two phenotypes were arranged at opposing ends of this spectrum, which is consistent with the fact that the fasted AQ was significantly lower in FT compared with FS (Fig. 4, Table 3).
DISCUSSION
The respirometry results did not support the hypotheses that the difference between the phenotypes in their tolerance of food deprivation, measured as rate of mass loss, was due to differences in RMR and the extent to which gut function was downregulated during fasting. The Ṁammand AQ data supported the hypothesis that
the different rates of mass loss by the two phenotypes during fasting directly reflected differences in substrate utilisation, specifically their relative utilisation of proteins as metabolic fuels.
Fasting tolerance did not reflect phenotypic variation in RMR or relative downregulation of gut function
We found no evidence for our first hypothesis. The data clearly demonstrate that the contrasting phenotype differences in tolerance
of fasting were not due to differences in routine energy expenditure, at least over 7 days. This is consistent with previous results comparing RMR in rapid growth versus fasting tolerant phenotypes, where no difference was measured over 48 h in post-absorptive animals (Dupont-Prinet et al., 2010). It is conceivable that an even longer period of food deprivation might have caused a difference to emerge between FT and FS in the current study, although the data do not provide any inkling that phenotypic differences in RMR might appear as fasting progressed. The progressive decline in RMR was essentially identical in both phenotypes and there was no evidence of a steeper decline in the FT individuals, despite the fact that they were losing mass at a significantly slower rate.
Consistent with this absence of phenotypic differences in RMR, we also found no evidence for different levels of gut downregulation between the phenotypes. The 7-day fast had a similar dampening and lengthening effect on the SDA response in both FT and FS. The gastrointestinal tract is one of the most expensive organ systems to maintain in ectotherms, including fishes (for a review, see Lignot, 2012). In the current study, the general decline in RMR during fasting may have, at least partially, reflected its progressive downregulation. In fishes, food deprivation causes rapid changes in the morphology of the intestine, within 2−3 days, that can include reduction in gut length and surface area, a decline in complexity and thickness of the mucosae of the small intestine, and reduced activities of digestive enzymes (Bar and Volkoff, 2012; Lignot, 2012; Zeng et al., 2012; Zeng et al., 2014). Such morphological and biochemical changes during fasting have been shown to influence digestion of a subsequent first meal in the southern catfish Silurus
meridionalis (Zeng et al., 2014), with a dampening and slowing of
the SDA response, similar to the current study. In the sea bass, the lower ṀO2,peakand longer overall TSDAafter fasting clearly indicated
a less intense response that took longer to complete. The absence of any effect of fasting on CSDAindicated that this was not associated
with any change in overall net energetic costs of digestion and assimilation. These results should be interpreted with some caution because it is not yet known what contributes to the transient rise in metabolic rate that comprises the SDA response in fishes (McCue,
Table 3. Mean (±s.e.m.) rates of ammonia excretion (Ṁamm), oxygen uptake (ṀO2) and their ratio, the ammonia quotient (AQ), either at 18 h of a 72-h SDA response prior to fasting, or after a 7-day period of fasting, in fasting tolerant (FT) or fasting sensitive (FS) phenotypes (see Fig. 5)
Ṁamm ṀO2 AQ
(mmol h−1fish−1) (mmol h−1fish−1) (Ṁ amm/ṀO2) Overall (N=35) – – – During SDA 0.90±0.04 9.55±0.28 0.097±0.005 After fasting 0.33±0.04‡ 6.74±0.28‡ 0.049±0.004‡ FT (N=18) 0.63±0.04 8.33±0.29 0.071±0.004 During SDA 0.96±0.06 9.83±0.40 0.105±0.006 After fasting 0.24±0.05*,‡ 6.84±0.40‡ 0.038±0.006*,‡ FS (N=17) 0.60±0.04 7.96±0.29 0.075±0.004 During SDA 0.85±0.06 9.27±0.40 0.089±0.007 After fasting 0.41±0.06† 6.64±0.40‡ 0.064±0.007‡
Phenotypes were compared for the two conditions (during the SDA versus after fasting) by two-way ANOVA for repeated measures, one factor being phenotype, the repeated measure being the variable across the two measurement intervals, and each fish a subject. Rates are corrected to a fish with a mass of 130 g (see Materials and methods for details).
*Difference between phenotypes for that measure.
‡Difference across trials for that measure (Holm–Sidak post hoc test, P<0.05). 1.2 1.0 0.8 0.6 0.4 0.2 0
Rate of mass loss (g day
–1
fish
–1)
0 0.02 0.04 0.06 0.08 0.10 0.12 Ammonia quotient
Fig. 4. Least-squares linear regression of the relationship between individual mean ammonia quotient at the end of a 7-day fast and individual mean rate of mass loss over this interval (see Materials and methods for details). Fasting tolerant phenotypes are grey symbols, fasting
sensitive are dotted symbols. The relationship was significant and linear (N=35, R2=0.51, P<0.0001) with no difference in slope (GLM ANCOVA, F=0.09, P=0.77) or intercept (F=0.19, P=0.66) between phenotypes. The
The Journal of Experimental Biology
2006; Altimiras et al., 2008; Dupont-Prinet et al., 2009). There may be elements related to intestinal function, such as excreting ions to manipulate pH in stomach and small intestine, then active absorption of nutrients. Reduction in the efficiency or rapidity of these gastrointestinal processes after fasting (Zeng et al., 2012; Zeng et al., 2014) may slow down nutrient absorption and, therefore, dampen and protract other elements of the SDA outside the intestine (Dupont-Prinet et al., 2009; Zeng et al., 2014), such as protein synthesis within tissues (McCue, 2006; Fraser and Rogers, 2007). Whatever may have caused this effect of fasting on the SDA response, there was no difference between the phenotypes.
Having discarded the first hypothesis, the salient result to emerge from the respirometry during the 7-day fast was that, for any given RMR, the FT phenotypes were losing mass at a slower rate than the FS. It was interesting that, within the two phenotype populations, there was an identical positive dependence of rate of mass loss on individual RMR during the fast, which has previously been demonstrated in sea bass (Killen et al., 2011). This is consistent with the fact that, irrespective of what substrates might be being used as fuels by the phenotypes, greater individual costs of living will necessarily deplete reserves more rapidly, causing a more rapid loss of body mass (McCue, 2010; Bar and Volkoff, 2012). The significant difference in the intercepts of these two linear relationships is consistent, however, with the second hypothesis, whereby the two phenotypes differed in their relative use of metabolic substrates.
Fasting tolerance reflected phenotypic variation in the relative use of proteins as metabolic fuels
The current data provide clear evidence that the phenotypes differed in their reliance on proteins as metabolic fuels during fasting. They presumably therefore also differed in their relative use of the other fuels, in particular lipids, a supposition that is supported by the direct relationship between individual AQ and rate of mass loss.
Proteins are not stored as energy reserves so, when feeding, carnivorous fishes excrete large amounts of ammonia that presumably reflects deamination of exogenous proteins, from their food, with some contribution of endogenous amino acids from tissue protein turnover (Brett and Zala, 1975; Owen et al., 1998; Owen et al., 1999). This therefore explains the high rates of Ṁammin both phenotypes at
the peak of their SDA. The reduction in Ṁamm and AQ in both
phenotypes after fasting clearly indicates that they had reduced their reliance on protein as a metabolic fuel, a response that has been described in many other fish species (Brett and Zala, 1975; Jobling, 1980; Lauff and Wood, 1996a; McKenzie et al., 2007). Fasting has three phases in all vertebrates, which are under hormonal control and characterised by the endogenous fuels that are utilised (for reviews, see McCue, 2010; Bar and Volkoff, 2012). Phase I, which is transient and short (a few days), uses a mixture of protein, lipids and carbohydrates, then Phase II relies most heavily on stored lipids, until these are depleted at which point the animal enters Phase III, when it is in a state of starvation and uses structural proteins as fuels. These phases have not been explicitly investigated in sea bass (Pastoureaud, 1991) but, in farmed individuals, lipids are rapidly mobilised, in particular from perivisceral stores, within the first few days of fasting at 22°C, a temperature similar to the current study (Echevarría et al., 1997; Chatzifotis et al., 2011). Lipids then constitute a major fuel for at least 50 days of extended fasting at that temperature, beyond which there is evidence of increased reliance on proteins, hence presumably entry into true starvation, Phase III (Echevarría et al., 1997; Chatzifotis et al., 2011). Furthermore, although data for European sea bass are not available, in all other fishes the evidence indicates that a
mixture of proteins and lipids are used during Phases I and II, albeit with a reduced reliance on protein and increased reliance on lipids as fasting progresses from Phase I to Phase II (Bar and Volkoff, 2012).
The current results indicate that the phenotypes differ significantly in their relative use, or reliance upon, proteins during the initial phases of fasting. Furthermore, it was very interesting that the FT phenotypes showed a much more profound decline in Ṁammand AQ
when comparing their peak SDA with the last day of the fast. This of course reflects a lesser reliance on proteins as fuels in this phenotype. Furthermore, the direct linear relationship between individual AQ and rate of mass loss during the fast is very intriguing, providing strong circumstantial evidence that the less an individual’s reliance on proteins, the greater their reliance on energy-rich lipids; hence the slower rate of mass loss. This speculation is supported by the fact that fasting tolerant phenotypes of sea bass tend to accumulate more lipids when feeding under routine culture conditions, both as intramuscular fat and in perivisceral stores (Grima et al., 2010; Daulé et al., 2013). Future studies are needed to explore the mechanisms by which the two phenotypes show such differences in fuel use, and how these are related to the differences in accumulation of tissue lipid reserves.
Energetic strategies in the sea bass: conclusions and perspectives
Although the phenotypes in this study were from families selected for their relative tolerance of food deprivation, they nonetheless showed clear evidence of the trade-off between tolerance of food deprivation and compensatory growth rate that has previously been described in D. labrax (Dupont-Prinet et al., 2010). That is, in the fasting/feeding cycles, the FT phenotypes lost mass significantly more slowly than the FS when fasting but also had significantly lower rates of compensatory growth when refeeding (Dupont-Prinet et al., 2010). Thus the data confirm the existence of opposing energetic strategies in this species. There was also evidence that, similar to the rapid growth phenotypes studied by Dupont-Prinet et al. (Dupont-Prinet et al., 2010), the more rapid compensatory growth by FS phenotypes was linked to a capacity to process meals faster. In the current study, the FS had a shorter Tpeak, the time to engage
the full SDA response. The absence of more profound differences in SDA variables may have been because we selected phenotypes for differences in tolerance of food deprivation, not phenotypes that occupied the extremes of the trade-off between fasting tolerance and growth rate (Dupont-Prinet et al., 2010).
We now have unequivocal evidence, however, that this trade-off does not simply reflect differences in metabolic rate, as originally proposed (Bang and Grønkjær, 2005; Bang et al., 2007; Dupont-Prinet et al., 2010). Thus the contrasting strategies remain the same: either rapid growth or tolerance of fasting, but the mechanism underlying the trade-off requires reinterpretation. It seems most parsimonious, given the evidence of differences in tissue lipid accumulation (Grima et al., 2010; Daulé et al., 2013) and use of proteins as fuels during fasting (present study), to speculate that the trade-off reflects differences in the way that dietary proteins and lipids are used. That is, rapid growth phenotypes preferentially channel dietary proteins into tissue growth, and so rely more on lipids for day-to-day energy while feeding, but then have fewer reserves when they must endure food deprivation. They therefore burn more tissue proteins and so lose mass more rapidly. By contrast, the slower compensatory growth rate (and SDA response) in starvation-tolerant phenotypes may be linked to preferential accumulation of lipid reserves rather than somatic tissue growth (Grima et al., 2010; Daulé et al., 2013). Lipids are energy-dense
The Journal of Experimental Biology
RESEARCH ARTICLE The Journal of Experimental Biology (2014) doi:10.1242/jeb.101857
with low water content, so mass gain from a given ration may be less if dietary lipids were preferentially stored rather than burned when the animals were feeding. These lipids would then be available to sustain metabolism during fasting. This is speculation and requires confirmation in future studies. Such a mechanism might predict that, when feeding, FT phenotypes would excrete ammonia at higher rates, with a higher AQ. We did not observe this, but our brief period of measurement and small sample sizes may not have been sufficient to capture any such effect.
The selective forces underlying these strategies for substrate storage and utilisation in sea bass must be linked to their life cycle in the Western Mediterranean, where they are a genetically distinct population (García De Léon et al., 1997). Adult sea bass spawn offshore in winter/spring and the pelagic larvae then drift inshore where, in spring, they colonise sheltered coastal habitats such as estuaries and lagoons (Pickett and Pawson, 1994). In the Western Mediterranean, an extensive mosaic of coastal lagoons provides important nursery habitats for sea bass larvae (Dufour et al., 2009). The juveniles grow in the lagoons for a first summer but then migrate out to sea as water temperatures drop in late autumn, to overwinter offshore. Sea bass of many age classes then occupy the lagoons seasonally, as they grow to maturity (Quignard, 1984; Dumay et al., 2004). Lagoons are highly productive environments but have great diversity and variability in biotic and abiotic conditions (Kjerfve, 1994). The sea bass presumably cannot be sure of the conditions they will encounter, particularly the juveniles for whom the first summer of feeding in the lagoon may be critical for their survival over winter offshore. The stochastic nature of the lagoon environments, and the seasonal migrations between them and the open sea, may provide the disruptive selection pressures underlying the co-existence of the opposing strategies, for either rapid growth to avoid predation or accumulation of tissue lipid reserves to tolerate starvation. It is well established that strategies for reserve accumulation in expectation of low food availability underlie individual variation in adiposity in mammals (Speakman et al., 2011; Heitmann et al., 2012). The current study provides evidence that such strategies are also observed in fishes.
MATERIALS AND METHODS
Experimental animals and selection of extreme phenotypes The fish population (European sea bass, D. labrax) was produced and maintained at the Ifremer Station Expérimentale d’Aquaculture, Palavas-les-Flots, France. The parental broodstock was selected from among a population of 1920 fish studied previously (Dupont-Prinet et al., 2010; Grima et al., 2010), who were offspring of a full factorial mating involving 41 sires and eight dams collected from the wild in the West Mediterranean. The current broodstock comprised a group of 200 full and half-sib families derived from a fully factorial mating design combining two sets of five dams and 20 sires, divergently selected for their relative tolerances of food deprivation, measured as their relative rate of mass loss when fasted for 3 weeks, exactly as described by Daulé et al. (Daulé et al., 2013). Fertilised eggs from both selected groups were mixed in equal volumes at 48 h fertilisation, and were hatched and reared until an age of 227 days post-fertilisation (dpf) as described by Daulé et al. (Daulé et al., 2013).
At 227 dpf, 2000 fish were randomly chosen and individually tagged with a passive integrated transponder (PIT; AEG-Id, www.aegid.de). The tagged fish were stocked in a single 5 m3tank within a recirculating bio-filtered system, with water at 20°C, a salinity of 37 g l−1and under a photoperiod of 12 h:12 h light:dark. Fish were fed ad libitum by self-feeder for a period of 6 weeks. Every 3 weeks they were anaesthetised (2-phenoxy-ethanol 0.4 ml l−1), individually identified using a PIT tag reader, weighed to the nearest 0.1 g and their fork length measured to the nearest 1 mm. They were then submitted to two successive fasting/feeding cycles each comprising 3 weeks of food deprivation and 3 weeks ad libitum refeeding by self-feeder,
with their body mass and fork length measured as described above at the end of each of the deprivation versus re-feeding periods as described previously (Dupont-Prinet et al., 2010; Grima et al., 2010; Daulé et al., 2013).
At the end of the challenges (314 dpf), individual tolerance of fasting was calculated as the residual average mass loss (based on individual daily growth coefficient, DGC) during the two periods of food deprivation, when corrected for the effects of initial mass (at 227 dpf) and initial DGC (from 227 to 276 dpf), as described previously (Grima et al., 2010; Daulé et al., 2013). A frequency distribution of relative tolerance was then developed among the 1804 individuals that survived the challenges and retained their PIT tags. Two hundred and forty individuals were chosen that represented the fraction of the population between the seventh and the third percentiles at opposing extremes of this distribution, phenotypes designated as either FT that lost mass relatively slowly (on average +1.55 s.d. of residual mean rate of mass loss) or FS that lost mass relatively fast (on average −1.52 s.d. of residual mass loss). The biometrics data of the selected phenotypes was retrieved, to calculate SGR during initial routine growth and the fasting/feeding cycles, as described by McKenzie et al. (McKenzie et al., 2007), where SGR was negative during fasting (Dupont-Prinet et al., 2010). All SGR values were corrected for initial length, for each interval, as described in Dupont-Prinet et al. (Dupont-Prinet et al., 2010).
The chosen individuals were stocked in a single tank (volume 3 m3) supplied with biofiltered seawater at a photoperiod of 16 h:8 h light:dark, and reared until an age of ~380 dpf and a mass of ~130 g, while fed daily ad libitum on the commercial feed. This period of growth, during which the fish approximately doubled in average body mass, ensured that the individuals studied for their respiratory metabolism (see below) were in a similar nutritional state and their physiology and behaviour were not directly influenced by any responses to the repeated starvation and refeeding protocol (Dupont-Prinet et al., 2010; Rubio et al., 2010; Killen et al., 2011). For experiments, animals were netted at random from the holding tank, their phenotype determined (PIT tag), and then they were placed together in groups of eight (four FT and four FS) in small (0.1 m3) tanks with a flow of biolfiltered seawater at 20°C, and fasted for 96 h prior to use. Eight individuals were therefore studied at a time, comparing four FT and four FS for each experimental series.
Investigation of physiological mechanisms underlying phenotypic variation in tolerance of fasting
Fig. 5 shows the protocol that each individual was submitted to. The experiments involved constant measurement of metabolic rate by automated respirometry, as rates of oxygen uptake (Steffensen, 1989). Each fish was
Days elapsed 1 2 3 4 5 6 7 8 9 10 11 12 13 14 15 16 17 Ammonia excretion Ammonia excretion Sham SDA 1 Fast SDA 2
Fig. 5. Protocol for respirometry on sea bass over 17 days comprising a sham-feeding protocol (Sham), a first gavage and measurement of SDA 1, a 7-day fast and then a second gavage and SDA (SDA 2). Ammonia
excretion (blue rectangles) was measured over 4 h, starting at 18 h after the first SDA, or at the end of the 7-day fast. See Materials and methods for more details.
The Journal of Experimental Biology
submitted to four sequential treatments over a total of 16 days, namely a sham force-feeding treatment over 72 h, then measurement of a first SDA test over 72 h, then a 7-day period of food deprivation, and finally a second SDA test, also over 72 h (Fig. 5). Rates of ammonia excretion were measured twice by point sampling, at 18 h after the first SDA test, and on the last day of food deprivation (Fig. 5).
Hypothesis 1: phenotypic variation in tolerance of food deprivation reflects differences in mass-specific routine metabolic rate (RMR) and gut downregulation when fasting
For the sham treatment, the sea bass were lightly anaesthetised in phenoxy ethanol (0.3 ml l−1, Sigma-Aldrich, www.sigmaaldrich.com) in their holding tank until righting reflexes were lost. A pair of plastic forceps was inserted as far as the stomach for each individual, three times, to mimic the handling procedures employed during force-feeding for the SDA response. The animals were then transferred to one of eight respirometers (volume 3000 ml), immersed in a tank provided with a constant flow of aerated biofiltered seawater at 20°C. Oxygen uptake was then measured for 72 h as described below (Fig. 5). This sham operation allowed correction for the effects on metabolic rate of the handling required to measure the SDA response. In order to measure the SDA response, individual sea bass were removed from their respirometer and lightly anaesthetised as described above. They were measured for their mass, to the nearest 0.1 g, and then force-fed a ration of their pellet food equivalent to 2% of their body mass, placed into their stomach with the plastic forceps (Axelsson et al., 2002; Altimiras et al., 2008; Dupont-Prinet et al., 2009; Dupont-Prinet et al., 2010). Their O2uptake was then measured for 72 h while they digested the meal (Fig. 5). They were then removed from their respirometer, wrapped in a damp cloth to keep them calm and rapidly weighed once again and replaced in their respirometer (less than 1 min total air-exposure). Their oxygen uptake was then measured continuously for 7 days (168 h; Fig. 5). At the end of this period, they were removed from their respirometer and lightly anaesthetised as described above, weighed and then force-fed the same ration as for the SDA prior to fasting. Their O2 uptake was then measured for 72 h while they digested the second meal (Fig. 5).
The tank containing the respirometers was isolated in a constant temperature chamber, regulated at 20°C and with a photoperiod of 12 h:12 h light:dark. Disruption was kept to a minimum during all measurements, lighting was low in the chamber and the water surface was shielded with translucent black plastic to reduce visual disturbance of the fish. Fish could not see each other or interact while in the separate respirometers during measurement of oxygen consumption. All handling was performed between 15:00 and 16:00 h each day so that any effects of circadian rhythms on metabolic rate should have been comparable among treatments (McKenzie et al., 2007; McKenzie et al., 2013).
Measurements of oxygen uptake (ṀO2) were made once every 30 min in all experiments, by intermittent stopped-flow respirometry (Steffensen, 1989), as described previously (McKenzie et al., 2007; Killen et al., 2011; McKenzie et al., 2013). Briefly, aerated water from the outer tank was flushed through the respirometers by a submersible pump that was set to turn on and off for alternating 15 min periods. Water oxygen levels in the respirometers were measured and recorded every 15 s with optodes (Oxy-10 mini; PreSens Precision Sensing GmbH, www.presens.de) and associated software (Pre-Sens Oxy 4v2). When the submersible pumps were not on, there was a decline in O2in the chamber due to uptake by the fish, which was recorded by the optode. Rates of oxygen uptake were then calculated in mmol O2kg−1h−1using linear least-squares regression during each closed phase, excluding the first 2 min considering the rate of decline in oxygen content, the mass of the fish, volume of water and the solubility of oxygen in seawater at 20°C (McKenzie et al., 2007; McKenzie et al., 2013). When fish were removed from their respirometers for handling (see above), background ṀO2due to bacterial respiration was measured. This never exceeded 5% of the ṀO2of the fish and was usually insignificant, so no corrections were applied. All ṀO2 values were then corrected to an individual fish with a mass of 130 g, using the mass coefficient calculated empirically by Lemarié et al. (Lemarié et al., 1992).
Routine metabolic rate (RMR) can be defined as the metabolic rate of post-absorptive, undisturbed animals, including costs of random activity and
the maintenance of posture and equilibrium (Killen et al., 2011). In the current study, a value for RMR of each individual was calculated for each 12 h during the 7 days of fasting (in mmol O2h−1fish−1) based on the mean of the cyclical 30 min measurements. For the first 24 h, this value will have included effects of stress due to handling. An individual mean RMR was calculated for the entire 7 days (in mmol O2h−1fish−1), including the first day as the stress will have contributed to mass loss. Rate of mass loss was calculated during fasting, and corrected for initial mass as described in Killen et al. (Killen et al., 2011), to provide a value (in g day−1fish−1) averaged over the entire 7 days.
The SDA response was calculated empirically for each individual (Jordan and Steffensen, 2007; McKenzie et al., 2013). To correct for effects of handling on metabolic rate, ṀO2 values from the sham treatment were subtracted from the true SDA treatment, respirometry cycle by cycle. It was assumed that any net difference in ṀO2was due to the SDA (McKenzie et al., 2013). Hourly averages were then taken for each individual. The peak response (ṀO2,peak) was taken as the maximum difference between fed and fasted ṀO2, and the time to this (Tpeak) was identified for each individual (Dupont-Prinet et al., 2009; McKenzie et al., 2013). The total duration of the SDA (DSDA) was estimated as the time required to return to within 5% of the ṀO2 measured prior to the SDA, for at least two consecutive measurements (i.e. 60 min). The total area of the SDA, the SDA coefficient (CSDA), was then calculated by integrating under the resulting curve (McKenzie et al., 2013).
Hypothesis 2: phenotypic variation in tolerance of food deprivation reflects differences in substrate utilisation
These experiments involved measurements of ammonia excretion by the fish at defined moments in the protocol described above (Fig. 5), to compare with the simultaneous measures of oxygen consumption. Each respirometer was immersed in water in an individual outer tank (total volume 20 l), with eight of these tanks arranged within a large tank (total floor area 1 m2) that received a constant flow of aerated seawater at 20°C. Each small tank received a constant flow of this seawater, delivered by a submersible pump in the outer large tank. This flow returned via an overflow, such that total water volume in the small tank was ~12 l. Volume was measured exactly by mass. Water level in the small tanks was 5 cm higher than in the outer tank, such that when the pump providing flow to each small tank was turned off, they became individual isolated units. Each small tank had an airstone to ensure that water was fully aerated and mixed at all times.
To measure ammonia excretion, flow to the small tanks was stopped and water samples collected into 10 ml test tubes at the beginning and the end of a 4 h closure period, starting at 09:00 h on the day in question (Fig. 5). Samples were always collected immediately after a period of respirometer flushing (see above), to ensure that water ammonia levels were equilibrated between respirometer chamber and small outer tank. Samples were frozen at −20°C until analysis by the method of Bower and Holm-Hansen (Bower and Holm-Hansen, 1980), using reagents obtained from Sigma-Aldrich. Measurements were made at 18 h after the first force-feeding, during the first SDA response, and on the last day of the fasting (Fig. 5). Rates of ammonia excretion (Ṁamm) were calculated (in mmol kg−1h−1) as described previously (McKenzie and Randall, 1990), considering the increase in ammonia concentration during the closure period, the time elapsed and the mass of the fish. Excretion rates were then corrected for the mass of the fish, either as measured before the first SDA or at the end of the fasting period, by plotting mass specific rates against mass and calculating residual rates for each individual when corrected to a mean mass of 130 g. Ammonia quotients (AQ) were then calculated for each individual in each condition, by dividing Ṁammby the corresponding mean rate of ṀO2for the 4 h period when ammonia excretion was measured.
Statistical analysis
Statistics were performed with Sigmastat (Systat Inc., www.systat.com) or SAS (SAS Institute, www.sas.com). In all cases, data were checked for normality and homogeneity of variance prior to application of parametric tests. The SGR of the selected FT and FS phenotypes, during routine conditions and the fasting/feeding cycles, were each compared by general linear model (GLM) procedure two-way ANOVA for repeated measures,
The Journal of Experimental Biology
RESEARCH ARTICLE The Journal of Experimental Biology (2014) doi:10.1242/jeb.101857
with one factor phenotype, the repeated factor the two measures of SGR for each condition, and each fish as a subject. Effects of the 7-day experimental fast on repeated measurements (RMR, derived SDA variables, ammonia excretion and quotients) were also assessed by two-way ANOVA for repeated measures, with one factor phenotype and the repeated factor the variable under consideration, with each fish as a subject. In those cases where a significant difference was observed in a two-way ANOVA, Holm-Sidak post hoc tests were undertaken to identify where the difference lay. Mean RMR and mean rate of mass loss for the entire 7-day period were compared between phenotypes by t-test. The relationships between RMR and rates of mass loss during fasting, and between AQ and rates of mass loss during fasting, were described by GLM ANCOVA, with mass loss as the dependent variable and phenotype as a class. An initial ANCOVA was run to evaluate the significance of the relationship and homogeneity of slopes between phenotypes. When slopes were found to be statistically indistinguishable, a single regression model was run to evaluate and compare intercepts between phenotypes. The level of statistical significance was taken as P<0.05.
Acknowledgements
This research was funded by the Agence Nationale pour la Recherche (ANR-09-GENM-003) and the Centre National de la Recherche Scientifique (CNRS). The authors are grateful to Denis Chabot for custom-designed software used to calculate oxygen uptake.
Competing interests
The authors declare no competing financial interests. Author contributions
D.J.M., B.C., M.V., E.D. and B.G. conceived and designed the experiments; D.J.M., A.V., B.C., M.V., E.D., J.F.S. and B.G. all contributed to execution of the experiments; D.J.M., B.C., M.V., E.D., J.F.S. and B.G. contributed to interpretation of the findings being published; D.J.M., M.V. and B.G. drafted and revised the article.
Funding
This research received no specific grant from any funding agency in the public, commercial, or not-for-profit sectors.
References
Altimiras, J., Claireaux, G., Sandblom, E., Farrell, A. P., McKenzie, D. J. and Axelsson, M. (2008). Gastrointestinal blood flow and postprandial metabolism in swimming sea bass Dicentrarchus labrax. Physiol. Biochem. Zool. 81, 663-672. Arendt, J. D. (1997). Adaptive intrinsic growth rates: an integration across taxa. Q.
Rev. Biol. 72, 149-177.
Axelsson, M., Altimiras, J. and Claireaux, G. (2002). Post-prandial blood flow to the gastrointestinal tract is not compromised during hypoxia in the sea bass Dicentrarchus labrax. J. Exp. Biol. 205, 2891-2896.
Bang, A. and Grønkjær, P. (2005). Otolith size-at-hatch reveals embryonic oxygen consumption in the zebrafish, Danio rerio. Mar. Biol. 147, 1419-1423.
Bang, A., Grønkjær, P., and Folkvord, A. (2007). Possible fitness costs of high and low standard metabolic rates in larval herring Clupea harengus, as determined by otolith microstructure. Mar. Ecol. Prog. Ser. 331, 233-242.
Bar, N. and Volkoff, H. (2012). Adaptation of the physiological, endocrine, and digestive system functions to prolonged food deprivation in fish. In Comparative Physiology of Fasting, Starvation, and Food Limitation (ed. M. D. McCue), pp. 69-89. Berlin: Springer.
Barwell, N. D., Malkova, D., Leggate, M. and Gill, J. M. R. (2009). Individual responsiveness to exercise-induced fat loss is associated with change in resting substrate utilization. Metabolism 58, 1320-1328.
Bochdansky, A. B., Grønkjær, P., Herra, T. P. and Leggett, W. C. (2005). Experimental evidence for selection against fish larvae with high metabolic rates in a food limited environment. Mar. Biol. 147, 1413-1417.
Bower, C. E. and Holm-Hansen, T. (1980). A salicylate–hypochlorite method for determining ammonia in seawater. Can. J. Fish. Aquat. Sci. 37, 794-798. Brett, J. R. and Zala, C. A. (1975). Daily pattern of nitrogen excretion and oxygen
consumption of sockeye salmon (Oncorhynchus nerka) under controlled conditions. J. Fish. Res. Board Can. 32, 2479-2486.
Byström, P., Andersson, J., Kiessling, A. and Eriksson, L.-O. (2006). Size and temperature dependent foraging capacities and metabolism : consequences for winter starvation mortality in fish. Oikos 115, 43-52.
Chatzifotis, S., Papadaki, M., Despoti, S., Roufidou, C. and Antonopoulou, E. (2011). Effect of starvation and re-feeding on reproductive indices, body weight, plasma metabolites and oxidative enzymes of sea bass (Dicentrarchus labrax). Aquaculture 316, 53-59.
Daulé, S., Vandeputte, M., Vergnet, A., Guinand, B., Grima, L. and Chatain, B. (2013). Effect of selection for fasting tolerance on feed intake, growth and feed
efficiency in the European sea bass Dicentrarchus labrax. Aquaculture 420-421, Suppl. 1, S42-S49.
Dufour, V., Cantou, M. and Lecomte, F. (2009). Identification of sea bass (Dicentrarchus labrax) nursery areas in the north-western Mediterranean Sea. J. Mar. Biol. Assoc. U. K. 89, 1367-1374.
Dumay, O., Tari, P. S., Tomasini, J. a. and Mouillot, D. (2004). Functional groups of lagoon fish species in Languedoc Roussillon, southern France. J. Fish Biol. 64, 970-983.
Dupont-Prinet, A., Claireaux, G. and McKenzie, D. J. (2009). Effects of feeding and hypoxia on cardiac performance and gastrointestinal blood flow during critical speed swimming in the sea bass Dicentrarchus labrax. Comp. Biochem. Physiol. 154A, 233-240.
Dupont-Prinet, A., Chatain, B., Grima, L., Vandeputte, M., Claireaux, G. and McKenzie, D. J. (2010). Physiological mechanisms underlying a trade-off between growth rate and tolerance of feed deprivation in the European sea bass (Dicentrarchus labrax). J. Exp. Biol. 213, 1143-1152.
Echevarría, G., Martínez-Bebiá, M. and Zamora, S. (1997). Evolution of biometric indices and plasma metabolites during prolonged starvation in European sea bass (Dicentrarchus labrax, L.). Comp. Biochem. Physiol. 118A, 111-123.
Ellis, A. C., Hyatt, T. C., Hunter, G. R. and Gower, B. A. (2010). Respiratory quotient predicts fat mass gain in premenopausal women. Obesity 18, 2255-2259. Fraser, K. P. P. and Rogers, A. D. (2007). Protein metabolism in marine animals: the
underlying mechanism of growth. Adv. Mar. Biol. 52, 267-362.
García De Léon, F. J., Chikhi, L. and Bonhomme, F. (1997). Microsatellite polymorphism and population subdivision in natural populations of Europe sea bass Dicentrarchus labrax (Linnaeus 1758). Mol. Ecol. 6, 51-62.
Gotthard, K. (1998). Life history plasticity in the satyrine butterfly Lasiommata petropolitana: investigating an adaptive reaction norm. J. Evol. Biol. 11, 21-39. Grima, L., Vandeputte, M., Ruelle, F., Vergnet, A., Mambrini, M. and Chatain, B.
(2010). In search for indirect criteria to improve residual feed efficiency in sea bass (Dicentrarchus labrax). Aquaculture 300, 50-58.
Heermann, L., Eriksson, L.-O., Magnhagen, C. and Borcherding, J. (2009). Size-dependent energy storage and winter mortality of perch. Ecol. Freshwat. Fish 18, 560-571.
Heitmann, B. L., Westerterp, K. R., Loos, R. J. F., Sørensen, T. I. A., O’Dea, K., McLean, P., Jensen, T. K., Eisenmann, J., Speakman, J. R., Simpson, S. J. et al. (2012). Obesity: lessons from evolution and the environment. Obes. Rev. 13, 910-922. Hervant, F. (2012). Starvation in subterranean species versus surface-dwelling species: crustaceans, fish, and salamanders. In Comparative Physiology of Fasting, Starvation, and Food Limitation (ed. M. D. McCue), pp. 91-102. Berlin; Heidelberg: Springer. Jobling, M. (1980). Effects of starvation on proximate chemical composition and
energy utilization of plaice, Pleuronectes platessa L. J. Fish Biol. 17, 325-334. Jordan, A. D. and Steffensen, J. F. (2007). Effects of ration size and hypoxia on
specific dynamic action in the cod. Physiol. Biochem. Zool. 80, 178-185.
Kieffer, J. D. and Wakefield, A. M. (2009). Oxygen consumption, ammonia excretion and protein use in response to thermal changes in juvenile Atlantic salmon Salmo salar. J. Fish Biol. 74, 591-603.
Killen, S. S., Marras, S. and McKenzie, D. J. (2011). Fuel, fasting, fear: routine metabolic rate and food deprivation exert synergistic effects on risk-taking in individual juvenile European sea bass. J. Anim. Ecol. 80, 1024-1033.
Kjerfve, B. (1994). Coastal Lagoon Processes (Elsevier Oceanography Series). Amsterdam: Elsevier.
Lauff, R. F. and Wood, C. M. (1996a). Respiratory gas exchange, nitrogenous waste excretion, and fuel usage during aerobic swimming in juvenile rainbow trout. J. Comp. Physiol. B 166, 501-509.
Lauff, R. F. and Wood, C. M. (1996b). Respiratory gas exchange, nitrogenous waste excretion, and fuel usage during starvation in juvenile rainbow trout, Oncorhynchus mykiss. J. Comp. Physiol. B 165, 542-551.
Lauff, R. F. and Wood, C. M. (1997). Effects of training on respiratory gas exchange, nitrogenous waste excretion, and fuel usage during aerobic swimming in juvenile rainbow trout (Oncorhynchus mykiss). Can. J. Fish. Aquat. Sci. 54, 566-571. Lemarié, G., Gasset, E., Cam, D. and de la Fonchais, E. (1992). Modélisationde la
consommation en oxygène du loup (Dicentrarchus labrax L.) et la daurade (Sparus auratus L.). Ichtyophysiologia Acta 15, 55-68.
Lignot, J. (2012). Changes in form and function of the gastrointestinal tract during starvation: from pythons to rats. In Comparative Physiology of Fasting, Starvation, and Food Limitation (ed. M. D. McCue), pp. 217-236. Berlin; Heidelberg: Springer. McCue, M. D. (2006). Specific dynamic action: a century of investigation. Comp.
Biochem. Physiol. 144A, 381-394.
McCue, M. D. (2010). Starvation physiology: reviewing the different strategies animals use to survive a common challenge. Comp. Biochem. Physiol. 156A, 1-18. McKenzie, D. J. and Randall, D. J. (1990). Does Amia calva aestivate? Fish Physiol.
Biochem. 8, 147-158.
McKenzie, D. J., Pedersen, P. B. and Jokumsen, A. (2007). Aspects of respiratory physiology and energetics in rainbow trout (Oncorhynchus mykiss) families with different size-at-age and condition factor. Aquaculture 263, 280-294.
McKenzie, D. J., Estivales, G., Svendsen, J. C., Steffensen, J. F. and Agnèse, J.-F. (2013). Local adaptation to altitude underlies divergent thermal physiology in tropical killifishes of the genus Aphyosemion. PLoS ONE 8, e54345.
Millidine, K. J., Armstrong, J. D. and Metcalfe, N. B. (2009). Juvenile salmon with high standard metabolic rates have higher energy costs but can process meals faster. Proc. Biol. Sci. 276, 2103-2108.
Owen, S. F., Houlihan, D. F., Rennie, M. J. and Van Weerd, J. H. (1998). Bioenergetics and nitrogen balance of the European eel (Anguilla anguilla) fed at high and low ration levels. Can. J. Fish. Aquat. Sci. 55, 2365–2375.
The Journal of Experimental Biology
Owen, S. F., McCarthy, I. D., Watt, P. W., Ladero, V., Sanchez, J. A., Houlihan, D. F.and Rennie, M. J. (1999). In vivo rates of protein synthesis in Atlantic salmon (Salmo salar L.) smolts determined using a stable isotope flooding dose technique. Fish Physiol. Biochem. 20, 87-94.
Pastoureaud, A. (1991). Influence of starvation at low temperatures on utilization of energy reserves, appetite recovery and growth character in sea bass, Dicentrarchus labrax. Aquaculture 99, 167-178.
Pickett, G. D. and Pawson, M. G. (1994). Sea Bass Biology, Exploitation and Conservation. London: Chapman and Hall.
Quignard, J. P. (1984). Les caractéristiques biologiques et environnementales des lagunes en tant que base biologique de l’aménagement des pêcheries. Stud. Rev. GFCM/Etud. Rev. CGPM 1, 1-38.
Rubio, V. C., Sánchez, E. and Cerdá-Reverter, J. M. (2010). Compensatory feeding in the sea bass after fasting and physical stress. Aquaculture 298, 332-337. Scharf, I., Filin, I. and Ovadia, O. (2009). A trade-off between growth and starvation
endurance in a pit-building antlion. Oecologia 160, 453-460.
Speakman, J. R., Levitsky, D. A., Allison, D. B., Bray, M. S., de Castro, J. M., Clegg, D. J., John, C., Dulloo, A. G., Gruer, L., Haw, S., et al. (2011). Set points, settling points and some alternative models: theoretical options to understand how genes and environments combine to regulate body adiposity. Dis. Model Mech. 4, 733-745. Steffensen, J. F. (1989). Some errors in respirometry of aquatic breathers: How to
avoid and correct for them. Fish Physiol. Biochem. 6, 49-59.
Stoks, R., De Block, M. and McPeek, M. A. (2006). Physiological costs of compensatory growth in a damselfly. Ecology 87, 1566-1574.
Wang, T., Hung, C. C. Y. and Randall, D. J. (2006). The comparative physiology of food deprivation: from feast to famine. Annu. Rev. Physiol. 68, 223-251.
Zeng, L. Q., Li, F. J., Li, X. M., Cao, Z. D., Fu, S. J. and Zhang, Y. G. (2012). The effects of starvation on digestive tract function and structure in juvenile southern catfish (Silurus meridionalis Chen). Comp. Biochem. Physiol. 162A, 200-211. Zeng, L.-Q., Fu, S.-J., Li, X.-M., Li, F.-J., Li, B., Cao, Z.-D. and Zhang, Y.-G. (2014).
Physiological and morphological responses to the first bout of refeeding in southern catfish (Silurus meridionalis). J. Comp. Physiol. B 184, 329-346.