HAL Id: hal-01053776
https://hal.archives-ouvertes.fr/hal-01053776
Submitted on 1 Aug 2014
HAL is a multi-disciplinary open access
archive for the deposit and dissemination of
sci-entific research documents, whether they are
pub-lished or not. The documents may come from
teaching and research institutions in France or
L’archive ouverte pluridisciplinaire HAL, est
destinée au dépôt et à la diffusion de documents
scientifiques de niveau recherche, publiés ou non,
émanant des établissements d’enseignement et de
recherche français ou étrangers, des laboratoires
Thermally-stimulated emission analysis of
bismuth-doped silica fibers
S. Jain, Jean Bernard Duchez, Yasmine Mebrouk, M.M.A.N Velazquez,
Franck Mady, Bernard Dussardier, Mourad Benabdesselam, J.K Sahu
To cite this version:
S. Jain, Jean Bernard Duchez, Yasmine Mebrouk, M.M.A.N Velazquez, Franck Mady, et al..
Thermally-stimulated emission analysis of bismuth-doped silica fibers. Optical Materials Express,
OSA pub, 2014, 4 (7), pp.1361-1366. �10.1364/OME.4.001361�. �hal-01053776�
Thermally-stimulated emission analysis of
bismuth-doped silica fibers
S. Jain,*1 J.B. Duchez,2 Y. Mebrouk,2 M.M.A.N. Velazquez,1 F. Mady,2 B. Dussardier,2 M. Benabdesselam,2 and J. K. Sahu1
1University of Southampton, Optoelectronic Research center, SO17 1BJ, Southampton, UK
2Université Nice Sophia Antipolis, CNRS, Laboratoire Physique de la Matière Condensée, UMR 7336, 06108, Nice
Cedex 2, France *[email protected]
Abstract: The study of Bismuth (Bi)-doped silica fibers has been performed by using thermally stimulated luminescence. The thermo-luminescence peaks have been spectrally resolved in order to observe the effect of co-dopants on Bi luminescence. A new peak around 625K was observed for the first time in Bi-doped Al-Ge-silicate fibers. This peak is believed to be due to Bi-active centers, and was only observed in Bi-doped samples co-doped with both Al and Ge.
©2014 Optical Society of America
OCIS codes: (060.2320) Fiber optics amplifiers and oscillators; (060.3510) Laser, fiber. References and links
1. E. M. Dianov, “Bismuth-doped optical fibers: a challenging active medium for near-IR lasers and optical amplifiers,” Light Sci. Appl. 1(5), e12 (2012).
2. Y. Fujimoto and M. Nakasura, “Infrared luminescence from bismuth-doped silica glass,” Jpn. J. Appl. Phys.
40(Part 2, No. 3B 3B), L279–L281 (2001).
3. M. A. Melkumov, I. A. Bufetov, A. V. Shubin, S. V. Firstov, V. F. Khopin, A. N. Guryanov, and E. M. Dianov, “Laser diode pumped bismuth-doped optical fiber amplifier for 1430 nm band,” Opt. Lett. 36(13), 2408–2410 (2011).
4. A. V. Shubin, I. A. Bufetov, M. A. Melkumov, S. V. Firstov, O. I. Medvedkov, V. F. Khopin, A. N. Guryanov, and E. M. Dianov, “Bismuth-doped silica-based fiber lasers operating between 1389 and 1538 nm with output power of up to 22 W,” Opt. Lett. 37(13), 2589–2591 (2012).
5. I.A. Bufetov, A.V. Shubin, S.V. Firstov,, M.A. Melkumov, V.F. Khopin, A.N. Guryanov, and E.M. Dianov, “High-power cw 1.27 µm Bi-doped fiber laser,” CLEO Europe, CJ8.2 (2011).
6. I. A. Bufetov and E. M. Dianov, “Bi-doped fiber Lasers,” Laser Phys. Lett. 6(7), 487–504 (2009).
7. M. P. Kalita, S. Yoo, and J. Sahu, “Bismuth doped fiber laser and study of unsaturable loss and pump induced absorption in laser performance,” Opt. Express 16(25), 21032–21038 (2008).
8. V. V. Dvoyrin, A. V. Kir’yanov, V. M. Mashinsky, O. I. Medvedkov, A. A. Umnikov, A. N. Guryanov, and E. M. Dianov, “O.I. Medvedkov, A.A. Umnikov, A.N. Guryanov, and E.M. Dianov, “Absorption, gain, and laser action in bismuth-doped aluminosilicate optical fibers,” IEEE J. Quantum Electron. 46(2), 182–190 (2010). 9. S. Yoo, M. P. Kalita, J. Sahu, J. Nilsson, and C. Oton, “Excited state absorption in bismuth-doped silicate fibers
for use in 1160nm fiber laser,” in 3rd EPS-QEOD Europhoton Conference Edinburgh, THoE.5, (2008). 10. K. E. Rumkin, M. A. Melkumov, I. A. Varfolomeev, A. V. Shubin, I. A. Bufetov, S. V. Firstov, V. F. Khopin, A.
A. Umnikov, A. N. Guryanov, and E. M. Dianov, “Excited state absorption in Bismuth-doped fibers,” Opt. Lett.
39(8), 2503–2506 (2014).
11. X. G. Meng, J. R. Qiu, M. Y. Peng, D. P. Chen, Q. Z. Zhao, X. W. Jiang, and C. S. Zhu, “Infrared broadband emission of bismuth-doped barium-aluminum-borate glasses,” Opt. Express 13(5), 1635–1642 (2005). 12. S. W. S. McKeever, Thermoluminescence of Solids (Cambridge University Press, 2005).
13. F. Mady, M. Benabdesselam, and W. Blanc, “Thermoluminescence characterization of traps involved in the photodarkening of ytterbium-doped silica fibers,” Opt. Lett. 35(21), 3541–3543 (2010).
14. S. R. Nagel, J. B. MacChesney, and K. L. Walker, “An overview of the modified chemical vapor deposition (MCVD) process and performance,” IEEE Trans. Microw. Theory Tech. 30(4), 305–322 (1982).
15. B. Tortech, Y. Querdane, S. Girad, J. P. Meunier, A. Boukenter, T. Robin, B. Cadier, and P. Crochet, “Radiation effects on Yb- and Er/Yb-doped optical fibers: a micro-luminescence study,” J. Non-Cryst. Solids 355(18–21), 1085–1088 (2009).
16. M. Benabdesselam, F. Mady, S. Girard, Y. Mebrouk, J. B. Duchez, M. Gaillardin, and P. Paillet, “Performance of Ge-doped optical fiber as a thermoluminescent dosimeter,” IEEE Trans. Nucl. Sci. 60(6), 4251–4256 (2013). 17. X. Wang, “Fan, G. Xiong, “Luminescence of Bi3+ ions and energy transfer from Bi3+ ions to Eu3+ ions in silica
18. A. N. Trukhin, J. Troks, and D. L. Griscom, “Thermostimulated luminescence and electron spin resonance in X-ray- and photon-irradiated oxygen-deficient silica,” J. Non-Cryst. Solids 353(16–17), 1560–1566 (2007). 19. L. Skuja, “Optically active oxygen-deficiency-related centers in amorphous silicon dioxide,” J. Non-Cryst. Solids
239(1–3), 16–48 (1998). 1. Introduction
Bismuth (Bi) has gained significant attention as a dopant for fiber lasers and amplifiers over the past decade [1]. In 2001, Fujimoto and Nakasura reported a broad optical luminescence band with peak at 1140 nm (FWHM = 200nm) in Bi-doped silica glass [2]. Since then, there have been various demonstrations of Bi-doped fiber amplifiers [1,3] and lasers [4–6]. Unlike the rare-earth ion, the emission spectra in Bi-doped glasses are highly dependent on co-dopants [6]. Al co-doped Bi-silicate fibers exhibit luminescence around 1100-1250nm wavelength region whereas Ge or P co-dopants shift the emission band to about 1450nm wavelength region. The performance of Bi-doped fibers can be significantly different depending on the co-dopants and the Bi oxidation state. Studies have also been performed to determine the origin of anomalous losses in Bi-doped fibers when exposed to high intensity pump [7,8]. It has been shown that excited state absorption becomes significant in Bi-Al silicate fibers thereby impairing the fiber efficiency [7,9,10]. An understanding of the Bi-state involved in luminescence for realization of efficient amplifier and lasers performance is not clear to-date. Various models indicating the presence of bismuth in various forms such as Bi2
dimer, Bi+, Bi2+, Bi3+ and Bi+5 have been proposed to explain the absorption and luminescence spectra of Bi-doped glasses and fibers [1,6,11]. In this paper, we have investigated the optically active traps in Bi-doped preforms and fibers samples through thermally stimulated luminescence (TSL) study. The TSL spectra along with the spectral analysis of the TSL peaks were correlated with the laser efficiency at a wavelength of 1179nm.
2. Samples and experimental method
TSL or thermoluminescence involves the study of optically active trap centers that are present within the bandgap [12]. In this, the samples are first irradiated with ionizing radiation (UV, X or γ rays), which populates these trap states. Irradiations are necessary prerequisites for pair generation in the material. The carriers from these trap states are then released upon thermal excitation. These carriers then undergo recombination through trap states by emitting photons in form of luminescence producing TSL peaks (glow curve). The different peaks observed in the glow curve are dependent on the depth of the trap states. TSL study has previously been performed on rare-earth doped optical fibers and preform samples [13].
Bi-doped silica preform and fiber samples with different co-dopants were used for the TSL measurement and spectral analysis of TSL. The preforms with 12mm and 1mm cladding and core diameter were made using a standard modified chemical vapor deposition (MCVD) with solution doping technique [14]. Table 1 lists the concentration (mol%) of Al2O3 and GeO2
co-dopants obtained from energy dispersive x-ray (EDX) spectroscopy measurement of the preform samples. The Bi2O3 concentration was below the detection limit of the measurement
system. These fabricated samples were then polished to about 2.5mm for TSL analysis. All the samples were first heated at 2K/sec without irradiation to obtain the background level arising from the blackbody radiation. Samples were then allowed to cool down to room temperature, following which, the X-rays corresponding to Cu-α and Cu-β lines at (45kV) with a dose rate of about 7 Gy/s was used to irradiate the preform samples for 30sec and fiber samples for 20min to populate the trap states. The fiber samples were irradiated for longer time to obtain detectable signal for TSL analysis. The dose was kept small in order to prevent generation of new defect centers. After irradiation, the samples were heated at the same rate of 2K/sec to empty the filled traps and record the TSL by means of a photomultiplier tube (PMT). The TSL peaks were spectrally resolved using an optical multichannel analyzer (OMA).
Table 1. Concentration (mol%) of co-dopants in Bi-doped preform samples Sample No. Al2O3 (mol %) GeO2 (mol %) 1 1.6 9 2 2 4.5 3 2.9 —-4 — 8.3
3. Results and discussions
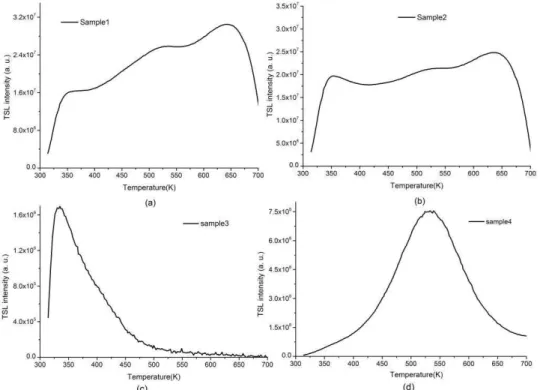
Figure 1 shows the glow curves for the preform samples. At first, two Bi-Ge-Al doped SiO2
preform samples; sample1 and sample2, were measured. As seen from Fig. 1(a), three complex peaks were observed for both preforms, and were located around 350K, 510K and 625K, hereafter, will be referred to as peak1, 2, and 3 respectively. Peak1 and 2 correspond to trap centers formed by Al and Ge assisted trap centers in silica glasses respectively [13,15,16]. As expected, the intensity of Peak1 was higher in sample2 than sample1 due to higher concentration of Al. Intensity of Peak2 was higher in sample1 indicating the presence of more Ge, which was also confirmed through EDX measurement. However, peak3 was observed for the first time in Bi-doped preform samples, and relative intensity of peak3 was higher than all other peaks for both the preforms. Furthermore, this peak was only observed in Bi samples co-doped with both Al and Ge.
Fig. 1. Glow curves for a) sample 1 and 2, b) Sample 3 and 4, and c) sample 5.
To investigate further the origin of peak3, two Bi-doped preform samples: sample3 (Bi-Al-SiO2) and sample4 (Bi-Ge-SiO2) containing only one of Al or Ge co-dopants were
considered. Figure 1(c) shows the glow curve characteristic of Al-doped silicate samples with TSL peak around 350K (peak1) due to Al-assisted trap centers and a longer tail towards higher temperature which is probably due to intrinsic defects associated with silica. Figure 1(d) shows the glow curve corresponding to sample4 with a peak (peak2) characteristic of
Ge-defects at 510K. TSL intensity on the shoulder of peak2 towards lower temperature (about 410K) is, probably due to silica intrinsic defects which is also present in sample3. The intensity around that temperature region has been observed in all the glow curves for silica glass. From the above observations, it can be suggested that the peak3 in sample1 and sample2 might be due to either Bi-assisted trap states in presence of both Al and Ge codopants or Al-Ge complex traps. Glow curve was measured for a silica glass sample containing both Al and Ge co-dopant but not Bi. It was observed that a peak appears around 660K, whereas, the peak3 in Bi-doped sample observed at 625K. Therefore, it can be suggested that peak3 is probably due to Bi-assisted trap center in presence of both Al and Ge co-dopants. Table 2 summaries the peaks observed in the different preform samples.
Table 2. TSL Peaks observed in different Bi-doped preform samples
Sample No. Peak 1 (Al-assisted traps) Peak2 (Ge-assisted traps) Peak3
(Bi-Assisted active center in Ge-Al Co-dopants)
1
2
3
4
Next, TSL study was performed on fiber samples. These samples were drawn to 125μm cladding diameter from the above two preforms in which the Fiber1 and the sample1 came from one preform, and the Fiber2 and the sample2 came from another one. The fiber samples were crushed to small pieces for TSL analysis. Figures 2(a) and 2(b) show the glow curves of fiber samples. Similar peaks were observed as in performs, which confirmed that the fiber drawing process did not introduce any new defect centers. The slight shift in temperature is probably due to the measurement conditions. Moreover, the ratio of intensity of peak3 to peak1 decreased going from Fiber1 to 2. The intensity ratio of peak3 to peak1 was also in correlation with the laser performance at 1179nm from these fibers. The laser efficiency was about 10% and 1% for fiber1 and fiber2 respectively [7].
Fig. 2. TSL curves for fiber samples a) Fiber1, and b) Fiber2.
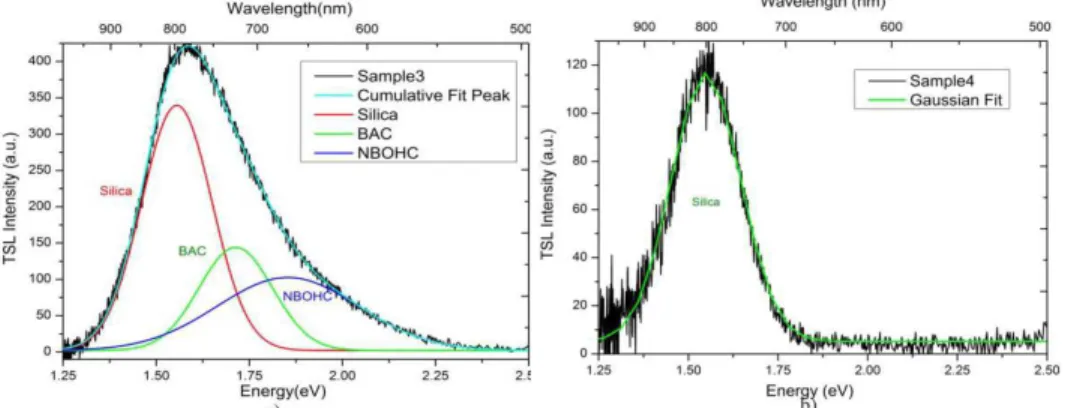
The TSL peaks from preform samples were then spectrally analyzed using OMA to obtain the spectral distribution of the emission. Figures 3(a) and 3(b) show the spectral distribution of the TSL intensity with gratings optimized around 500nm and 700nm. A main band around 1.6eV was observed in all the samples. Also, a relatively small one was observed around 2.7eV (FWHM = 0.61eV) in all the samples, whereas another feature at 3.1eV (FWHM = 0.5eV) was observed particularly in sample containing Ge-dopant. These bands are well defined in the literature. The 2.7eV emission band is characteristic of the luminescence associated with silica oxygen deficient centers with coordination number 2 (Si (II)-ODC)
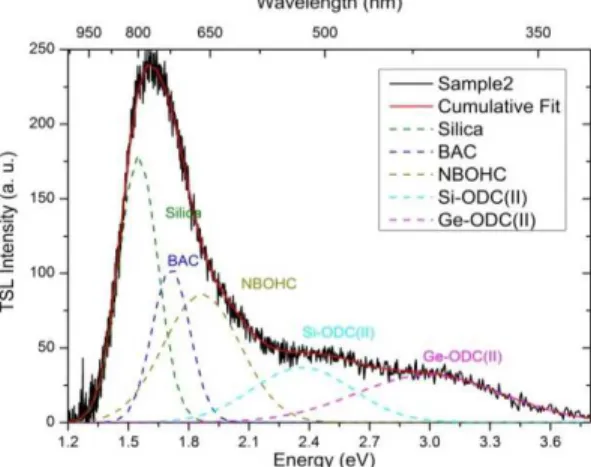
corresponding to triplet (T1) to singlet (S0) transition (T1→S0) [17]. The 3.1eV emission band has been previously observed in Ge-doped silica glasses [18], which is characteristic of Ge(II) oxygen deficient centers (Ge(II)-ODC). The band peaking at 1.6eV was decomposed using Gaussian fitting, and was found to be superposition of multiple bands. Figure 4(a) shows the fitted plot for sample3 (only Al-codopant), which consists of peaks corresponding to silica at 1.55eV (FWHM = 0.23eV) [19], Bi-active center (BAC) at 1.71eV (FWHM = 0.2eV) [2], and non-bridging oxygen hole center (NBOHC) at 1.86eV (FWHM = 0.44eV) [19] respectively, whereas, only silica has contributed to emission band at 1.6eV in sample4 as shown in Fig. 4(b). It should be noted that, in sample4, which is codoped with only Ge, there was no Bi related peak observed. A full spectrum in the range of 1.2-3.8eV was taken for sample2 with grating optimized around 700nm. Figure 5 shows the Gaussian fitted bands in sample2, which shows all the 5 peaks corresponding to silica, BAC, NBOHC, Si-ODC(II), and Ge-ODC(II). The luminescence around 1.7eV has been widely observed in Bi-Al-doped silica glasses when pumped in short wavelength bands [2]. It can be suggested that emission around 1.7eV (730nm) in Bi-doped samples is observed in the presence of Al co-dopant only.
Fig. 3. Spectroscopic measurement curves for preform samples with gratings centered at a) 500nm, and b) 700nm respectively.
Fig. 4. TSL spectral analysis of a) Sample3, and b) Sample4 with Gaussian fitting.
When the Bi-emission was compared in sample1, 2 and 3 (see Fig. 3(b)), it was observed that the TSL intensity feature at 1.7eV (730nm) decreased as the Ge concentration was increased. The Ge concentration in sample1 and 2 was also correlated with the laser efficiency observed at 1179nm [7]. Sample1 with higher Ge-codopant concentration provided better laser efficiency than sample2. It can be observed from both the TSL study and laser efficiency measurements that by codoping Ge in Bi-Al- Si preforms the emission around 1179nm can be enhanced, and in turn, the emission around 1.7eV (730nm) gets reduced. However, it is
widely understood that by doping only Ge-codopant the emission shifts towards longer wavelengths (>1300nm) [1].
Fig. 5. TSL Spectral analysis of samples2 with Gaussian Fitting.
4. Conclusions
Bi-doped silica preform and fiber samples were investigated using TSL analysis. The glow curves of Bi-Ge-Al doped SiO2 samples showed a new peak at 625K, believed to be
associated with Bi-assisted trap center in presence of both Al and Ge co-dopants. The TSL samples were spectrally resolved, and various characteristic bands were observed due to Ge-ODC(II) (for sample containing Ge), Si-Ge-ODC(II), NBOHC (for samples containing Al), and BAC (only in samples codoped with Al). The TSL intensity at 1.7eV (730nm) was compared in Bi-Al-Ge-silicate samples with different Ge concentrations, and it was observed that the emission at 1.7eV is reducing with increasing Ge concentration. This might have helped in improving the laser efficiency at 1179nm in Bi-doped fibers. It is however well known that Ge co-dopant alone pushes the Bi emission to longer wavelengths, and cannot provide efficient laser at 1100-1200nm region in Bi-doped fibers. Therefore codoping both Al and Ge can be beneficial towards realization of efficient Bi-doped fiber lasers and amplifiers below 1200nm.
Acknowledgments
This work was funded by the Royal Society UK (2010/R2) and the CNRS (program CoopIntEER, CNRS, ref. # 53022).