HAL Id: insu-00159752
https://hal-insu.archives-ouvertes.fr/insu-00159752
Submitted on 4 Jul 2007HAL is a multi-disciplinary open access
archive for the deposit and dissemination of sci-entific research documents, whether they are pub-lished or not. The documents may come from teaching and research institutions in France or abroad, or from public or private research centers.
L’archive ouverte pluridisciplinaire HAL, est destinée au dépôt et à la diffusion de documents scientifiques de niveau recherche, publiés ou non, émanant des établissements d’enseignement et de recherche français ou étrangers, des laboratoires publics ou privés.
EBSD investigation of SiC for HTR fuel particles
D. Helary, O. Dugne, Xavier Bourrat, Pierre-Henri Jouneau, F. Cellier
To cite this version:
D. Helary, O. Dugne, Xavier Bourrat, Pierre-Henri Jouneau, F. Cellier. EBSD investigation of SiC for HTR fuel particles. Journal of Nuclear Materials, Elsevier, 2006, 350 (3), pp.332-335. �10.1016/j.jnucmat.2006.01.010�. �insu-00159752�
EBSD investigation of SiC for HTR fuel particles
D. Helarya, b,, O. Dugneb, X. Bourrata,e, P.H. Jouneauc and F. CellierdaLaboratoire des Composites Thermostructuraux (LCTS), UMR CNRS 5801, 3 allée de La
Boétie, 33600 Pessac, France
bCommissariat à l’Énergie Atomique – DEN/VRH/DTEC/STCF/LMAC, BP 111, 26702
Pierrelatte, France
cGEMPPM, UMR CNRS 5510, Bât. B Pascal, INSA de Lyon, 69621 Villeurbanne cedex,
France
dFramatome ANP, an AREVA and SIEMENS Company, Plants Sector, 10 rue Juliette
Récamier, 69456 Lyon Cedex 06, France
eISTO – CNRS-Université d’Orléans Rue de Saint-Amand Bâtiment Géosciences BP 6759
45067 Orléans Cedex 2 – Present Address
Abstract
Electron back-scattering diffraction (EBSD) can be successfully performed on SiC coatings for HTR fuel particles. EBSD grain maps obtained from thick and thin unirradiated samples are presented, along with pole figures showing textures and a chart showing the distribution of grain aspect ratios. This information is of great interest, and contributes to improving the process parameters and ensuring the reproducibility of coatings.
The last few years have seen renewed interest in the nuclear community for high-temperature reactors (HTR). This is a promising concept especially from the standpoints of safety, co-generation and competitiveness [1].
An extensive HTR Fuel R&D Program supported by AREVA through its program called ANTARES (AREVA New Technology for Advanced Reactor Energy Supply) is in progress at Commissariat à 1’Énergie Atomique (CEA). The basis of this fuel development and qualification programme is the design, fabrication and qualification of a fuel which will fulfil the HTR requirements [2].
The basic fuel unit of HTR is a PyC/SiC multilayer coating about 1 mm in diameter,
composed of a porous buffer layer and a SiC coating between two very dense layers of PyC (design described in [3]). The fuel particles are key elements of HTR because they must ensure maximum confinement to retain fission products (gases, cesium, silver, etc.) during irradiation and under accidental conditions. This work focuses on the SiC layer, which is deposited from CH3SiCl3 in a fluidized bed reactor under H2. The SiC grain size is an
important parameter because of its significant effect on the migration of metallic fission products. Grains must be very fine to increase the density of grain boundaries and minimize the release into the coolant circuit. After neutron irradiation apparently 90% of the Ag would be released from a large columnar SiC grain microstructure, whereas only 30% would be released in a smaller SiC grain microstructure [4].
In the present study, electron back-scattering diffraction (EBSD) was applied to characterize the SiC microstructure. EBSD gives more accurate measurements of the grain morphology than conventional methods. Chemical etching coupled with observation by scanning electron microscopy (SEM) is also routinely used (Fig. 1), but this method does not always provide satisfactory results and is unable to detect twins. Compared to transmission electron
microscopy (TEM), EBSD has the advantage of gathering statistical data in a relatively short time. EBSD can also determine the preferred crystal orientations (texture) present in the SiC layer.
The EBSD technique is based on the diffraction pattern that forms on a phosphor screen in the SEM when electrons of the incident beam spread beneath the sample surface in all directions, due to elastic interactions (backscattered electrons). A pattern of Kikuchi bands, characteristic of the crystal structure and orientation is collected for each point scanned by the electron beam.
The centerlines of the Kikuchi bands correspond to the projection of the diffracting planes. Intersections of these bands correspond to crystal zone axis. Data are acquired via a CCD camera and an automated routine is used to index the Kikuchi patterns. The crystal orientation is calculated from the Kikuchi band positions using the Hough transform. A complete
description of the EBSD technique may be found in a published comprehensive review [6]. The preparation of SiC samples for EBSD investigation is a crucial factor in obtaining Kikuchi patterns of the highest quality. The fuel particle is embedded in epoxy resin and a diametral cross section is mechanically polished. In order to minimize the surface plastic damage (backscattered electrons are generated from a depth of about 100 nm beneath the sample surface), the cross section is finally polished on colloidal silica. The sample is then removed from the resin with a scalpel and mounted in the SEM chamber so that the half sphere polished surface is perfectly parallel to the sample holder plane (i.e., normal to the electron beam). This operation is relatively difficult to perform accurately.
Two samples designated A and B were used in this work. On the first (A), the SiC layer was deposited under standard conditions (a deposition temperature around 1550 °C and a coating rate of approximately 0.3 μm/min); the second (B) was prepared at a higher coating rate, producing a thicker SiC layer with a different microstructure. The Kikuchi patterns obtained on these materials were indexed using only the 3C–SiC phase.
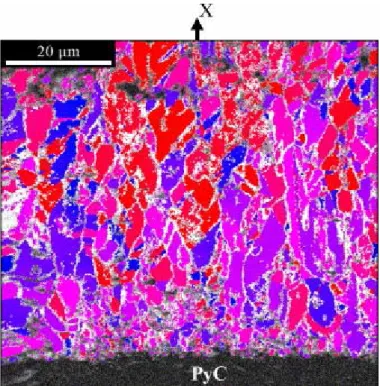
EBSD boundary maps of each sample are shown in Fig. 2. Superposing random colors on the band contrast image (diffraction quality index) clearly reveals the individual grains.
Unindexed points are shown in black. Their presence is sometimes detected at grain boundaries where two patterns from neighboring grains overlap. Another reason for an unindexed area is a low diffraction pattern quality due, for example, to inclusions, porosity or plastic deformation.
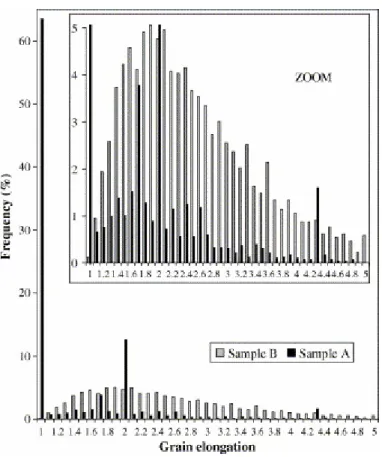
In both cases, small equiaxial grains are observed at the beginning of the SiC deposit. During growth, grains become more elongated. When plotting the grain fraction versus the ratio of the maximum direction in x and y (grains are assumed to be elliptical), great differences occur between the two histograms (Fig. 3). In sample A, most grains are either equiaxial or
elongated with a ratio of two, whereas sample B shows a homogeneous grain elongation distribution.
Many SiC grains are twinned. Σ3 boundaries are frequently detected, especially in sample B (Fig. 2). This twin structure results when the stacking sequence is abruptly reversed, e.g., {ABCBA}, by a stacking fault. This corresponds to a 60° rotation around a 1 1 1 common axis and is the most common twin structure in fcc crystals.
Twin boundaries are generally excluded during grain measurements since the stacking fault formation in 3C–SiC is energetically favorable [7]. Twins do not appear to have any
significant effect on the coating properties, and on the diffusion properties in particular. The crystallographic orientations of the grains were analyzed using EBSD orientation mapping and pole figures. Sample A exhibits a weak 1 1 1 texture (Fig. 4(a)) which is reinforced during growth (Fig. 5). One 1 1 1 pole is exactly parallel to the growth direction
X0, normal to the particle. This orientation is commonly observed in CVD SiC deposits [8].
During the initial deposition stage, grains grow in random directions from the energetically most favorable {1 1 1} faces. This implies that the grains may ultimately cease growing. The only grains that can survive are the ones that grow parallel with the others in the deposition direction. In sample B, grains are randomly oriented (Fig. 4(b)); this is consistent with a higher proportion of Σ3 twins.
This work is the first EBSD investigation reported on the SiC layer of HTR fuel particles. The results obtained indicate that EBSD is a powerful tool for completely describing the
microstructure (grain morphology and orientation, special boundaries like Σ3, quantitative data on grains elongation, etc.) directly on the whole layer. It thus provides essential information concerning the SiC growth mechanism. Hence, when an anomaly occurs in the deposition process, it can easily be detected.
References
[1] M. Lecomte, Nucl. Eng. Des. 209 (2001), p. 233.
[2] P. Guillermier, M. Phelip, AREVA and CEA R&D Programme on HTR fuel technology, in: Proceedings of ICAPP ’05, Seoul, Korea, May 15–19, 2005.
[3] H. Nickel, H. Nabielek, G. Pott and A.W. Mehner, Nucl. Eng. Des. 217 (2002), p. 141. [4] D.A. Petti, J. Buongiorno, J.T. Maki, R.R. Hobbins and G.K. Miller, Nucl. Eng. Des. 222 (2003), p. 281
[5] D. Helary, X. Bourrat, O. Dugne, G. Maveyraud, M. Perez, P. Guillermier,
Microstructures of silicon carbide and pyrocarbons coatings for fuel particles for high temperature reactors, in: Proceedings of the 2nd international topical meeting on high temperature reactor technology, Beijing, September 2004.
[6] F.J. Humphreys, J. Mater. Sci. 36 (2001), p. 3833
[7] H. Iwata, U. Lindefelt, S. Oberg and P.R. Briddon, Mater. Sci. Forum 389–393 (2002), p. 439
Figures
Fig. 1. SEM micrograph in cross section of a SiC layer of HTR fuel particle after chemical etching [5].
Fig. 2. EBSD grain maps plotted by superposition of band contrast image and random colors. Σ3 boundaries are colored as black lines. (a) Sample A. (b) Sample B. Growth occurs from bottom to top.
Fig. 3. Distributions of grain elongation in samples A and B. Grains are considered elliptic.
Fig. 5. Orientation map of sample A showing the deviation between the normal direction X0
![Fig. 1. SEM micrograph in cross section of a SiC layer of HTR fuel particle after chemical etching [5]](https://thumb-eu.123doks.com/thumbv2/123doknet/13239309.395267/5.892.256.637.152.453/fig-micrograph-cross-section-layer-particle-chemical-etching.webp)