Publisher’s version / Version de l'éditeur:
Vous avez des questions? Nous pouvons vous aider. Pour communiquer directement avec un auteur, consultez la première page de la revue dans laquelle son article a été publié afin de trouver ses coordonnées. Si vous n’arrivez pas à les repérer, communiquez avec nous à PublicationsArchive-ArchivesPublications@nrc-cnrc.gc.ca. Questions? Contact the NRC Publications Archive team at
PublicationsArchive-ArchivesPublications@nrc-cnrc.gc.ca. If you wish to email the authors directly, please see the first page of the publication for their contact information.
https://publications-cnrc.canada.ca/fra/droits
L’accès à ce site Web et l’utilisation de son contenu sont assujettis aux conditions présentées dans le site LISEZ CES CONDITIONS ATTENTIVEMENT AVANT D’UTILISER CE SITE WEB.
UVS Canada Conference 2006 [Proceedings], 2006
READ THESE TERMS AND CONDITIONS CAREFULLY BEFORE USING THIS WEBSITE. https://nrc-publications.canada.ca/eng/copyright
NRC Publications Archive Record / Notice des Archives des publications du CNRC :
https://nrc-publications.canada.ca/eng/view/object/?id=e59c9d0c-c098-43a2-860f-4fae1b508fd3
https://publications-cnrc.canada.ca/fra/voir/objet/?id=e59c9d0c-c098-43a2-860f-4fae1b508fd3
Archives des publications du CNRC
This publication could be one of several versions: author’s original, accepted manuscript or the publisher’s version. / La version de cette publication peut être l’une des suivantes : la version prépublication de l’auteur, la version acceptée du manuscrit ou la version de l’éditeur.
Access and use of this website and the material on it are subject to the Terms and Conditions set forth at
Development and deployment of ocean gliders on the Newfoundland
Shelf
Bachmayer, R.; de Young, B.; Williams, C. D.; Bishop, C.; Knapp, C.;
Foley, J.
Memorial University of Newfoundland, in St. John's, Newfoundland, have been exploring the potential for these autonomous underwater vehicles to gather oceanographic information with application to the Newfoundland Shelf. During the course of the summer 2006, we conducted several brief deployments, and, two deployments that lasted 21 days and 7 days respectively around Newfoundland.
A glider operation can be separated into several different phases. It begins with a pre-deployment phase, involving precise ballasting, battery checks, communication checks and mission simulation. The second phase, the actual deployment, includes the launch, communication test, brief test dive and finally mission execution. The third phase consists of mission control and data check. Phase four, the most desirable, is the recovery. The final phase of the operation is post-mission check out, full data download and swapping consumables, such as sacrificial anodes and batteries if necessary.
Index Terms—Autonomous vehicles, autonomous underwater
vehicles, underwater gliders, ocean sampling, oxygen sensor.
I. INTRODUCTION
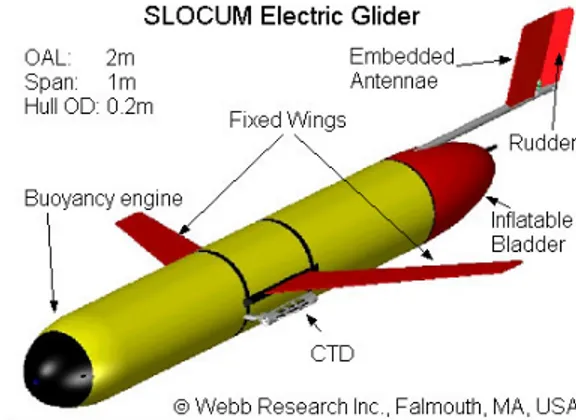
VER the last 15 years underwater gliders have been developed as a new autonomous sampling platform. Underwater gliders are autonomous underwater vehicles (AUVs) that are deployed for weeks or months at a time to collect information about the ocean. Through the Canadian Centre for Ocean Gliders (CCOG), Canada has recently acquired four SLOCUM underwater gliders (see Figure 1). In this paper we give an overview of the technology, glider operational requirements and its current applications. During the remainder of this paper we are referring to the 200 m electric SLOCUM gliders if not noted otherwise.
II. UNDERWATER GLIDERS
Autonomous underwater gliders, represent a rapidly maturing technology with a large cost-saving potential over
1 This work was supported in part by the provincial government of
Newfoundland and Labrador, the National Research Council Canada, the Natural Sciences and Engineering Research Council (NSERC) and the Canadian Centre for Ocean Gliders.
R. Bachmayer, C.D. Williams and C. Knapp are with the National Research Council Canada - Institute for Ocean Technology, St. John's NL, Canada (e-mail: Ralf.Bachmayer@ nrc-cnrc.gc.ca).
B. de Young, C. Bishop and J. Foley are with the Department of Physics and Physical Oceanography, Memorial University, St. John's NL, Canada.
Figure 1: Rendering of a 200 m electric SLOCUM glider.
A. Principle
Underwater gliders move efficiently through the water-column by exploiting their ability to change their weight in water. As a result there is an upward or downward force acting on the glider. Alternating weight changes combined with a change in attitude result in a concatenation of up and down glide cycles. The upward and downward gliding trajectories shown in Figure 2 are a result of a balance of the upward or downward driving force, the hydrodynamic forces and moments that are generated by the shape and motion of the glider, and, the equilibrium pitch angle of the glider. The mechanism to achieve this change in weight is referred to as a buoyancy engine (see Figure 1). Currently operational gliders, such as Seaglider [3], Spray [4] and the electric SLOCUM glider use an electromechanical displacement actuator, pump or piston, to change their weight. A prototype glider using an thermally-driven buoyancy engine is currently being tested [6]. The efficiency of the trajectory of the glider depends on the mechanical and electrical efficiency and duty cycle of the buoyancy engine (i.e. the longer and deeper the glide the smaller is the duty cycle and hence the lower is the power consumption) and the hydrodynamic efficiency of the shape of the glider.
B. Control and communication
As mentioned above, the buoyancy is the main driving element of the gliders, the power is provide by one fixed and one axially movable battery pack. While the buoyancy engine will cause the glider to pitch down or up, the actuated battery pack is used for fine adjustment of the pitch angle of the glider using the flight computer and the attitude sensor. The glider also has a depth sensor, a fluxgate compass and an acoustic altimeter on board. The standard science sensor is a conductivity, temperature and depth (CTD) sensor.
For communication and navigation purposes the glider has a total of three antennae integrated into its tailfin (see Figure 1):
1. GPS/IRIDIUM 2. ARGOS transmitter 3. Freewave radio.
During a mission an ultra-low-power single-board computer controls the glider’s attitude and executes the deduced-reckoning algorithms. At the surface the glider acquires its location using a GPS receiver and compares that position to the desired position from the on-board mission plan. The position error is used to compute an estimate of the effect of the ocean currents encountered between two surfacings. This estimate is then used to correct the dive parameters (i.e. heading) for the next dive cycle.
At the surface the gliders areable to communicate globally using an IRIDIUM satellite connection (data rate ~ 2400 Baud), or, for local line-of-sight communication, some gliders (i.e. SLOCUM) are equipped with a high bandwidth RF modem (data rate ~ 115.2 kBaud). An ARGOS transmitter is provided for backup. The antennae are integrated into the gliders such that while the glider is at the surface, the antennae are at a maximum height above the water surface to aid communications. In the case of the SLOCUM glider, the antennae for communication and GPS are embedded within the rudder assembly (Figure 1), and, by means of an inflatable bladder in the tail cone, can be brought out of the water. Once
communication to a control centre has been successfully established, the current glider mission can be updated and/or data recorded during previous missions can be downloaded from the vehicle.
Besides the vehicles’ position, attitude and other internal states, the gliders collect data from their scientific sensors. Typically the gliders carry a conductivity, temperature and depth sensor (CTD), but more recently additional instrumentation such as Photosynthetically Active Radiation (PAR) sensors, fluorometers and dissolved-oxygen sensors have successfully been operated. The drawback due to additional sensors is an increase in power consumption and therefore a reduction in mission length. Frequent communications and shallow dives (which imply frequent changes in buoyancy) also contribute to reduced mission length. Currently the operational endurance for a 200 m electric SLOCUM glider with a standard CTD sensor is on the order of four weeks. The horizontal speed relative to the surrounding water is typically around 35 cm/s. For more detailed information on the specific performance of the gliders the reader is referred to [1], [3], [4], [6], [7] and [8].
III. GLIDER OPERATIONS
In this section we describe the preparation of the gliders and the necessary infrastructure, and, give a brief description of how the data are retrieved and made available to the end-users.
A. Ballasting and trimming
The glider mass in air is approximately 50 kg (dry) and the total volume-change capacity available from the buoyancy engine is between 0.5 and 1% of the total displaced volume (approximately 50 litre). The density difference between freshwater and saltwater is 2 to 3%. Thus the glider is unable to compensate for the full range of densities that occur in fresh and saltwater; this makes an exact ballasting procedure necessary. The trim of the vehicle has a direct influence on the attitude and therefore on the flight characteristics. A non-zero
Figure 2: Glider flight data showing the glider depth profiles (blue) in metres over detected seafloor (dashed red) versus time in hours.
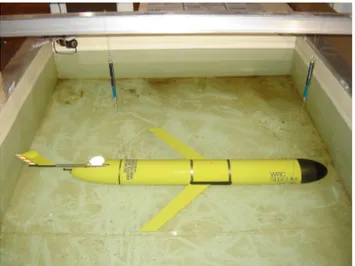
Figure 3: Photograph of a SLOCUM glider suspended from two spring-scales being ballasted for zero pitch and zero roll angle in our freshwater ballast tank.
the mass of the vehicle as when a new sensor is installed. Fine adjustment of the ballast and trim conditions is possible using lead shot in four plastic bottles inside the hull, with two bottles forward above the longitudinal centreline (one on the port side, the other on starboard side), and two bottles aft in the centreline XZ-plane (one above the longitudinal centreline, the other below).
The purpose of the ballasting procedure is to adjust the mass of the vehicle so that it will be neutrally-buoyant in water of a specified density; the buoyancy engine will then be able to make the vehicle rise and sink in water of this density.
The buoyancy engine, relative to its piston’s mid-stroke position, can ingest or expel only 250 cm^3 of surrounding fluid. This means that the buoyancy engine can change the mass of the vehicle only by about +/-250 gm, or +/-0.5 percent of its total mass. With such a limited range of mass change, it is crucial that the vehicle be pre-ballasted to the density of the seawater in which the vehicle will operate during its next mission. Thus to be useful in Newfoundland waters, where the seawater density is about 1026 kg/m^3, we should develop a procedure for ballasting and trimming the vehicle in a tank of seawater of density 1026 kg/m^3. Instead, for convenience, we chose to develop a procedure for ballasting and trimming the vehicle in a tank of fresh water of density 1000 kg/m^3. The following procedure will provide a vehicle that is neutrally-buoyant in seawater of density 1026 kg/m^3. The end result will be a vehicle that can control its rising and sinking in seawater for which the density ranges from approximately 1021 to 1031 kg/m^3.
Since the glider displaces close to 50 litre (0.05 m^3) of surrounding fluid, if the surrounding fluid is seawater of density 1026 kg/m^3, then the glider will be neutrally buoyant in that seawater only if it has a mass of 1026 times 0.05 or 51.3 kg. Thus if the glider as outfitted has a mass of 50 kg, an additional ballast of mass 1.3 kg must be added otherwise the glider will not be neutrally-buoyant in seawater of density 1026 kg/m^3.
The ballasting and trimming procedure follows. The objective is to have (i) the vehicle be neutrally-buoyant in the target seawater, (ii) the CG and centre of buoyancy (CB) at the same longitudinal location within the payload module, with the CB above the CG, thus attaining (iii) a glider that is
statically-correct amount of ballast to be neutrally-buoyant in seawater of density 1026 kg/m^3, the sum of the two spring-scale readings should be 1.3 kg. If not, then ballast should be added or removed until that sum is obtained.
Step 6. Check the fore-and-aft distribution of the ballast in order to achieve a level-pitch-trim condition. Measure the distances from the CG to the pair of forward plastic ballast bottles and from the CG to the pair of aft ballast bottles; these distances will be of the order of 0.62 m and 0.53 m, respectively. Record the two spring-scale readings. Take the glider apart and remove the four ballast bottles and record the mass of each bottle with its existing amount of lead shot. If the spring-scale readings show that the vehicle is nose-heavy, transfer some lead shot from the forward bottles to the aft bottles. Note that the mass of the two forward ballast bottles should be the same (as close as is practical) so as not to produce a net rolling moment about the longitudinal centreline of the vehicle.
Step 7. Check the port-starboard distribution of the ballast in order to achieve a level-roll-trim condition. The main battery pack is equipped with an adjustment plate so that the battery can be rotated in roll (about the longitudinal axis of the hull) over a range of a few degrees. The battery can therefore be used to offset the roll moment due to the mass of, for example, the CTD sensor that is mounted on the port side of the payload module thus allowing the glider to fly upright in straight-ahead flight. Suspend the glider in fresh water from two spring-scales (or load cells) from points equidistant on either side of the hull, for example, at the wing mount. The glider will be in a level-roll-trim condition when the two spring-scale readings are equal.
Step 8. Check the top-bottom distribution of mass in order to achieve the required distance (vertical separation) between the CG and CB. This separation controls both the "pitch stiffness" and "roll stiffness" (due to the hydrostatic restoring moments) of the vehicle, thus controlling how quickly (or slowly) the vehicle responds (a) by changing its pitch angle when the the buoyancy engine is actuated, and, (b) by changing its roll angle when the rudder is actuated while performing a turn or counter-acting a lateral ocean current. A vertical separation distance of 6 mm appears to provide reasonable vehicle response; this distance can be adjusted by
moving lead shot from the aft upper ballast bottle to the aft lower ballast bottle, and vice versa.
B. Communication
Control for a long endurance AUV relies on a communication system that provides a robust and reliable means for the transfer of vehicle performance and science data. In the case of an underwater glider this is further complicated due to the global deployment scenarios. As mentioned in an earlier section, the gliders are equipped with three independent communication systems. The high bandwidth RF-link that provides an onsite telemetry and data link is used during launch, recovery and on an opportunity basis. During regular missions that require over-the-horizon operations, or operations in a different part of the world, the IRIDIUM telephone service provides a reliable link, with small variations in the quality of service. Due to the smaller bandwidth the IRIDIUM link is mostly used for vehicle status, mission updates and a small subset of the science and engineering data. As a backup, not only to the communication system but also to the navigation system the ARGOS service provides a global reach one-way link that allows the user to locate the glider in case of failure of the GPS unit or communication equipment.
C. Data distribution
During glider deployments, new data are received on each surfacing, typically every few hours. A web page was created specifically for presenting the data collected from the glider missions (www.physics.mun.ca/~glider/). A suite of Matlab scripts was written to aid in the analysis and distribution of the data; these scripts were designed to automate the process of examining data, however, a more in-depth analysis of the data was left to the researchers.
A data archive was created and linked to the web page. New data are continuously updated and processed for placement into the archive. When a new glider mission takes place and new data are received, a sequence of analyses takes place. First, the longitude and latitude positions are extracted, and a map is created. The map is placed on the web page and allows for the approximate location of the vehicle to be known at any time. Second, a series of plots are created from the CTD data collected (temperature, salinity, and pressure as function of depth) and also from the glider’s internal sensors (heading, pitch and roll.) Third, a new section is created inside the data archive with the glider mission specifics (date launched, present location etc.) and the generated figures are automatically updated on the web page.
The benefits of using automated scripts to analyze and store the data online are evident as it allows researchers not directly involved with deployments access to near-real-time data from anywhere via an internet connection.
IV. GLIDER SCIENCE
Oceanographic data have been analysed not only from the short test deployments in Conception Bay, of which there have been several, but also for the longer deployments from Trinity
Bay and Conception Bay, out onto the Northeast Newfoundland Shelf (see Figure 4).
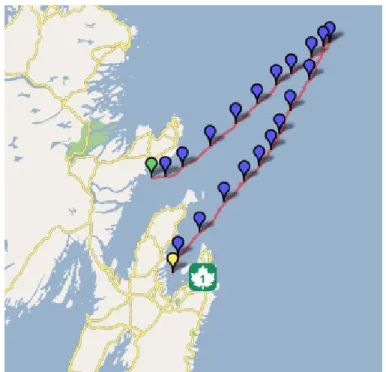
The track out of Trinity Bay and across the shelf cuts across the inner branch of the Labrador Current [11]. In choosing this route, we did have some concerns that the glider might have some difficulty in flying against the strong currents which in the surface waters can easily exceed 30 cm/s. While the track does not show any obvious signs of influence from this coastal current the distance between the daily markers (the blue balloons) does show that there were stronger currents offshore than in the nearshore region and that there were day-to-day differences in the current experienced by the glider, strongly influencing its speed over the bottom.
Figure 4: The track is shown with the orange line running from Trinity Bay (the northern bay) out across the shelf and back into Conception Bay (to the south). Deployment begins to the north (green balloon) with recovery to the south (yellow balloon). Each of the blue balloons shows the start of a new day.
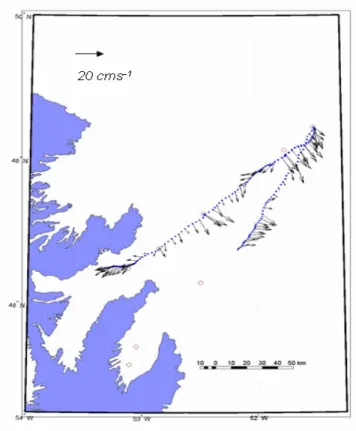
The mean currents experienced by the glider, as determined from the difference between the expected and actual surface positions vary from 10 to 30 cm/s with the mean current to the southeast, in agreement with other measurements of the inner branch of the Labrador Current [11]. Confidence in this mean current estimate is uncertain since it relies upon the hydrodynamic model of the glider’s expected motion. The mean current is the difference between the expected and the observed glider position over the time of transit. We do have repeat tracks where the glider moved both with and against the current and we will be carrying out further a analysis to see if we can develop an estimate of the error in the velocity. The glider also provides a surface drift estimate from the period when it is at the surface in communication mode. For these deployments, the surface communication time varied between 5 and 20 minutes depending upon the amount of data to be uploaded and the data-transfer rate available. In general we
Figure 5: The mean ocean currents, averaged from the surface down to the bottom of the trajectory for the deployment of Figure 4. These are the currents averaged over the top 170 m of the ocean.
The glider deployment shown in Figure 4 had only a CTD with no additional sensors. Water properties in this region show substantial structure and there are many interesting features to explore in the data. The temperature data show that the glider was able to resolve both the vertical and horizontal water properties very well (Figure 6). Surface temperatures reach 15 0C while bottom temperatures are typically sub-zero. The mixed layer is quite apparent in this figure, varying in depth from roughly 10 to 35 m.An enormous amount of detail is clear in this raw, unfiltered plot.
Some of the features of the vehicle performance are also apparent in the data track plots (e.g. Figure 6). The
overlapping data near 90 km from the start is the result of our setting the waypoint proximity distance to 10 m, meaning that the glider repeatedly attempted to get within 10 m of the waypoint, something that it was unable to achieve for many hours until we made the waypoint proximity distance appropriately larger. One can also see that for much of the deployment we set the upper depth as 10 m. As the glider moved out across the shelf, towards 160 km from the starting point, it had increasing difficulty in making it towards the next waypoint and so we set the upper depth to 30 m so that the
Figure 6: Temperature data for the track shown in Figure 5. The total track distance shown is roughly 330 km. Only data from the downwards profile are plotted.
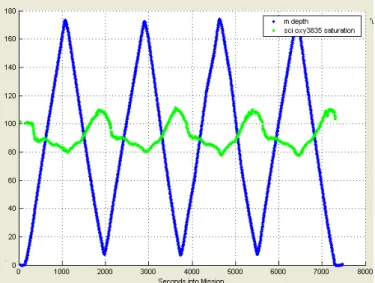
The short deployment in Conception Bay, just seven days, was to test a new oxygen sensor the Aanderaa Optode [10]. We integrated this sensor into the glider science controller so that we could control and collect data from the sensor which was set just forward of the tail while being exposed through a small 5 by 5 cm hole that we cut in the body of the glider. The sensor performed well (Figure 7). The response time of this oxygen sensor is much shorter than those of other oxygen sensors, such as gas tension and membrane systems, but the response time of roughly 20 seconds does pose challenges for interpreting the profiles form the glider (Figure 7), a problem on which we are now working. The oxygen saturation varied from 80%, at a depth of 200 m, to almost 110% near the surface, typical values for coastal waters.
V. CONCLUSIONS
Autonomous vehicles have enormous potential for extending our sampling reach into the ocean. Gliders have particular strengths, e.g. their ability to sample in the vertical direction and their endurance, but also weaknesses, for example their limited electrical power capacity for additional sensors. We are still exploring the potential for these vehicles and at the same time proving their value for ocean sampling. We are presently exploring several new sensor options, including optical and acoustic sensors, which we will be testing over the next year to further extend the operational capability of these platforms.
ACKNOWLEDGMENTS
We thank the many technical support staff at our two institutions who supported this project. In particular, we thank our two boat captains, Roger Tucker and Jan Negrijen.
Figure 7: Oxygen data (expressed as percent saturation) for a two-hour segment of a transect in Conception Bay. The oxygen data (green) show that the oxygen saturation rises above 100% when the glider reaches the surface (blue line showing depth). The vertical axis shows the depth (m) and the oxygen saturation (%).
REFERENCES
[1] R. Bachmayer, N. E. Leonard, P. Bhatta, E. Fiorelli, and J. G. Graver. “Dynamics, Control and Coordination of Underwater Gliders” in
Advances in Unmanned Marine Vehicles. Editors: G. Roberts and R.
UK, 2005. ISBN 0 86341 450 8.
[2] T. Curtin, J. G. Bellingham, J. Catipovic, and D. Webb. “Autonomous ocean sampling networks.” Oceanography, 6(3): 86-94, 1993. [3] C. C. Eriksen, T. J. Osse, R. D. Light, T.Wen, T. W. Lehman, P. L.
Sabin, J. W. Ballard, and A. M. Chiodi. “Seaglider: A long-range autonomous underwater vehicle for oceanographic research.” IEEE
Journal of Oceanic Engineering, 26(4):424-436, October 2001. [4] J. Sherman, R. E. Davis, W. B. Owens, and J. Valdes. “The autonomous
underwater glider "Spray".” IEEE Journal of Oceanic Engineering, 26(4): 437-446, October 2001.
[5] Henry Stommel. “The Slocum Mission.” Oceanography, 2:22{25, 1989. [6] D. C. Webb, P. J. Simonetti, and C. P. Jones. “SLOCUM: An underwater glider propelled by environmental energy.” IEEE Journal of
Oceanic Engineering, 26(4): 447-452, October 2001.
[7] J. G. Graver. “Underwater Gliders: Dynamics, Control and Design.”
PhD thesis, Princeton University, 2005.
[8] J. G. Graver, R. Bachmayer, N. E. Leonard, and D. M. Fratantoni. “Underwater glider model parameter identification.” In 13th
International Symposium on Unmanned Untethered Submersible Technology, Durham, NH, USA, August 2003.
[9] E. Fiorelli, N. E. Leonard, P. Bhatta, D. Paley, R. Bachmayer, and D. Fratantoni. “Multi-AUV control and adaptive sampling in Monterey Bay.” In Proc. of 2004 IEEE AUV Workshop, June 2004.
[10] Gilbert, D., H. Freeland and A. Tran. “Oxygen measurements on Argo floats”. Geophysical Research Abstracts, 8, 2006.
[11] E. Colbourne, B. deYoung, S. Narayanan and J. Helbig. 1997. “Hydrography and circulation on the Newfoundland Shelf”. Canadian
Journal of Fisheries and Aquatic Sciences, 54: 149-157.