APARTMENT PERFORMANCE AND EMPLOYMENT DISTRIBUTION A STUDY OF TWO CITIES
by
Daniel A. Pedrotti, Jr.
Bachelor of Business Administration
Texas Agricultural and Mechanical University 1984
SUBMITTED TO THE DEPARTMENT OF ARCHITECTURE AND THE CENTER FOR REAL ESTATE DEVELOPMENT
IN PARTIAL FULFILLMENT OF THE REQUIREMENTS OF THE DEGREE MASTER OF SCIENCE IN REAL ESTATE DEVELOPMENT AT THE
MASSACHUSETTS INSTITUTE OF TECHNOLOGY SEPTEMBER, 1988
(D
Daniel A. Pedrotti, Jr. 1988The Author hereby grants to M.I.T.
permission to reproduce and to distribute publicly copies of this thesis document in whoe or in part.
Signature of the Author
Daniel A. Pedrotti, Jr. Department of Urban Studies and Planning 29 July 1988
Certified by
M Louargand Lecturer, Department of Urban Studies and lanning Thesis Advisor
Accepted by
Michael Wheeler Chairman Interdepartmental Degree Program in Real Estate Development
SEP 2019b8
APARTMENT PERFORMANCE AND EMPLOYMENT DISTRIBUTION A STUDY OF TWO CITIES
Daniel A. Pedrotti, Jr.
TABLE OF CONTENTS ABSTRACT... CHAPTER ONE INTRODUCTION... CHAPTER TWO DIVERSIFICATION INDEX... CHAPTER THREE ECONOMIC MAKEUP ... TOTAL EMPLOYMENT GROWTH - US, EMPLOYMENT TRENDS BY SECTOR...
UNITED STATES... EMPLOYMENT GROWTH BY DENVER... EMPLOYMENT GROWTH BY PHOENIX... EMPLOYMENT GROWTH BY SUMMARY OF EMPLOYMENT TRENDS..
... 1
.. . . . . ... 2
... 6
DENVER AND PHOENIX...11
SECTOR.. SECTOR.. SECTOR.. CHAPTER FOUR CHARACTERISTICS OF RENTAL INCOME... ... THE DATA... CORRELATIONS... . CORRELATIONS BETWEEN RENTS AND DIVERSIFICATION INDEX CORRELATIONS BETWEEN RENTS AND EMPLOYMENT LEVELS.... DENVER a a a a a ... ... a ... PHOENIX ... . . . .. DENVER SUMMARY ... PHOENIX SUMMARY... .13 .14 .16 .23 .27 .32 .32 .40 .43 .43 .45 .48 .50 .52 .56 .60 .60 CHAPTER FIVE
CONCLUSIONS
...62
STRATEGIES... REFERENCES... ... . . . ... 64 DENVER...7a aw aa aa a a a a a PHOEN I X . . . ... aaaaa aaaa a10.
.
.
.
.
.
.
.
.
.
.
.
.
.
.
.
.
.
.
.
.
.
.
.
.
.
.
.
.
.
.
.
.
.
.
.
.
.
.
.
.
.
.
.
.
.
.
.
.
.
.
.
.
.
.
.
TABLES AND GRAPHS
CHAPTER 2
FIGURE 1: DENVER DIVERSIFICATION INDEX... FIGURE 2: PHOENIX DIVERSIFICATION INDEX... CHAPTER 3
EXHIBIT 1: TOTAL EMPLOYMENT LEVELS...
TABLE 1: FIGURE 3: FIGURE 4: TABLE 2: FIGURE 5: FIGURE 6: TABLE 3: FIGURE 7: FIGURE 8:
UNITED STATES EMPLOYMENT DISTRIBUTION.. UNITED STATES GROWTH SECTORS...
UNITED STATES LOW GROWTH SECTORS. DENVER EMPLOYMENT DISTRIBUTION....
DENVER GROWTH SECTORS... DENVER LOW GROWTH SECTORS... PHOENIX EMPLOYMENT DISTRIBUTION... PHOENIX GROWTH SECTORS... PHOENIX LOW GROWTH SECTORS... CHAPTER 4
TABLE 4: DENVER RENT DATA SUMMARY... TABLE 5: PHOENIX RENT DATA SUMMARY... TABLE 6: UNITED STATES RENT DATA SUMMARY.. FIGURE 9: AVERAGE RENT COLLECTED PER UNIT. FIGURE 10: RENT COLLECTED PER UNIT...
.. .. ... 8 ... 9 .... .... 12 ... 15 17 .... .... .... 18 . . 24 ... 25 .. 26 33 34 ... ... ... .. 35 ... 44 ... ... ... ... 44 ... 46 47 ... 49 ... a
APARTMENT PERFORMANCE AND EMPLOYMENT DISTRIBUTION: A STUDY OF TWO CITIES
by
Daniel A. Pedrotti, Jr.
Submitted to the
Department of Architecture and the
Center for Real Estate Development 29 July 1988
in Partial Fulfillment of
the Requirements for the Degree of
Master of Science of Real Estate Development
ABSTRACT
This study examines and evaluates the relationship between levels of employment by sector and rent levels of two cities. The study follows the performance of several thousand apartments over a period of time in Denver, Colorado and Phoenix, Arizona. The study examines actual rents collected in juxtaposition with wage and salary employment data. The specific questions addressed in the research process include:
How do the local economies of each study area differ from the United States? from
each other?
Do different economies create different returns?
What is the relationship between
employment distribution and rent levels?
The focus of analysis is the influence of diversification in the local economy in residential property performance.
Thesis Advisor: Marc Louargand
Title: Lecturer in the Department of Urban Studies and Planning
CHAPTER ONE
INTRODUCTION
Upon beginning an examination of a city's economy, one of the first questions employer in to typically make a future prospects preferred answer equal share o diversification consistent stab because a city sectors. J. Par
asked is "What sector is the predominant wn?". Given the answer, t
prejudgment as to that eco for viability. Many have to the question is maximum f employment in each sec
desirable is the notion le growth. It is believed can avoid dependence on one ry Lewis writes (8),
he observer will nomy's current and suggested that the
diversity with an tor. What makes that it promotes that this occurs or a few economic
The prescription for stability of employment has several ingredients. The goods and services exported by the residents should be as diverse as possible. Any specialization in market or in product makes these residents vulnerable to particular fluctuations in demand. (p. 25)
Some further insight into this train of thought is offered by Werner Z. Hirsch (5):
Unstable growth is likely to mean that capacities and expectations are generated in the rapid growth phase which cannot be fulfilled in the slow growth phase, resulting not only in hardship in the latter phase, but probably also in a lower overall performance in the long run. In addition, unstable economic performance very often contributes to such ills and inefficiencies as, for example, excessive migration (and reverse migration), periodic financial difficulties of local government, and inability to plan for pleasing and efficient city building. (p. 263)
Stable growth is seen as the preferred path for a city. This entire system of logic is flawed in two counts. First, in a study similar to the one conducted in this paper, Moshen Attaran (1) looked at diversity indices and unemployment and income-based indicators for all fifty states and the District of Columbia. Attaran found that,
.. no strict assumptions can be made regarding a clear relationship between diversification and economic growth and stability. (p. 44)
Secondly, diversification theorists do not take into account that economies are reactive and dynamic creatures. The only constant is change. Further, the recent trend toward more global'economic influence means that a local economy is subject to forces that are not only beyond its control but beyond its planning capabilities. What a local economy should strive for is flexibility and agility in order to respond more efficiently to changes in the larger economies.
The results of this paper suggest that strong performance in one or a few sectors varies more closely with rents than the entire mix. This hypothesis is supported by findings in a study by John B. Corgel and Gerald D. Gay (2). They found that, "local economies are typically heavily influenced by a dominant economic sector". They also saw that this "dominant" sector varied across economies and varied in magnitude of effect. In other words, the degree to which a local economy can make efficient use of its competitive advantage varies from city to city.
Another important aspect of economic performance is the ability of a city to attract new residents. This is a critical determinant when discussing a correlation with any aspect of housing. Bertrand Renaud (10) observed,
... population movements are predominantly determined by employment opportunities and income levels. The economic base determines private sector demands and an important part of
the public resources needed to meet them.(p. 7)
This connection is particularly relevant in this discussion. Growth in a single sector generally requires an influx of new employees. These new employees will in turn create new demand for non-base industries which will in time cause growth across sectors and influence rents.
With the idea in mind that there is considerable doubt as to whether diversification is the best route to economic growth, there is also significant doubt about diversification's ability to promote stability, as Attaran pointed out.
The author contends that diversification is not the best alternative for promoting economic performance. This paper is an attempt to shed some light on this contention. To that end a comparison was made between the employment distributions in the Denver and Phoenix versus United States. These data were used to estimate a diversification index. The examination of the Diversification Index includes an extensive discussion of
the three employment distributions and respective employment growth rates by sector. Subsequently, the study examines and discusses the performance of a few large apartment portfolios in the metropolitan areas.
Given the apparent conflict in the theories discussed above, it was appropriate to formulate some sort of test to examine the relationship between economic performance and employment. Taking average per unit rents collected in some large apartment portfolios as a measure of return, the study documents the relationships between divers-ification and rents collected. It further examines the relationship between individual employment sectors and the same rents collected. The significance of the study lies in the discovery of what tracks rents more closely.
Number of persons employed by sector is an input into the index of diversification. The diversification index is used to facilitate the examination of the differences between the local economies. This in turn, leads into an examination of the
individual sectors. The combination of these discussions form the basis of a discussion on the correlation and covariance between apartment performance and respective distributions of employment.
CHAPTER TWO
DIVERSIFICATION INDEX
This chapter introduces a diversification index. This index is an attempt to measure the difference between the United States' employment distribution and the local employment distribution for Denver and Phoenix respectively.
Beginning with the idea that the employment distribution for the entire United States represents total employment in any given sector, the index value for the US would be a relative measure of systematic risk. That is it represents the absence of specific risk. Any variation from this distribution introduces specific risk and makes a local economy less likely to perform like the US economy.
Mechanically, the diversification index is the sum of sector by sector absolute deviation from the US distribution subtracted from 1. This produces a number that ranges from almost 0 to 1. On this scale, as the index approaches 1 the local employment distribution approaches the US distribution. The index will never actually reach 0 because there will always be employment in at least one of the sectors.
This is a dynamic measure in that an employment distribution is a matter of constant change. As one sector slows significantly the employment base moves out of that sector and into others or
goes into unemployment. If all sectors suffer decline then the total employment changes and the distribution remains similar.
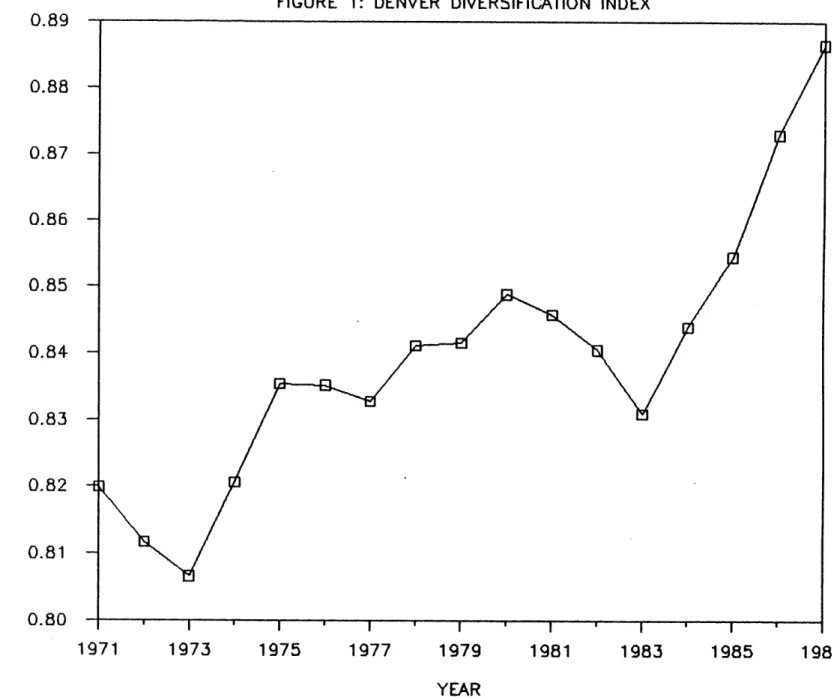
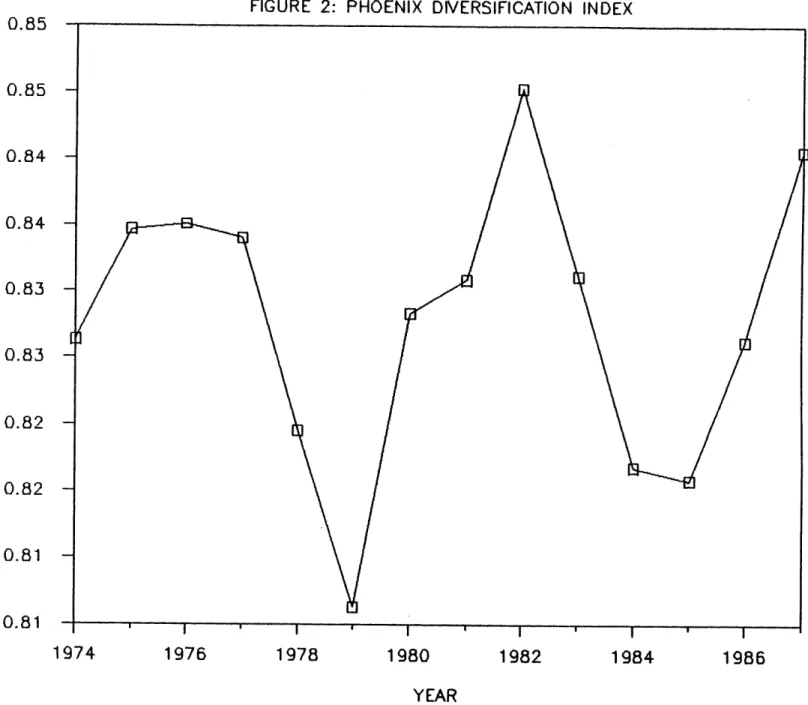
As shown in figures 1 and 2, over the years 1971 to 1987 the diversification index ranges from 80.7% to 88.7%, in Denver. In Phoenix, over the years 1974 to 1987, it ranges from 80.6% to 84.5%.
DENVER
In Denver the diversification index generally increased throughout the time period 1971 to 1987. During this period the first major turn was in 1973 when Denver began to get more diverse. There were two years of considerable increase in the index followed by five years of slow increases. There was a strong down turn in the early eighties due primarily to increases in the Oil and Gas aspect of the Mining sector. Once this sector began contracting the economy showed a strong trend towards diversification. The discussion in the next chapter shows that the economy may not be better off due to this increased diversity. It is very important to keep in mind that this index can increase for negative reasons. For example, if a sector had grown out of proportion with the rest of the
employment and subsequently goes into an extended period of decline, total employment may decline. While this overall decline is occurring the index is rising but the economy is suffering.
FIGURE 1: DENVER DIVERSIFICATION INDEX
0.89
0.88
0.87
x
0.86
z
z
0.85
0.84
Li0
0.83
0.82
0.81
0.80
,
1971
1973
1975
1977
1979
1981
1983
1985
1987
YEAR
FIGURE 2: PHOENIX DIVERSIFICATION INDEX
0 .8 5
-
.... ...
0.85
-0.84
-La
0.84
-0
z
o
0.83
-Ii-.
0.83
0.82
0.82
0.81
0.81
1974
1976
1978
1980
1982
1984
1986
YEAR
PHOENIX
In Phoenix the index is subject to dramatic swings. There was no discernible overall trend. What was observed was a strong decline in the index value- from 1977 to 1979 followed by an equally strong increase from 1979 to 1982. This was followed by another substantial decrease from 1982 through 1985 and again an increase from 1985 to 1987. There appears to be some cyclic influence in the distribution of employment in this economy. It appears to be a less diverse employment base than Denver. The study will demonstrate that Phoenix had substantial growth in a variety of sectors over the study period with Construction moving in a very similar manner as the index. This serves to differentiate it from the US and Denver as both of these had less volatile growth patterns. Phoenix overall growth rate as an employer was tremendous over the study period. Total employment growth in Phoenix, at 6.86% annually, was well above the US or Denver.
What follows is an in depth look at how the trends in specific sectors serve to differentiate these local employment distributions from the United States' distribution. This discussion serves to delineate which sectors have the highest degree of influence on the trends in rents.
CHAPTER THREE
ECONOMIC MAKEUP OR EMPLOYMENT DISTRIBUTION
This part of the discussion begins with an overview of the growth trends in total employment in the United States, Denver and Phoenix. What follows is a sector by sector analysis of each area's total distribution and a look at the growth trends in each sector. Exhibit 1 shows the employment levels in each of the study areas.
TOTAL EMPLOYMENT GROWTH - US, DENVER AND PHOENIX
Total employment in the United States grew at an annualized rate of 2.4% for the period 1975 to 1987. The major inflection points in this trend were in the years 1979 and 1983. From 1975 to 1979 the rate was 3.9%. This growth was considerably less from 1979 through 1983 when the rate averaged only 0.1%. The last period in the study showed a return to faster growth at a rate of 3.1% from 1983 to 1987.
In Denver the growth in total employment had different inflection points. Generally the growth was slightly faster than in the United States as a whole. The annualized rate for this SMSA was 3.4% from 1975 to 1987. Denver employment growth did not slow down during the 1979 to 1984 period as did the US. It progressed at a fairly steady rate of 4.5% until 1984. From 1984 through 1987 total employment growth flattened out to a rate of only 0.3%.
EXHIBIT 1: TOTAL EMPLOYMENT LEVELS
75
76
77
78
79
80
81
82
83
84
85
86
87
0
U. S.
/
100
1.10
1.00
0.90
I-.' C', 0 0.80(I-z
0
L IL.0
z
0.70
0.60
0.50
0.40
+DENVER
SPHOENIX
Phoenix had substantially higher growth in employment. The growth rate in total employment was 6.5%, almost three times
the national growth rate. Phoenix had inflection points very similar to the US trend. From 1975 to 1979 Phoenix total employment grew at the incredible rate of 9.3%. It did exhibit some of the slow growth as in the US trend but it only slowed from 1979 to 1982 when local employment grew at a rate of 2.2%. Phoenix then returned to its growth pattern from 1982 to 1987 at a rate of 6.9%.
EMPLOYMENT TRENDS BY SECTOR
In an attempt to explain the variation between the United States trends and the Denver and Phoenix trends in employment, what follows is an analysis of each sector. It is important to look first at the overall performance of the sectors. One must keep in mind that these sectors act differently across economies. The growth and decline phases do not necessary coincide. A good understanding requires a close look at the points of inflection and the growth rates between these points. This analysis examines and compares each sector's relative share of total employment and the growth trends in each sector's employment.
The sectors discussed represent total non-agricultural employment. It is obvious that variations will occur between the US distribution and a given SMSA. It is important to keep in mind that this part of the analysis is based on the
percentage employment per sector and number of persons employed in each sector. It is also important to make careful note of dates relating to changes in the various distributions. The eight major non-agricultural sectors are:
1. MINING
2. CONSTRUCTION 3. MANUFACTURING
4. TRANSPORTATION AND UTILITIES 5. RETAIL AND WHOLESALE TRADE 6. SERVICE
7. FINANCE, INSURANCE AND REAL ESTATE 8. GOVERNMENT
UNITED STATES
The largest employment sectors in the United States in 1970 were Manufacturing, Trade, Government, and Service in order of magnitude this is displayed in Table 1. The distribution across these sectors was 27.3%, 21.2%, 17.7% and 16.3% respectively. By 1980 this distribution had changed such that the order was Trade, Manufacturing, Service and then Government. This happened due to growth in the Trade and Service sectors and decline in the Manufacturing sector. Government remained relatively stable. By 1987 employment had shifted such that the rank was Service, Trade; Manufacturing and Government in declining order. By this time the distribution was 23.64% in Service, 23.56 in Trade, 18.72% in Manufacturing and 16.71% in Government. These shifts occur because one or a few sectors grow faster or slower than does total employment.
TABLE 1: UNITED STATES EMPLOYMENT DISTRIBUTION MINING CONST 0.88% 0.86% 0.85% 0.84% 0.89% 0.98% 0.98% 0.99% 0.98% 1.07% 1.14% 1.25% 1.26% 1.06% 1.02% 0.95% 0.79% 0.73% 5.06% 5.20% 5.28% 5.34% 5.14% 4.58% 4.50% 4.67% 4.88% 4.97% 4.81% 4.59% 4.36% 4.38% 4.64% 4.79% 4.92% 4.93% MFG TRANS/ UTILS 27.32% 26.15% 25.99% 26.25% 25.65% 23.81% 23.93% 23.87% 23.65% 23.42% 22.44% 22.13% 20.97% 20.44% 20.51% 19.75% 19.07% 18.72% 6.37% 6.29% 6.16% 6.06% 6.04% 5.90% 5.77% 5.71% 5.68% 5.72% 5.69% 5.67% 5.67% 5.49% 5.46% 5.37% 5.26% 5.27%
TRADE SERVICE FIRE 8OVT
21.22% 21.56% 21.65% 21.63% 21.70% 22.18% 22.37% 22.45% 22.54% 22.48% 22.47% 22.54% 22.84% 23.15% 23.39% 23.66% 23.67% 23.56% 16.29% 16.57% 16.66% 16.74% 17.17% 18.05% 18.33% 18.56% 18.75% 19.05% 19.79% 20.43% 21.25% 21.83% 22.01% 22.56% 23.19% 23.64% 5.14% 5.30% 5.30% 5.27% 5.30% 5.41% 5.38% 5.42% 5.45% 5.54% 5.71% 5.81% 5.96% 6.06% 6.02% 6.11% 6.32% 6.45% 17.71% 18.09% 18.10% 17.88% 18.11% 19.08% 18.73% 18.34% 18.08% 17.75% 17.96% 17.59% 17.68% 17.59% 16.96% 16.81% 16.78% 16.71% SOURCE: BUREAU OF LABOR STATISTICS - MONTHLY LABOR REVIEW
15 YEAR 1970 1971 1972 1973 1974 1975 1976 1977 1978 1979 1980 1981 1982 1983 1984 1985 1986 1987
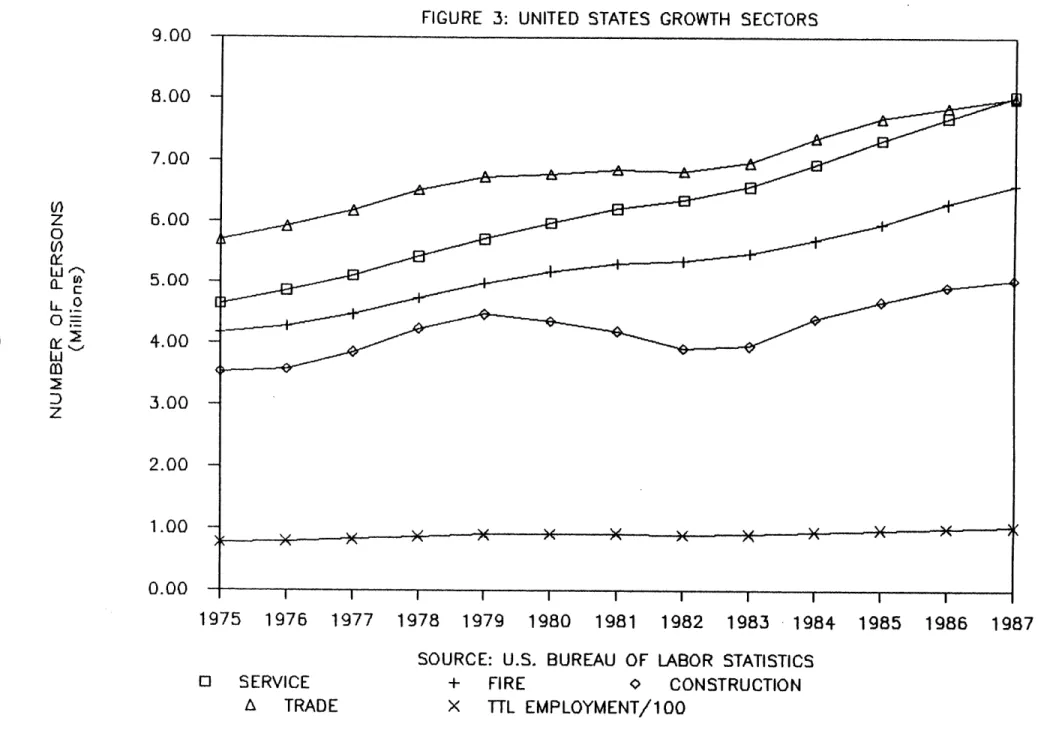
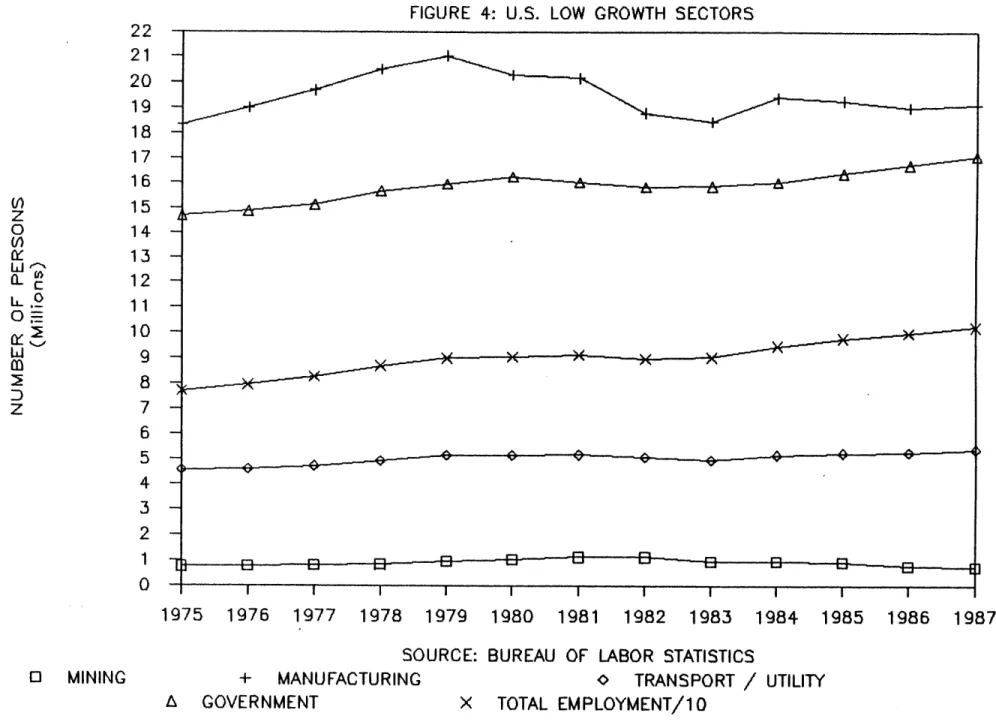
Over the study period 1975 to 1987, the US had above average growth in Service (4.8%), FIRE (3.9%), Construction (3.0%) and Trade (2.9%). These were the sectors that showed growth at rates above the growth of total employment (2.4%) as is evident in Figure 3. This makes a delineation between these "growth" sectors and the rest which were in periods of either slower than average growth or in contraction. These slow growth sectors were Mining (-0.12%), Manufacturing (0.4%), Transportation and Utility (1.4%) and Government (1.3%). All of these sectors lost relative to their respective shares of total employment. This is shown in Figure 4.
EMPLOYMENT GROWTH BY SECTOR MINING
US employment in the Mining sector was .88% of total employment in 1970. It peaked in about 1981-82 at 1.25 - 1.26% and declined to .73% in 1987. This is as expected and it only confirms the much publicized trends in the Oil and Gas industry. Which is a major subset of Mining employment.
The general trend in this sector was negative over the entire period. In 1975 there were 752,000 persons employed in this
industry. The annualized rate of growth between 1975 and 1981 was 7.2%. This was well above the total employment growth rate of 2.6%. However, from 1981 to 1987 dropped off at a rate of -6.9% from 1,139,000 persons in 1981 to only 741,000 in 1987.
This represents an annualized growth rate of -0.12%.
FIGURE 3: UNITED STATES GROWTH SECTORS
1975
1976
1977
1978
1979
1980
1981
1982
1983
1984
1985
1986
1987
SOURCE: U.S. BUREAU OF LABOR STATISTICS
o
SERVICE
A
TRADE
+
FIRE
c
CONSTRUCTION
X
TTL
EMPLOYMENT/100
c
0 (f)z
0 L LL 0 elf ILL Dz
9.00
8.00
7.00
6.00
5.00
4.00
3.00
2.00
1.00
0.00
22
21
20
19
18
17
16
15
14
13
12
11
10
9
8
7
6
5
4
3
2
1
0
I1975
1976
1977
1978
1979
1980
1981
1982
1983
1984
1985
1986
1987
SOURCE: BUREAU OF LABOR STATISTICS
0
MINING
+
MANUFACTURING
A GOVERNMENT
0
TRANSPORT / UTILITY
X
TOTAL EMPLOYMENT/10
(0" 0) wiiz
0 -0
Cw 0:: Dz
FIGURE 4: U.S. LOW GROWTH SECTORS
-...
...
...
-...
-I
-...
...
...
E
3
...
...
,E3- - B ... i - Ei E3 -B k I I I I I I ICONSTRUCTION
Construction as a component of total US employment rarely represents over 5% of the total. In the period 1970 to 1987, only in the early seventies did the construction sector made up as much as 5.34% of the total. Variation has been relatively slight but definitely cyclic. The cycles appear to be approximately 5-6 years from trough to trough.
From 1975 to 1979, persons employed in this sector grew at an annualized rate of 6.1%. This period of growth was followed by a period of contraction from 1979 to 1982. The contraction took place at a rate of -4.4% annually. From 1982 until 1987 the US construction employment grew 5.2% per year on average. Over the entire period 1975 to 1987 the average annual growth rate was 3.0% which is above the national average for total employment growth at 2.4%.
MANUFACTURING
The US has always had a much larger portion of total employment in this field when compared to the two cities. With about 18 to 21 million people employed in this sector, the US had 18.7 to 27.3% of the total employment in the manufacturing sector. This is due in large measure to the heavy manufacturing influence in the Midwest and northeast. This sector as a percentage of total employment declined throughout the
seventies and eighties. There was a slight increase in the early seventies but it has shown a decided decline since.
Manufacturing grew at an annualized rate of only 0.4% over the years 1975 to 1987 considerably less than the growth in total employment. During this time period there were 4 years of consecutive growth. 1975 to 1979 exhibited a growth rate of 3.5% which was just over the rate for total employment at 2.4%. However, from 1979 until 1987 there was only one year of slight growth.
TRANSPORTATION AND UTILITIES
Nationally, this sector has declined every year since 1975, in terms of share of total employment. From 5.9% in 1975 to 5.27%
in 1987 it showed a slow but steady decrease.
Even as this sector was losing position in the national employment distribution, it was growing as an employer. In 1975 this industry employed about 4.5 million people and in 1987 it had approximately 5.4 million. This translates to an annualized growth rate of only 1.4%, which was a about half of the total employment growth rate at 2.4%.
TRADE
The national percentage employment in this sector shows a steady upward trend throughout the entire time period evaluated. There appear to be slight contraction or deceleration period about every six years. Although it has never been as large on a percentage basis as either Denver or
Phoenix, it has been growing as a share of total employment at a faster rate than either of the two metropolitan areas. The percentage numbers in this sector are very significant. Between 1/5 and 1/4 (19.9% in 1971 to 23.6% in 1987) of all non-agricultural employees in this country are employed in Wholesale and Retail Trade.
The reason the share of total US employment in this sector is increasing is because the US Trade sector is growing at a rate of 2.9% and this is at least a little faster than rate for total US employment which is 2.4%. It is important to note that in Denver, Phoenix, and the US as a whole, the Wholesale and Retail trade sector is growing.
SERVICE
The service sector employment was a major growth area for almost all areas of the US. This is very apparent when looking at the percentage of total employment data. It is a major employer nationally. It has employed between 16.3 and 23.6% of the total. That was nearly one quarter of the non-agriculture employees in the US.
The Service sector demonstrated the fastest growth across all three of the study areas. In this study, the author found a US growth rate of about 4.7% in the number of people employed in this sector. This is nearly twice the rate for total employment in the US over the same period.
FIRE
In the US as a whole the FIRE sector gradually gained a stronger position in total employment. From 1970 to 1987 it never rose above 6.5%. It did however increase its percentage each consecutive year during the same period. In 1970 it was only 5.1% of the total employment.
The FIRE sector represents another growth industry in all three of the areas covered in this study. The US showed a slower growth rate than did either Phoenix or Denver, but it exhibited positive growth each year in the period studied. The rate of growth was fairly constant at 3.9% from 1975 to 1987. This is well above the total employment growth rate of 2.4%
GOVERNMENT
Nationally, from 1976 until 1987 there was a steady decline in the percentage of people employed by local, state and federal government. In 1975 there was as much as 19.1% of the total employment in this sector. By 1987 this percentage was only 16.7%. This is to be expected with the past few administrations trying to lower government spending and control the deficit. As mentioned earlier this does not necessarily mean there is any real decline in government employment, it may only mean that there was a slower growth than total employment.
Besides a slight contraction from 1980 to 1983, this sector always showed a small positive growth rate. From 1975 to 1980
growth was 2.0%. From 1983 to 1987 the rate was only 1.8%. At
1.3% the rate of employment growth from 1975 to 1987 is about 1/2 of the growth rate for total employment in the US.
DENVER
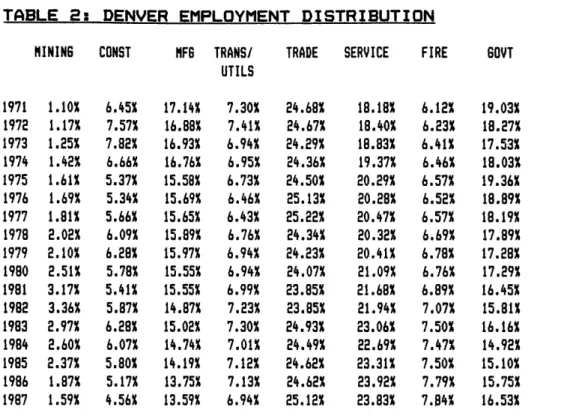
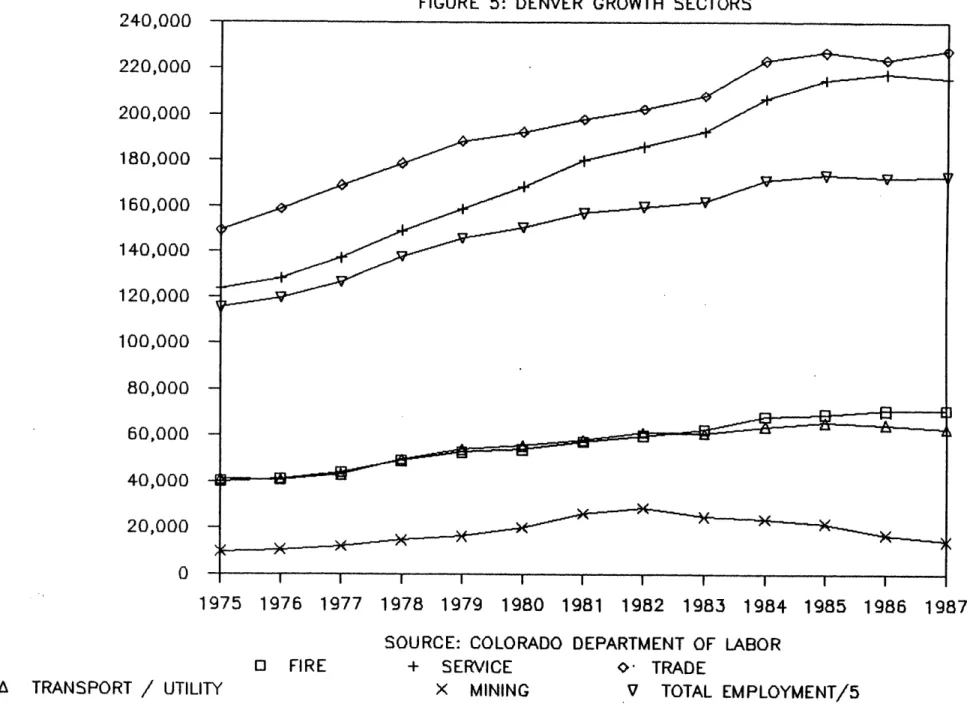
The employment distribution for Denver changed significantly over the study period. (See Table 2) Generally Denver employment showed an overall compound growth rate of 3.4% as mentioned earlier. The sectors that grew faster than this rate were FIRE (4.9%), Service (4.8%), Trade (3.6%) and Transportation and Utility (3.6%). The Mining sector grew at a rate of 3.3% over the study period. While this seems to be only a slight slowing, the fact is that a major upheaval occurred in this sector. (See Figure 5)
The three remaining sectors grew at rates that were slower than total employment. These were Manufacturing (2.2%), Construction (2.0%) and Government (2.0%). (See Figure 6)
The Denver economy has healthy employment levels in most sectors. Besides the Mining sector, the total employment was distributed well. There are several other significant employers in Denver including a Federal Reserve Bank, a U. S. Mint, Coors, Inc. and the major ski resorts. It is also a major Railroad terminal. Denver is rather well diversified.
TABLE 2: DENVER EMPLOYMENT DISTRIBUTION MINING CONST 1.10% 1.17% 1.25% 1.42% 1.61% 1.69% 1.81% 2.02% 2.10% 2.51% 3.17% 3.36% 2.97% 2.60% 2.37% 1.87% 1.59% 6.45% 7.57% 7.82% 6.66% 5.37% 5.34% 5.66% 6.09% 6.28% 5.78% 5.41% 5.87% 6.28% 6.07% 5.80% 5.17% 4.56% SOURCE: COLORADO COLORADO MFG TRANS/ UTILS 17.14% 16.88% 16.93% 16.76% 15.58% 15.69% 15.65% 15.89% 15.97% 15.55% 15.55% 14.87% 15.02% 14.74% 14.19% 13.75% 13.59% 7.30% 7.41% 6.94% 6.95% 6.73% 6.46% 6.43% 6.76% 6.94% 6.94% 6.99% 7.23% 7.30% 7.01% 7.12% 7.13% 6.94%
TRADE SERVICE FIRE GOVT
24.68% 24.67% 24.29% 24.36% 24.50% 25.13% 25.22% 24.34% 24.23% 24.07% 23.85% 23.85% 24.93% 24.49% 24.62% 24.62% 25.12% 18.18% 18.40% 18.83% 19.37% 20.29% 20.28% 20.47% 20.32% 20.41% 21.09% 21.68% 21.94% 23.06% 22.69% 23.31% 23.92% 23.83% DEPARTMENT OF LABOR AND EMPLOYMENT, LABOR FORCE REVIEW
24 1971 1972 1973 1974 1975 1976 1977 1978 1979 1980 1981 1982 1983 1984 1985 1986 1987 6.12% 6.23% 6.41% 6.46% 6.57% 6.52% 6.57% 6.69% 6.78% 6.76% 6.89% 7.07% 7.50% 7.47% 7.50% 7.79% 7.84% 19.03% 18.27% 17.53% 18.03% 19.36% 18.89% 18.19% 17.89% 17.28% 17.29% 16.45% 15.81% 16.16% 14.92% 15.10% 15.75% 16.53%
FIGURE 5: DENVER GROWTH SECTORS
1975 1976 1977 1978 1979 1980 1981 1982 1983 1984 1985 1986 1987
SOURCE: COLORADO DEPARTMENT OF LABOR
0
FIRE
A TRANSPORT / UTILITY
+
SERVICE
X
MINING
TRADE
V
TOTAL EMPLOYMENT/5
(n)z
0
(n) CL ILmu
0
cii 0::D
z
240,000
220,000
200,000
180,000
160,000
140,000
120,000
100,000
80,000
60,000
40,000
20,000
0
FIGURE 6: DENVER LOW GROWTH SECTORS
1975 1976 1977 1978 1979 1980 1981 1982 1983 1984 1985 1986 1987
SOURCE: COLORADO DEPARTMENT OF LABOR
O
MANUFACTURING
0
GOVERNMENT
+
CONSTRUCTION
A
TOTAL EMPLOYMENT/5
0Iz
0 (L0
180,000
170,000
160,000
150,000
140,000
130,000
120,000
110,000
100,000
90,000
80,000
70,000
60,000
50,000
40,000
30,000
EMPLOYMENT GROWTH BY SECTOR
MINING
In Denver, the Mining sector has always represented a much larger share of total employment when compared to the US as a whole. In 1971 the employment in this sector comprised 1.1% of total employment. This rose every year until 1982 when it employed 3.36% of the non-agricultural employment, this is over three times the 1971 figure. It declined dramatically to only 1.56% by 1987. This is the classic example of volatile growth, which Hirsch spoke about in the introduction (5).
Where the US showed growth from 1975 to 1981, Denver continued through 1982. The annualized growth rate over this period was 16.5% in Denver. From 1982 to 1987 the rate was -12.8%. This translates to a growth rate of 3.3% for the entire period 1975 to 1987, just under the growth rate for total Denver employment which was 3.4% and considerably faster than the US rate, 2.4%, for total employment.
CONSTRUCTION
The Denver construction sector has consistently held a larger share of employment than the national average. Except in 1987 when construction was only 4.56% of the total non-agricultural employment in Denver (US was 4.93%). The cycles in this sector in Denver show much more variability than the national cycles. It is interesting to note that from 1981 to. 1987 Denver
appeared to move counter - cyclically when compared to the US. The percent of total employment in construction has ranged as high as 8.14%.
The cyclic nature of this industry is very evident when tracking employment. From 1975 to 1979 it grew at a rate of about 10.5% annually but from 1979 to 1981 the rate was -4.1%. There was growth from 1981 to 1984 at an annualized rate of 7.2% and contraction from 1984 to 1987 at -9.3%. Over the entire period 1975 to 1987 the annualized rate was 2.0%, considerably less than the US construction employment growth rate which was 3.0%. It is also well below the total employment growth rate for Denver (3.4%)
MANUFACTURING
This is the single sector in which Denver has a consistently lower percentage of total employment than the US. Manufacturing has employed between 13.6 and 17.1% of the Denver total employment during the study period. However this sector is behaving very similarly to the US in that it is steadily losing its share of total employment. While this is a slower decline than nationally, it is clearly a strong trend.
This decline is occurring despite the fact that the growth rate for this sector in Denver has been basically positive throughout the 13 year period. Until 1984 the Manufacturing sector was growing at a rate of 4.0% which is slower than the
Denver total employment rate of 4.5% for the same time frame. From 1984 to 1987 when the Denver total employment levelled off to nearly zero growth, the Manufacturing sector suffered a slight contraction. Over the study period the growth rate in this sector was 2.2%, about half of the total employment growth rate of 3.4%. Consistently slower growth has caused the market share loss discussed above, even though Denver Manufacturing
has grown much faster than US Manufacturing.
TRANSPORTATION AND UTILITIES
Denver has shown the largest percentage of employment in this industry. Except for a few years from 1975 to 1978 it has always had 7% or better in this sector. The transportation and utility employment share showed a growth trend'from 1977 to 1983 and was fairly flat from 1983 to 1967. This is typical for an area that has good growth as the Transportation and Utility sector must keep up with the growth.
In examining the growth in the number of persons employed in this sector, one can see that it has grown every year in the study except 1986 and 1987. Over the time frame 1975 to 1987, Denver Transportation and Utilities have produced a 3.6% rate of annualized growth. This is just above the rate of total employment growth for Denver. This is why it has maintained a relatively level percentage of total employment in Denver. This is also about three times the growth rate for the US in the same sector.
TRADE
In Denver, the wholesale and retail trade sector has been very stable throughout the years. With a quarter of total employment in Denver, it has maintained a 24-26% share of total employment from 1971 to 1987.
As with the US, Denver showed a continual pattern of growth in Trade industry employment. Until 1984 the sector was adding employees at a rate of 4.6 %, a figure well above the average annual growth of Denver total employment. From 1984 to 1987 the growth pattern was quite flat at only 0.7%. Overall, this
industry grew at a rate of 3.6% or just above the 3.4% rate for total employment.
SERVICE
In Denver the growth in this sector's percentage of total employment was just less than 2%, (1.94%) per year. From 1971 to 1987 it showed a steady increase in its share. It made up 18.2 to 23.8% of employment or about 1/5 of the total.
During the years 1975 to 1985, Denver employment in the Service sector grew at an annualized rate of 5.7% which is much faster than the rate for total employment in Denver. In 1985, the growth flattened out for the next two years. The overall average growth rate for Service sector employment was 4.8% from 1975 to 1987 still considerably above the rate for total employment.
FIRE
In Denver the FIRE sector was slightly more significant with a 6.1% to 7.8% share of total employment. It did not grow every year but did exhibit a decidedly positive trend.
The Denver FIRE sector grew at a rate of 6.1% from 1975 to 1984. From 1984 to 1987 this sector slowed down a great deal to a rate of only 1.4%. Given the significant growth through 1984, the annualized rate over the study period was 4.9%, which is almost one and one half times greater than the rate for total employment in Denver.
GOVERNMENT
Government is always a significant employed between 15.8 and 19.7% of enough, Denver showed gains in this most recent years. From 1984 to upswing in the percentage employed always important to remember that independently of market forces.
employer and in Denver it the total. Interestingly
area of employment in the
1987 there was a definite by the government. It is the government often moves
In Denver the growth trend of government employment looks almost exactly like the line for the US. It has an annualized rate of 2.0%. It has the same contraction from 1980 to 1983 and a similarly small positive growth rate.
PHOENIX
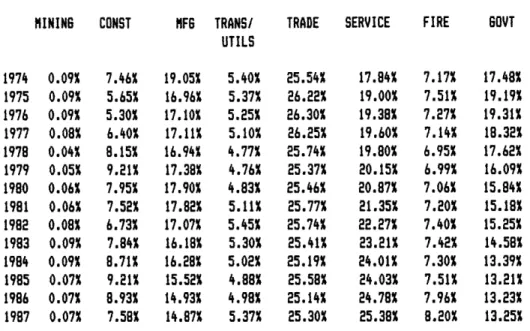
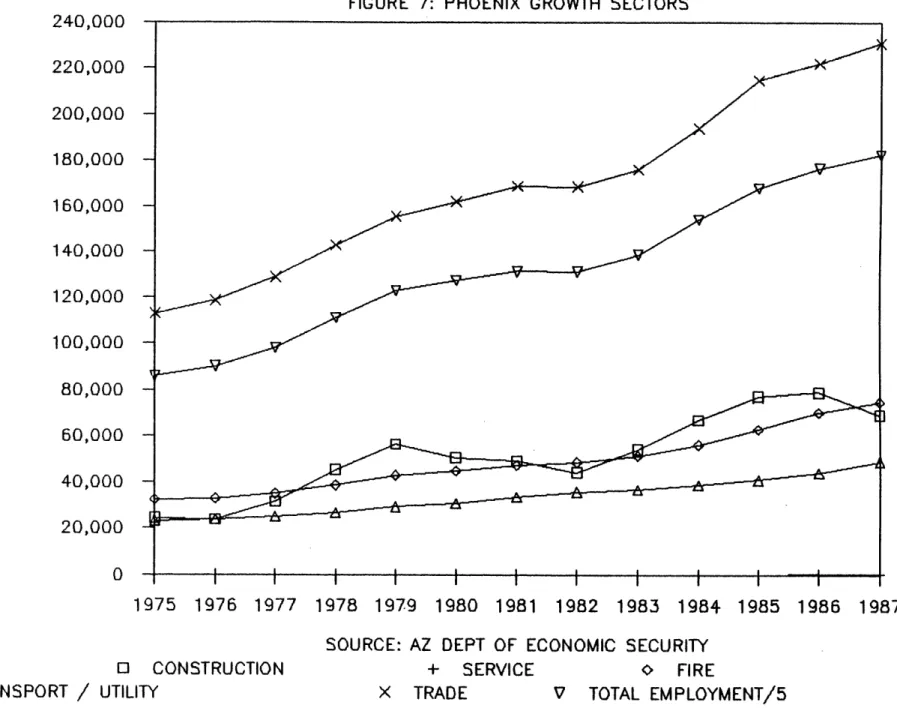
The growth in all sectors in Phoenix led to some substantial changes in the distribution of employment over the study period these are shown in Table 3. The extraordinary growth in Phoenix total employment was matched or exceeded by growth in four sectors. These were Construction (10.0%), Service (9.1%), FIRE (7.2%) and Transportation and Utilities (6.5%). Trade should be mentioned here because for much of the study period it exhibited a faster than average rate of growth. The annualized rate of growth for Trade was 6.2%, a rate which would have made it very significant in either of the other areas studied. (See Figure 7)
The slow growth industries in Phoenix were different than in Denver or the US. They were Manufacturing (5.3%), Mining (3.4%) and Government (3.2%). All three of these had faster rates than in either of the other two areas. (See Figure 8)
EMPLOYMENT GROWTH BY SECTOR MINING
In Phoenix, the Mining sector has never been a significant part of total employment. For instance, in 1974 Mining employment was only .09% of the total. This declined in 1978-79 to only
.04-.05% and increased through the eighties to .07%.
TABLE 3: PHOENIX EMPLOYMENT DISTRIBUTION MINING CONST 0.09% 0.09% 0.09% 0.08% 0.04% 0.05% 0.06% 0.06% 0.08% 0.09% 0.09% 0.07% 0.07% 0.07% 7.46% 5.65% 5.30% 6.40% 8.15% 9.21% 7.95% 7.52% 6.73% 7.84% 8.71% 9.21% 8.93% 7.58% MFG TRANS/ UTILS 19.05% 16.96% 17.10% 17.11% 16.94% 17.38% 17.90% 17.82% 17.07% 16.18% 16.28% 15.52% 14.93% 14.87% 5.40% 5.37% 5.25% 5.10% 4.77% 4.76% 4.83% 5.11% 5.45% 5.30% 5.02% 4.88% 4.98% 5.37% TRADE SERVICE 25.54% 26.22% 26.30% 26.25% 25.74% 25.37% 25.46% 25.77% 25.74% 25.41% 25.19% 25.58% 25.14% 25.30% 17.84% 19.00% 19.38% 19.60% 19.80% 20.15% 20.87% 21.35% 22.27% 23.21% 24.01% 24.03% 24.78% 25.38% FIRE GOVT 7.17% 7.51% 7.27% 7.14% 6.95% 6.99% 7.06% 7.20% 7.40% 7.42% 7.30% 7.51% 7.96% 8.20% 17.48% 19.19% 19.31% 18.32% 17.62% 16.09% 15.84% 15.18% 15.25% 14.58% 13.39% 13.21% 13.23% 13.25% SOURCE: ARIZONA DEPARTMENT OF ECONOMIC SECURITY,
MARICOPA COUNNTY LABOR FORCE AND EMPLOYMENT
33 1974 1975 1976 1977 1978 1979 1980 1981 1982 1983 1984 1985 1986 1987
FIGURE 7: PHOENIX GROWTH SECTORS
1975 1976 1977 1978 1979 1980 1981 1982 1983 1984 1985 1986 1987
SOURCE: AZ DEPT OF ECONOMIC SECURITY
0
CONSTRUCTION
A
TRANSPORT / UTILITY
+
SERVICE
X
TRADE
o
FIRE
V
TOTAL EMPLOYMENT/5
(n)z
0
0 el LiUz
240,000
220,000
200,000
180,000
160,000
140,000
120,000
100,000
80,000
60,000
40,000
20,000
0
FIGURE 8: PHOENIX LOW GROWTH SECTORS
1975 1976 1977 1978 1979 1980 1981 1982 1983 1984 1985 1986 1987
SOURCE: AZ DEPT OF ECONOMIC SECURITY
0
MANUFACTURING
c
GOVERNMENT
+
MINING
A
TOTAL EMPLOYMENT/10
(I)z
0
to0.
L. IL0
0Z
z
Lf
140,000
130,000
120,000
110,000
100,000
90,000
80,000
70,000
60,000
50,000
40,000
30,000
20,000
10,000
0
The growth in this sector has not mirrored either Denver or the US. Most years have been either 0 growth or positive. Over the study period the rate was 3.4% or about half of Phoenix total employment growth.
This sector employed only 400 persons in 1975 and only 600 in 1987 (At its peak there were as many as 700 persons). In Phoenix the quarry operations are the only significant employer in the Mining sector. This helps explain why the trends do not track Denver and the US more closely.
CONSTRUCTION
Phoenix construction employment has represented a higher percentage of the total employment than in either the US or Denver. Since 1976, one can observe almost two entire cycles. In 1979 and in 1985, as much as 9.21% of total employment was working in this sector. The downturns have also been most
pronounced in Phoenix as compared to either the US or Denver.
Construction employment in Phoenix grew from 1975 to 1979 at a rate of 33.2%! This tremendous growth was followed by three consecutive years of decline at an average rate of -7.9% annually. Three years of rapid growth and one slower growth year followed. During 1987 construction employment declined at a rate of 12.3%. During the entire period from 1975 to 1987 the annualized rate of growth was 10.0%. This exceeds the growth in total employment for Phoenix (6.5%).
MANUFACTURING
Phoenix on the other hand has not had such a definite trend. It was not until 1982 that the manufacturing sector began to lose its share of total employment. From 1982 forward Phoenix manufacturing declined even faster than the national manufacturing sector. It has always been a major employer with
14.9 to over 19% of total employment.
Uninterrupted growth in all years except 1982 and 1983 have still left this a declining sector as a component of total employment. An annualized growth rate of 5.3% would have made this a very large share of either of the other two economies, however the tremendous growth in Phoenix (6.5%) has allowed
this sector to lose its share of the total.
TRANSPORTATION AND UTILITIES
Phoenix had the smallest percentage of employment in this industry. The employment here as a percentage of total employment has peaked once in 1982 and has bottomed out twice in 1979 and 1985. As a trend line the graph is quite flat. At its highest point it was only 5.4% of the total employment and at the low point it was 4.8%.
In terms of actual growth this sector exhibited a strong positive trend . Throughout the years 1975 to 1987 there was a steady 6.5% growth rate. This explains the flatness of the percentage time series.
TRADE
As with Denver and recently in the US as a whole, Phoenix employs one quarter of its people in this business. It has been between 25.1 and 25.8% except in 1975 when it rose to 26.2%. Phoenix has a very flat trend line in this sector. While there has been little variation it does exhibit some
subtle cyclic tendency.
In Phoenix the actual employment in the Trade industry grew quite fast from 1975 to 1981 producing a rate of 7.0%. It levelled off from 1981 to 1983 but, in 1983 it took off again and grew at a rate of 7.0% through 1987. The rate from 1975 to 1987 was 6.2%. Once again a sector shows tremendous growth but due to the 6.5% growth in the Phoenix total employment every year, the sector loses part of its share.
SERVICE
Phoenix had the largest increases in the Service sector share of total employment. In 1974, 17.8% of non-agricultural employees were working in the service sector. By 1987 this percentage had risen to over 1/4 of the total (25.4%).
The actual number of people employed in this sector also grew very rapidly. At a rate of 9.1% annually it was the second fastest growth industry in Phoenix. From only 81,700 people in
1975 it grew to employ 231,600 by the end of 1987.
FIRE
Phoenix' FIRE employment grew faster than Denver's or the US'. However, it did not grow fast enough to increase its share of total employment. Over the study period the percentages did not vary much. In the study, Phoenix had the largest share of employment in this sector from 1974 to 1983. In 1986 and 1987 it regained the lead in this regard. Phoenix had between 7.0 and 8.2% of its non-agricultural employees in this field.
This sector in Phoenix grew in employment at a rate of 6.7% from 1976 to 1982. From 1982 through 1987 this rate increased dramatically to 9.1%. This last five years of increased growth boosted the annualized rate to 7.2%. This is also a major contributor to the growth in Phoenix' total employment.
GOVERNMENT
Government represented employment for between 13.3 and 19.3% of the total during the years studied. Phoenix' government sector decreased its share of total employment. In fact it decreased faster than any of the other areas in this study. It seemed to
level off from 1984 to 1987.
At 3.2%, Phoenix exhibits the fastest growth rate for government employment. While this is somewhat favorable in comparison to the other two areas, it grew slower than the local total employment. This is why government lost its share of total employment faster in Phoenix than elsewhere.
SUMMARY OF EMPLOYMENT TRENDS
DENVER - Looking back at the review presented above, Denver employment sectors behaved rather similarly to the US sectors. Major differences occurred in the Mining sector and subsequently in the overall employment growth. Denver was able to take advantage of an inflated oil and gas market and the new economics of exploration. However, along with the rest of the industry, the severe drop in the price of natural gas which began in 1981 or 1982 never recovered and brought on massive cut backs in employment. Oil shale production was also centered in Denver but this type of production was not enough to support the down turn in employment.
The question is whether the people leaving the Mining sector left Denver or went into other sectors for employment. Even with the strong growth trends in the Trade, Service and FIRE sectors, there is a consistent levelling off of growth in all sectors in Denver from about 1984 forward. Looking at total employment levels, the same trend is evident. One can safely assume that Denver did lose many of the people employed in the Mining sector. These losses were not debilitating. Due to very strong performance in other sectors, Denver did not completely collapse as an employer. It did have a significant contraction but did not fall off any where near as fast as the Mining sector. In fact, Denver may well benefit from a more
diverse employment base in the future.
PHOENIX - When compared to the US and Denver, Phoenix performed quite differently. With exceptionally strong growth patterns in most every sector Phoenix also had a more volatile economy as indicated by the fluctuations in its diversification index. During the study period, Phoenix was still enjoying the remnant benefits of the sunbelt migration mega-trend. This had developed some momentum and was still fueling a high growth rate in virtually all employment sectors.
Comparing Phoenix to the US, one can see similarities in every sector but Construction and, until 1984, in Manufacturing. It is the variations in these sectors that makes Phoenix' employment base so different from the US'. Of particular interest is the Construction sector. Construction added dramatically to its position as an employer in Phoenix from 1982 to 1986 when the same sector declined in Denver and grew slowly in the US as a whole. The author sees this as a natural extension of a strong growth economy when growth is occurring across most every sector as in Phoenix.
However, this sector in Phoenix was subject to very dramatic cycle changes. The influence of the growth pattern is quite evident in the Transportation and Utility sector which moves in an almost exactly opposite way. While the Transportation sector grew at the same rate as the total employment in Phoenix, it lost its share of total employment when
Construction gained.
The Manufacturing sector may be the next growth area for the Phoenix area. A pronounced surge in Manufacturing employment occurred in 1984 at which time the US and Denver both showed significant contractions. This is in no small way attributable to the Phoenix' desire to cultivate employment in this sector.
CHAPTER FOUR
CHARACTERISTICS OF RENTAL INCOME
THE DATA
In this study, rent collected is used as a measure of return to the apartments. This is most appropriate because it reflects vacancy and discounts. The source of the rental income data was income and expense summaries from a few large portfolios. These portfolios represent apartments built in the normal course of for profit development and held under continuous ownership.
The Denver data came from continuously held, privately owned apartment complexes. There were as many as 32 complexes in a given year. These apartments were typically two story buildings in complexes of 58 to 360 units. The majority of these complexes were 200 to 300 units. There were between 1207 and 2974 apartments in the Denver data base with the latter number in the years 1981 through 1987. The figures go back to 1977. These are shown in Table 4. The actual source was the owner'?s income and expense summaries for each complex.
A summary of the rent data for Phoenix is in Table 5. The Phoenix data came from two sources. First, there were income and expense summaries from a major apartment manager. These data came from eleven different complexes of 135 to 402
apartments each. They were typical low rise buildings.
YEAR MEAN SAMPLE RENT/UNIT SIZE 1977 2,320.44 1207 1978 2,594.82 1437 1979 2,968.43 2037 1980 3,316.50 2440 1981 3,857.19 2974 1982 4,407.11 2974 1983 4,419.50 2974 1984 4,762.16 2974 1985 4,476.79 2974 1986 4,436.29 2974 1987 4,230.28 2974
TABLE 5: PHOENIX RENT DATA SUMMARY
YEAR MEAN SAMPLE
RENT/UNIT SIZE 1980 3,371.02 784 1981 3,469.36 991 1982 3,715.90 991 1983 4,222.03 1,038 1984 4,157.74 2,792 1985 4,198.73 3,771 1986 4,242.54 4,190 1987 3,916.07 2,671 44
The second source of data was a major local management company. This data was taken from property tax protest forms. This data covered ten complexes. These were also complexes of two story buildings with 200 to 300 units each. The Phoenix data spanned the period from 1980 to 1987.
United States rent data came from an Institute of Real Estate Management (IREM) series (12). This data was collected rent per square foot. The data is taken from the Institute's membership (Certified Property Managers) on a voluntary basis. The figures from 1973 to 1976 represent average rents. From 1977 to 1986 the figures are median rents. For purposes of comparison, the rent per square foot figures were multiplied by 750 square feet to arrive at a rent per unit value. These data
are summarized in Table 6.
CORRELATIONS UNITED STATES
First the study examined the relationship between the rent levels in the entire US and each of the cities in the study. What was found was that there were significant correlations between these. US and Phoenix displayed a correlation coefficient (R) of 0.927. Between Denver rents and US rents the correlation coefficient was 0.936. There was significant correlation between the trends in rent in the two cities studied and the US totals. (See Figure 9) Denver generally had a higher diversification index than did Phoenix. This may be
UNITED STATES RENT DATA SUMMARY YEAR RENT/S.F. 1973 1974 1975 1976 1977 1978 1979 1980 1981 1982 1983 1984 1985 1986 2.34 2.48 2.61 2.78 3.09 3.24 3.58 3.88 4.45 4.83 5.05 5.57 5.55 5.48 (ASSUMES 750 S.F. (1973 TO 1976 are (1977 to 1986 are RENT/UNIT 1,755.00 1,860.00 1,957.50 2,085.00 2,317.50 2,430.00 2,685.00 2,910.00 3,337.50 3,622.50 3,787.50 4,177.50 4,162.50 4,110.00 PER UNIT) average rents) median rents) SOURCE: INSTITUTE OF REAL ESTATE
46 TABLE 6:
FIGURE 9: AVERAGE RENT COLLECTED/UNIT
1981
1982
1983
1984
1985
1986
0TEPHOENIX RENTS
Qw
I-U La -J p 0 UI-z
Id$4,800
$4,700
$4,600
$4,500
$4,400
$4,300
$4,200
$4,100
$4,000
$3,900
$3,800
$3,700
$3,600
$3,500
$3,400
$3,300
$3,200
$3,100
$3,000
$2,900
1980
evidence that the degree of diversification has a direct influence on rent levels. However, further analysis on a sector by sector basis is necessary to evaluate this possibility.
DENVER AND PHOENIX
Looking at rents in Denver and Phoenix over the years 1980 to 1987, it is easy to see the vast differences in performance between the two cities as seen in Figure 10. The biggest differences occurred during 1983, 1984 and 1985. The rest of the time they appeared to perform similarly. In 1983 the growth showed the strongest positive trend in the study period for Phoenix. Denver on the other hand, had almost no growth at all. During 1984, Denver increased rent levels at a good rate and in Phoenix the rent levels dropped slightly. 1985 saw Denver rents dropping quickly while Phoenix rents increased.
CORRELATION BETWEEN RENTS AND THE DIVERSIFICATION INDEX
With respect to the relationship between the diversification index and rents collected per unit, neither Denver nor Phoenix showed a strong relationship. This is consistent with the ideas put forth in the beginning of this study. As Attaran (1) suggested, there was no reason to anticipate the existence of any such correlation. In fact, the respective correlation coefficients were 0.42 for Denver and 0.37 for Phoenix.
FIGURE 10: RENT COLLECTED PER UNIT
1981
1982
1983
1984
1985
1986
+
DENVER RENTS
o
PHOENIX RENTS
0 Id H U