Publisher’s version / Version de l'éditeur:
Vous avez des questions? Nous pouvons vous aider. Pour communiquer directement avec un auteur, consultez la première page de la revue dans laquelle son article a été publié afin de trouver ses coordonnées. Si vous n’arrivez pas à les repérer, communiquez avec nous à [email protected].
Questions? Contact the NRC Publications Archive team at
[email protected]. If you wish to email the authors directly, please see the first page of the publication for their contact information.
https://publications-cnrc.canada.ca/fra/droits
L’accès à ce site Web et l’utilisation de son contenu sont assujettis aux conditions présentées dans le site LISEZ CES CONDITIONS ATTENTIVEMENT AVANT D’UTILISER CE SITE WEB.
Journal of The Electrochemical Society, 167, 13, pp. 1-9, 2020-10-01
READ THESE TERMS AND CONDITIONS CAREFULLY BEFORE USING THIS WEBSITE. https://nrc-publications.canada.ca/eng/copyright
NRC Publications Archive Record / Notice des Archives des publications du CNRC :
https://nrc-publications.canada.ca/eng/view/object/?id=a9b8c86c-4008-421e-8f57-aa608a9c184f
https://publications-cnrc.canada.ca/fra/voir/objet/?id=a9b8c86c-4008-421e-8f57-aa608a9c184f
NRC Publications Archive
Archives des publications du CNRC
This publication could be one of several versions: author’s original, accepted manuscript or the publisher’s version. / La version de cette publication peut être l’une des suivantes : la version prépublication de l’auteur, la version acceptée du manuscrit ou la version de l’éditeur.
For the publisher’s version, please access the DOI link below./ Pour consulter la version de l’éditeur, utilisez le lien DOI ci-dessous.
https://doi.org/10.1149/1945-7111/abbb0d
Access and use of this website and the material on it are subject to the Terms and Conditions set forth at
Electrochemical determination of naloxone using molecularly imprinted
poly(para-phenylenediamine) sensor
Shaabani, Narges; Chan, Nora W. C.; Lee, William Edward; Jemere,
Abebaw B.
Society
OPEN ACCESS
Electrochemical Determination of Naloxone Using Molecularly Imprinted
Poly(para-phenylenediamine) Sensor
To cite this article: Narges Shaabani et al 2020 J. Electrochem. Soc. 167 137508
View the article online for updates and enhancements.
Electrochemical Determination of Naloxone Using Molecularly
Imprinted Poly(para-phenylenediamine) Sensor
Narges Shaabani,
1Nora W. C. Chan,
2William Edward Lee,
2,aand Abebaw B. Jemere
1,z1
Nanotechnology Research Centre, National Research Council Canada, Edmonton, AB T6G 2M9, Canada
2Defence Research and Development Canada - Suffield Research Centre, Medicine Hat, AB T1A 8K6, Canada
A molecularly imprinted polymer (MIP)-based electrochemical sensor featuring an electrochemically grafted para-phenylenedia-mine functional monomer on a reduced graphene oxide-gold nanoparticles composite modified screen printed electrode is reported. The morphology and properties of the sensing material were characterized with microscopy, spectroscopy and electrochemical techniques. A number of factors affecting the performance of the MIP sensor were examined and optimized. Under an optimized condition, the imprinted electrochemical sensor yielded homogenous naloxone binding sites with a dissociation constant of 8.6μM, and responded linearly up to 8μM naloxone, with a limit of detection of 0.16 μM. The sensor showed good run-to-run repeatability and batch-to-batch performance reproducibility with relative standard deviation of 5.7%–9.6% (n = 4) and <9% (n = 3), respectively. The imprinted sensor retained 95% and 85% of its performance when stored at ambient conditions for one and two weeks, respectively, demonstrating the sensor’s good stability. Selectivity experiments showed that both the MIP sensor and non-imprinted polymer electrode had minimal response (<25%) to equal concentrations of structurally similar compounds such as morphine, naltrexone and noroxymorphone, indicating good selectivity of the MIP sensor towards naloxone. The MIP sensor was successfully used to quantify naloxone in artificial urine samples, yielding recoveries greater than 92%.
© 2020 The Author(s). Published on behalf of The Electrochemical Society by IOP Publishing Limited. This is an open access article distributed under the terms of the Creative Commons Attribution Non-Commercial No Derivatives 4.0 License (CC BY-NC-ND,http://creativecommons.org/licenses/by-nc-nd/4.0/), which permits non-commercial reuse, distribution, and reproduction in any medium, provided the original work is not changed in any way and is properly cited. For permission for commercial reuse, please email: [email protected]. [DOI:10.1149/1945-7111/abbb0d]
Manuscript submitted August 4, 2020; revised manuscript received September 21, 2020. Published October 1, 2020.This paper is part of the JES Focus Issue on IMCS 2020.
Supplementary material for this article is availableonline
Naloxone, (5α)-4,5-epoxy,3,14-dihydroxy-17(2-propenyl) mor-phinan-6-one, is a well-established opiate antagonist used for the treatment of opioid/heroin overdose and to ease opioid-induced constipation.1 Various naloxone (NLX) products have been ap-proved worldwide for sublingual, buccal and transmucosal routes injections,1 with each product containing varying naloxone doses. Even though naloxone doesn’t cause physical or psychological dependency, high concentration of naloxone can provoke undesir-able behaviour, increase serum cortisol level and induce cognitive impairment.2,3 Current analytical methods for the measurement of NLX in pharmaceutical drug products and in biofluids are based mainly on liquid chromatography and mass spectrometry.4,5These methods, however, are costly, time consuming, require bulky instrumentation and not appropriate forfield use or point of care. Thus, rapid, sensitive and selective analytical methods for on-site NLX measurement are required.
Electrochemical sensor platforms are attractive due to their simple operation, low cost, low sample volume requirement, speed of analysis, and compactness.6The core of electrochemical sensors is the recognition element which interacts with the specific target analyte. Molecular imprinting is an established and cost-effective approach for making selective binding sites in synthetic polymers using molecular templates,7 and has been successfully utilized to develop sensitive sensor platforms for biological, environmental, pharmaceutical and chemical detections.7–9 MIPs are typically prepared by polymerizing functional monomers in the presence of template molecules. Template removal generates 3D-cavities which are complementary in shape, size and functional groups of the target analyte. The selectivity of MIPs towards the analyte molecules and their recognition mechanisms makes them similar in function to natural biological receptors such as enzymes and antibodies. However, the high chemical and thermal stability of MIPs along with their low cost and ease of synthesis makes them attractive in the field of chemical sensing.
It is well known that the high selectivity of MIP-based electro-chemical sensors is usually compromised by their low sensitivity and high limits of detection.10To improve MIP sensors’ performances, electrode surfaces are usually modified with conducting nanomater-ials, such as carbon nanotubes, graphene and metal nanoparticles, which increase the electrical conductivity and surface area-to-volume ratio of the electrodes.9–16 Here, a composite of gold nanoparticles (AuNPs) and reduced graphene oxide (rGO) was used as a matrix to form the MIP NLX sensor on a screen-printed carbon electrode (SPCE). The rGO-AuNPs composite was synthe-sized in situ in a one-step electrochemical method without the use of external reducing agent or linker molecules on the SPCE.13,17–20
Among the different methods for the synthesis of MIPs,7 electro-polymerization allows the growth of a polymer directly onto the electrode surface and to manipulate the MIP’s thickness, morphology and topography optimal for each template by varying the electric charge applied during polymerization.21–23To the best of our knowledge, there is only one literature report for MIP-based electrochemical sensing of NLX, and that report used electropolymerized para-aminobenzoic acid as the functional monomer.24Here, we used para-phenylenediamine (p-PDA) as the functional monomer to form MIP on rGO-AuNPs/SPCE surfaces, because the−NH2of groups of phenylenediamine can interact with both the template NLX through hydrogen bonding and inter-molecular forces, and the AuNPs via Au-N bonds. Reports have shown that PDA monomers are suitable for MIP preparations yielding compact and rigid polymer films with hydrophilic, hydrophobic and basic recognition sites.22In addition, MIPs of PDAs can be made thin and continuous, a feature required to afford a short response time of chemical sensors.22In the lastfive years, chemically and mechanically stable ultrathin electrosynthesized MIP films of PDA have been prepared on various substrates and applied for sensitive detection of a number of small molecules including drugs,12,25–30 herbicides,31–33 hormone34,35and animal feed additive.36
In this work, we analyzed the function of a p-PDA MIP electro-chemical sensor in the rapid and sensitive measurement of NLX. MIPs were prepared on rGO-AuNPs/SPCE, rGO/SPCE and SPCE surfaces using cyclic voltammetry (CV), and their performance indicated that the AuNP layer could amplify the electrochemical response of the sensor.25 Normalized NLX currents obtained for MIPs prepared on
zE-mail:[email protected]
aPresent address: Platinum Research and Technologies, Medicine Hat, Alberta,
Canada.
rGO-AuNPs/SPCE surface were∼2.8 times higher than those prepared on bare SPCE and∼1.4 times to those prepared on rGO/SPCE. The MIP/rGO-AuNPs/SPCE sensor exhibited recognition of NLX with good stability, reproducibility and selectivity against structurally similar compounds. The sensor was also used to quantify NLX in artificial urine samples, yielding good recovery.
Experimental
Chemicals and materials.—Naloxone (NLX), morphine (MO), naltrexone (NAL), noroxymorphone (NOMO) para-phenylenedia-mine (p-PDA), hydrogen tetrachloroaurate (III) hydrate, potassium ferricyanide, potassium ferrocyanide, hydrochloric acid, methanol and phosphate buffered saline (PBS) tablets were obtained from Sigma-Aldrich (Canada, www.sigmaaldrich.com). Graphene oxide (GO) (4 mg ml−1suspension in water) was purchased from Strem Chemicals (USA, www.strem.com). Deionized (DI) water having a resistivity of 18 MΩ.cm (Milli-Q UV Plus Ultra-Pure Millipore System) was used for aqueous solutions preparation and rinsing electrodes. PBS tablets were dissolved in water to make 10 mM pH 7.0 PBS buffer. Stock solutions of NLX (50 mM) were prepared in water and stored at 4 °C. Daily working solutions of NLX and fresh solutions of p-PDA were prepared in phosphate-citrate buffer (0.1 M, pH 6.0). Bicarbonate buffer (0.1 M, pH 9.2) was prepared by mixing equimolar solutions of sodium carbonate and sodium bicarbonate.
MIP Sensor fabrication.—Scheme 1 shows the step-wise fabrication of the MIP sensor and the NLX detection mechanism. Prior to modification, a bare SPCE (Metrohm Dropsens, www. dropsens.com) was rinsed with water and then activated with 0.1 M HCl by cycling between −0.4 V and +1.5 V at 50 mV s−1 for 20 cycles until a stable cyclic voltammogram was attained. To modify the cleaned SPCE, a suspension containing 1 mg ml−1of GO and 0.5 mM HAuCl4was prepared in 1 ml bicarbonate buffer, and then purged with N2for 1 h to deoxygenate the solution and exfoliate the stacked GO. Electro-codeposition of GO and AuNPs on SPCEs was carried out using CV at a scan rate of 50 mV s−1 in the potential range of−1.6 V to 0.6 V for 20 cycles. An SPCE was also modified under the same electrochemical condition using a suspension of 1 mg ml−1 of GO in 1 ml bicarbonate buffer to form rGO/SPCE. After electrodeposition, the rGO-AuNPs/SPCE and rGO/SPCE surfaces were gently washed with water and dried under N2stream.
MIP was prepared on the surfaces of the rGO-AuNPs/SPCE, rGO/SPCE and bare SPCE using CV. A 200μl aliquot of an MIP reaction solution comprising 5 mM p-PDA and 1 mM NLX in 0.1 M phosphate-citrate buffer wasfirst pipetted onto the modified SPCEs, and the electrodes were then placed in glass cylinder housings and incubated for 1 h in the dark prior to performing CV between −0.20 V to +1.00 V for 15 cycles at a scan rate of 50 mV s−1. A control non-imprinted polymer (NIP)film was also prepared on the rGO-AuNPs/SPCE under the same experimental conditions but with no NLX in the polymerization mixture. After electropolymerization, the MIP modified electrode was first rinsed with water and then conditioned with extraction solution (methanol/0.1 M HCl, 50:50, V/V) for 40 min (by changing the solution every 10 min) at room temperature to extract the embedded NLX molecules. Under the extraction condition, non-covalent bonds between the MIP and NLX may be disrupted allowing the NLX molecules to escape from the imprinted polymer network,24creating cavities that are complemen-tary in shape, size and functionality to the original NLX molecules. To optimize the pH of the electropolymerization buffer, monomer-to-template ratio and number of CV cycles of MIP preparation, 80μl solution of 5 μM NLX prepared in phosphate-citrate buffer was placed at the MIP sensor and incubated for 10 min. The sensor was then washed with water to remove loosely bound NLX and dried with a stream of N2. To the dried sensor, 80μl of PBS was pipetted for the analysis of NLX by differential pulse voltammetry (DPV) by scanning the potential from +0.15 V to +0.5 V using a pulse amplitude of 50 mV, step potential of 5 mV, pulse width of 10 ms and pulse period of 100 ms.
Effects of naloxone extraction and incubation times from the MIP sensor as well as the sensor’s analytical performance were evaluated using freshly prepared NLX solutions. After the imprinted electrodes were incubated in solutions containing different concentrations of NLX for 10 min, the electrodes were rinsed with water and buffer.
DPV measurements were then carried out using 5 mM
K3[Fe(CN)6]/K4[Fe(CN)6] solution, prepared in 0.1 M KNO3, by scanning the potential from−0.2 to 0.3 V using pulse amplitude of 50 mV. Normalized current change (ΔI/I0) of the sensor was employed to characterize the re-binding of NLX to the MIP sensor. I0is the peak current of [Fe(CN)6]
3−/4−measured for the MIP sensor that wasfirst incubated with buffer alone (0 μM NLX) and ΔI is the difference between I0 and the peak current of [Fe(CN)6]
3−/4− measured after the MIP sensor was incubated in NLX solution. All measurements were executed at room temperature. Prior to
electrochemical measurements the solutions were purged with N2for 10 min.
Instruments.—PalmSens potentiostat controlled by PSTrace 5 software (Utrecht, The Netherlands) was used for all electrochemical measurements, using a three-electrode system comprising a modified screen printed carbon electrode (4 mm in diameter) as the working electrode, a Pt counter and a Ag reference electrodes. Differential pulse voltammetry (DPV) experiments were conducted by scanning the potential from−0.2 to +0.3 V, using pulse amplitude of 50 mV, pulse width of 10 ms, and pulse period of 100 ms at room temperature. A solution containing 5 mM K3[Fe(CN)6]/K4[Fe(CN)6] in 0.1 M KNO3 was used a redox probe. The modified electrodes were characterized by scanning electron microscopy (SEM, Hitachi S-4800, Japan) and Raman spectroscopy.
Results and Discussion
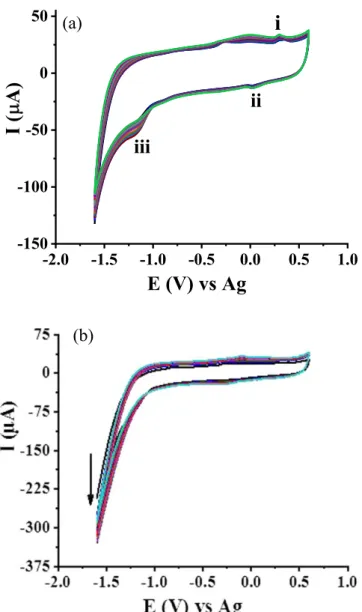
Electrochemical deposition and characterization of the rGO-AuNPs composite.—Figure 1 shows typical CVs of the electro-chemical reduction of GO (rGO) and the co-deposition of rGO-AuNP composite on SPCEs in alkaline bicarbonate buffer.
CV of GO reduction shows one anodic peak (i) and two cathodic peaks
(ii & iii) (see Fig.1a). The constant increase of the cathodic current (peak iii), which is due to the irreversible reduction of GO,18,37,38 with successive potential scan indicates the deposition of conductive GO (i.e. reduction of GO). Peaks i and ii seen in Figs.1a &1b are ascribed to redox pair of oxygen-containing groups (phenolic hydroxyl, carboxylic acid and epoxy groups) on the graphene sheet which are very stable to be reduced.18,37,38The reduction currents for co-deposition of GO and AuNPs on SPCE (Fig. 1b) are remarkably larger than the reduction currents for GO (Fig. 1a) indicating the continuous deposition of Au on the former surface, which is more conductive than rGO alone on the SPCE.
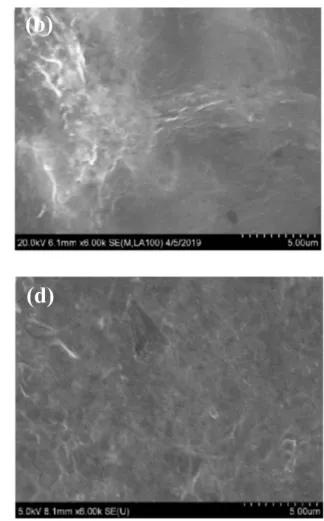
The prepared electrodes were characterized by SEM, Raman spectroscopy and electrochemical techniques. SEM images shown in Figs.2a–2d display clear differences among the morphologies of the bare SPCE and the nanomaterials modified SPCE surfaces. As shown in Fig.2b, the electrodeposition of GO on the SPCE reveals a layer of uniformfilm, presenting flake-like shape and wrinkled texture, which is consistent with literature reports.17,19,20,37The rGO-AuNPs composite modified SPCE (i.e. rGO-AuNPs/SPCE) surface reveals uniform distribution of spherical AuNPs with an average diameter of∼50 nm (Fig.2c). It was noticed that the number of AuNPs is moderately higher at the edge of rGO sheet, which might be due to the more functional groups available at the edge of rGO sheet and the associated higher surface energy (chemical potential).39
Raman spectroscopy analysis was performed to extract the characteristic features of the band gap of the rGO and rGO-AuNPs composite. As shown in Fig.2e, both materials reveal two primary peaks centered at∼1350 cm−1and∼1590 cm−1, which correspond to the D and G bands of graphene, respectively, and a small peak at ∼2690 cm−1 which is assigned to the 2D bands of graphene.40,41 The D, G and 2D bands represent disorder and imperfection of the carbon crystallites, the in-plane vibration of sp2 atoms, and the stacking disorder, respectively.40,41 Compared to the rGO, the G band of rGO-AuNPs composite is slightly shifted from 1,601 cm−1 to 1,606 cm−1, due to the p-doping effect of AuNPs.42,43The ratio of the intensity of the D and G bands (ID/IG), which is widely used to characterize structural disorder in graphitic structures,41 increased from 0.50 for rGO to 0.81 for the rGO-AuNPs composite, indicating the increase in disorder. It is also known that doping of graphene decreases the 2D peak intensity,42,43which was noted in Fig.2e.
Electrochemical characterization of the three electrode materials (bare SPCE, rGO/SPCE and rGO-AuNPs/SPCE) in 0.5 M H2SO4 (Supplementary Fig. S1a is available online atstacks.iop.org/JES/167/ 137508/mmedia) and using 5 mM Fe(CN)6
3−/4− (Supplementary Fig. S1b) also confirms the deposition of rGO and rGO-AuNPs on the SPCEs.
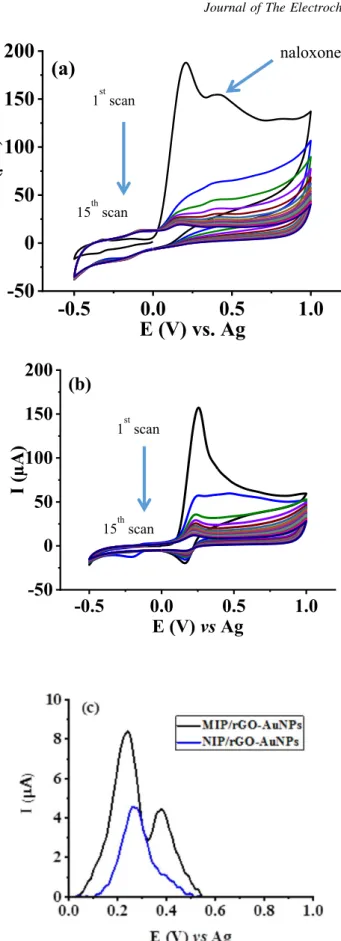
Preparation and characterization of MIP/rGO-AuNPs/SPCE.— CVs of the electropolymerization of p-PDA in the presence and absence of naloxone on AuNP-rGO/SPCEs in phosphate-citrate buffer are shown in Figs.3a and3b, respectively. As seen in the figures, there is an irreversible anodic current peak at∼+0.18 V on the first scans, which is due to the oxidation of p-PDA.44,45 The current rapidly decreases to almost background level on subsequent cycles, indicating the formation of an insulating polymericfilm on the electrodes surfaces blocking access of monomer to the electrode. In the preparation of MIP (Fig. 3a), a slight anodic peak at ∼+0.40 V resulting from NLX oxidation was observed in thefirst scan. In the presence of NLX in the pre-polymerization mixture, the–NH2functional groups of the p-PDA interact with the hydroxyl, carbonyl, tertiary amine and ether groups of NLX to form imprinted cavities with which the analyte molecules are anticipated to bind via π-π interactions and hydrogen bonding. Figure 3b shows that in the preparation of a control non-imprinted polymer (NIP), no peak at ∼+0.40 V was observed. These results suggest that under these conditions successful electropolymerization of Figure 1. CV curves for the electrodeposition of (a) 1 mg ml−1 rGO,
(b) 1 mg ml−1rGO and 0.5 mM HAuCl4 in bicarbonate buffer at a scan
rate of 50 mV s−1.
p-PDA entrapping NLX was achieved. The MIP and NIP modified rGo-AuNPs/SPCEs were characterized by DPV, CV and SEM.
Figure3c shows DPV of the as-prepared MIP (prior to template removal) and NIP modified rGO-AuNPs/SPCEs. Two distinct peaks corresponding to the polymerfilm (at ∼+0.24 V) and oxidation of NLX (at +0.38 V) were observed for the MIP/rGO-AuNPS/SPCE surface preparation, whereas only a single peak at∼+0.27 V was observed for the NIP/rGO-AuNPs/SPCE. These observations in-dicate successful entrapment of NLX in the MIP/rGO-AuNPs/SPCE. From the DPV voltammograms, a small shift (∼0.03 V) to the
polymer peak potential was observed between the MIP and NIP modified electrodes, indicating that the oxidation of the polymer in the MIP required slightly more energy. This could be attributed to attractive interactions between the electroactive molecules of NLX and the polymer in the MIP. Supplementary Fig. S2 shows CVs the MIP/rGO-AuNPs/SPCE and NIP/rGO-AuNPs/SPCE using 5 mM Fe(CN)63−/4− in 0.1 M KNO3 after the removal of NLX template molecules using the extraction solution. The rGO-AuNPs/SPCE surface produced well-defined redox peaks (curve a) that are characteristic of the redox probe. The NIP modified electrode showed Figure 2. SEM images of the (a) bare SPCE, (b) rGO/SPCE, (c) rGO-AuNPs/SPCE, (d) MIP/rGO-AuNPs/SPCE. (e) Raman spectra of rGO-AuNPs/SPCE and MIP/rGO-AuNPs/SPCE.
almost no redox currents (curve b) compared to the unmodified rGO-AuNPs/SPCE surface because the electrochemically insulating polymer hindered transfer of electron between the redox probe and the
electrode surface. However, the MIP modified rGO-AuNPs/SPCE surface showed a pair of redox peaks (curve c), suggesting cavities were formed in the MIPfilm after the extraction of template NLX molecules which promotes the diffusion of the redox probe to the electrode surface.
From the SEM image shown in Fig.2d, it is evident that the gold nanoparticles that were clearly visible in the rGO-AuNPs/SPCE surface (Fig. 2c) are now covered with polymer layer, providing further evidence to the electropolymerization of p-PDA on the rGO-AuNPs/SPCE.
The performance and ability of the MIP/rGO-AuNPs/SCPE sensor for NLX measurement was compared to that of MIP/SPCE, MIP/rGO/SPCE sensors and the control non-imprinted surface (NIP/ rGO-AuNPs/SPCE), where MIP and NIP were prepared using the optimized conditions discussed below. Figure4shows the normal-ized current of the MIP/rGO-AuNPs/SPCE sensor for 5μM NLX is higher than the normalized current of the other modified surfaces (∼1.6 times that of MIP/rGO/SPCE, ∼2.5 times that of MIP/SPCE and 5.5 times that of the NIP). The imprinting factor, which is calculated asΔIMIP/rGO-AuNPs/SCPE/ΔINIP/rGO-AuNPs/SCPEwhereΔI is the difference between the DPV currents obtained in the absence and presence of NLX, was calculated to be 19.5, indicating that there were a large number of binding sites on the MIP/rGO-AuNPs/SPCE which would allow the sensor to adsorb more target analyte molecules. These results demonstrate that the unique electrical property of the rGO-AuNPs composite and the increased surface area of the modified electrode rendered by the composite were effective to promote, recognize and accumulate NLX molecules through the MIPfilm. Thus, the MIP/rGO-AuNPs modified elec-trode was utilized as the sensor for NLX detection.
Optimization of MIP sensor preparation conditions.—In order to fabricate an efficient sensor, thorough investigations were made on the effects of various influencing parameters such as the molar ratio of template-to-monomer molecules, pH of the electropolymer-ization supporting electrolyte, electropolymerelectropolymer-ization scan cycles, template extraction conditions and incubation time.
Effect of monomer to template concentration ratio.—The molar ratios of template to functional monomer in the pre-polymerization mixtures influence the number of imprinted cavities in MIP, which affects the rebinding and recognition capability of the sensor.7 To investigate the effect of p-PDA concentration on the response of the MIP sensor towards NLX, pre-polymerization solutions composed of NLX-to-p-PDA molar ratios of 1:2, 1:4, 1:5, 1:8, and 1:10 were prepared and electrochemically polymerized on rGO-AuNPs/SPCEs. As shown in Fig.5a, the sensor response to NLX initially increased with increasing the proportion of the monomer, reaching a maximum at 1:5 molar ratio. The MIP sensor response decreased with further increasing the molar ratio of the monomer in the pre-polymerization mixture, which might be due to an increase in the MIP thickness and an ensuing reduction in the conductivity of the MIP layer. Thus, the molar ratio of the template-to-monomer was set as 1:5 for further experiments. Effect of number of cycles of polymerization.—The number of cycles used in the electropolymerization process can influence the thickness of the MIP layer, thereby the sensors’ performance.8,22 Thus, different MIP/rGO-AuNPs/SPCEs were prepared from pre-polymerization solutions composed of 1 mM NLX and 5 mM p-PDA (1:5 molar ratio) with electropolymerization cycles ranging from 3 to 20. Figure 5b shows that the DPV current response of the MIP sensor increased with the number of scan cycles, reaching a maximum at 15 cycles. Increasing the cycle number beyond 15 resulted in decreased NLX oxidation current. This is ascribed to the resulting thick polymer films impeding the oxidation of NLX molecules trapped near the polymer surface. Thick polymer films would also cause slow mass transfer of the analyte upon incubation with the MIP sensor, and prolong the NLX extraction time. Hence, 15 cycles was chosen as optimal to produce the MIP sensor. Figure 3. Electropolymerization of (a) MIP from a solution containing 5 mM
p-PDA and 1 mM NLX in phosphate-citrate buffer, (b) NIP from a solution containing 5 mM p-PDA in phosphate-citrate buffer, and (c) DPV voltammo-grams of MIP and NIP modified rGO-AuNPs/SPCE in phosphate buffer.
Effect of pH in MIP preparation.—The pH of the polymerization solution affects the structure and function of the imprinted polymer as well as the rebinding of the template molecules. In order to examine the effect of pH on sensor performance, MIPs were prepared from solutions consisting of 0.1 M phosphate-citrate buffer in the pH range of 4–9. Following template removal using extraction solution, the sensors were incubated with 5μM NLX for 10 min, and the resulting NLX oxidation peaks were recorded and compared. Figure5c shows maximum DPV peak current was obtained for MIPs prepared using a pH 6.0 buffer. NLX, pI 8.55,46 exists in four tautomeric forms in solution. At pH 6, the cationic form predomi-nates, which may lead to strong electrostatic and other non-covalent interactions between the functional monomer and NLX. This pH was selected for further experiments.
Effect of extraction and incubation time.—Complete extraction of entrapped template molecules from imprinted polymer is critical for MIP sensors’ performance and to be able to regenerate the sensor after each measurement. Solvent extraction is the most common and effective method of template removal in the development of MIP sensors.9Here, an extraction solution of MeOH/0.1 M HCl (50/50, v/v) was used to remove template NLX molecules and reuse the MIP sensor as reported by Lopes et al.24Extraction time was optimized by soaking MIP sensors in the extraction solution for various times, and measuring the DPV signal of 5 mM [Fe(CN)6]3−/4− in the resulting surfaces. Supplementary Fig. S3a shows an optimal extraction time of 10 min for the p-PDA MIP network.
The relationship between the sensor current response and the rebinding time of NLX was also studied by incubating the imprinted polymer sensor (after template removal) in 50 μM NLX solution prepared in PBS. DPV signal of 5 mM [Fe(CN)6]3−/4− in the resulting surfaces were recorded and shown in Supplementary Fig. S3b. Thefigure shows that the current decreased rapidly with the increase in the incubation time, reaching a plateau at 10 min suggesting that adsorption equilibrium was reached and the uptake was rapid. Therefore, an incubation time of 10 min was used for further studies. This time is significantly shorter than what has been reported (40 min) for an MIP NLX sensor using para-aminobenzoic acid.24
Analytical performance of the MIP sensor.—The performance of the imprinted sensor for the determination of NLX was investigated using DPV of [Fe(CN)6]3−/4− under the optimized experimental conditions. NLX binding to the MIP-modified elec-trode reduces the permeability of the redox probe, and this effect was used to measure the analyte concentration.9After template removal and background current measurements, MIP sensors were incubated
in different concentrations of NLX for 10 min. The inset in Fig.6 shows the [Fe(CN)6]3−/4−current decreased with increasing NLX concentration, implying that higher number of imprinted sites were Figure 4. The normalized current of 5μM of NLX on MIP/rGO-AuNPs/
SPCE, NIP/rGO-AuNPs/SPCE, MIP/rGO/SPCE, and MIP/SPCE. Error bars represent standard deviation of three independent measurements.
Figure 5. Variation of DPV peak current of NLX as a function of (a) mole ratios of NLX to p-PDA, (b) number of electropolymerization cycles, and (c) pH of the pre-polymerization solution. Three independent electrodes were processed for the acquisition of each data point. Where not visible, error bars are smaller than the symbols.
occupied by the target NLX molecules and generated a higher degree of blocking of the redox probe from the electrode surface. The plot of the normalized current of the MIP sensor vs the concentration of NLX is given in Fig.6. Each data point represents an average value obtained from three independent MIP sensors prepared and pro-cessed in parallel, with error bars showing the standard deviation of the three measurements. The binding isotherm shown in Fig.6is not a straight line rather it presents saturation behaviour at higher NLX concentration. This implies the binding of NLX to the MIP sensor takes place according to Langmuir or bi-Langmuir model.47,48This was confirmed by a good theoretical fit to the Langmuir isotherm equation, with a correlation coefficient (R2) of 0.9916. This suggests that the fabricated MIP cavities are structurally homogeneous and the binding sites are energetically equivalent. From the fit, we calculated the maximum signal (ΔI/Io) at saturation to be 0.983 and a dissociation constant (Kd) of 8.6μM. The corresponding Scatchard plot (Supplementary Fig. S4) of the data presented in Fig. 6also yielded a straight line with R2 of 0.9351, indicating homogenous binding sites on the MIP surface. These observations are consistent with the conclusion drawn from the data presented in Fig.4, where the contribution of nonspecific interaction in the NIP accounted to
only 5% of the total signal recorded for the MIP sensor. According to equilibrium binding kinetics the low concentration range of the binding isotherm is predicted to be approximately linear; the linear regression (0–3 μM) yielded ΔI/Io= 0.0904 C + 0.00787 (R2= 0.9999). The limit of detection (LOD) the MIP/rGO-AuNPs/SPCE sensor, calculated as 3σ/slope (σ is the standard deviation for the lowest concentration in the calibration plot), was 0.16 μM. This LOD is slightly lower than the recently reported value (0.20μM) for NLX electrochemical sensor,24but higher by an order of magnitude than obtained for HPLC-UV (0.03 μM49 and 0.24 μM50) and HPLC-MS.5 The concentrations of NLX in injectable and non-injectable formulations that are being distributed in North America since 2006 to treat opioid overdose are in the range of 0.4 mg ml−1 to 1 mg ml−1(1.2 mM–3.0 mM).1Since NLX shows low bioavail-ability after sublingual or oral administration, appreciably raised levels of NLX may not be routinely observed in urine samples. In a study published in 2020, Warrington et al.51 reported an average NLX level of 633.65 ng ml−1(1.9μM) was found during urine drug test for patients of opioid use disorder. Thus, the development of such a sensor that can detect sub-micro molar (ng ml−1) concentra-tion of NLX will prove advantageous in both pharmaceutical dosage and urine sample analysis.
The selectivity of the MIP/rGO-AuNPs/SPCE sensor towards NLX was evaluated against structural analogue compounds of naltrexone (NAL), noroxymorphone (NOMO) and morphine (MO) (their structures are given in Supplementary Fig. S5) prepared individually at concentrations of 5μM. The selectivity of the sensor was evaluated from the ratio of the normalized signal of the sensor to NLX and to the interfering compounds from the data shown in Fig.7. This ratio slightly varied from 4 to 5.5, demonstrating that the MIP/rGO-AuNPs/SPCE sensor has higher recognition selectivity to NLX than for the interfering compounds. The NIP/rGO-AuNPs/ SPCE showed no significant differences among all the compounds including NLX. The MIP sensor reported in Ref. 20, yielded 40%–55% signal for NOR and NAL, while our sensor gave only ∼18% response for these compounds, demonstrating the better selectivity of our sensor. The selectivity of the MIP sensor towards NLX could be ascribed to the complementary cavities created in the imprinted polymer matrix which match the structure of NLX sterically and via molecular interactions between the functional groups in the polymer and template molecules.
To examine the stability of the imprinted electrode, MIP/rGO-AuNPs/SPCE was stored at room temperature for a period of time Figure 6. The calibration plots for different concentration of NLX on MIP/rGO-AuNP/SPCE sensor (n = 3) and the DPV curves using 5 mM K3[Fe(CN)6]/K4[Fe(CN)6], 0.1 M KNO3. The blue line represents the bestfit for a non-linear regression of a single binding site Langmuir isotherm.
Figure 7.The normalized current of MIP and NIP modified rGO-AuNPs/ SPCE sensors towards 5μM NLX, MO, NAL and NOMO. Error bars represent standard deviation of three independent measurements.
before use. The normalized current of the sensor decreased to 94.9% and 84.7% after one and two weeks of storage, respectively, compared to its initial response, demonstrating stability. Sensor’s performance repeatability was also investigated by detecting NLX at four different concentrations (1μM, 5 μM, 8 μM and 10 μM) in triplicates using the same sensor. Relative standard deviations (RSD) of 5.7%–9.6% were obtained, revealing that the MIP sensor possesses good repeatability.
Detection of NLX in urine samples.—The MIP NLX sensor was tested with artificial urine samples to demonstrate its applicability in complex biological media. In analytical measurements, a commonly used and effective method to overcome matrix effects is standard addition, where known quantities of the analyte (in this case, NLX) are added to the solution of interest (in this case, urine with an “unknown” concentration of NLX) and the sensor’s analytical signal is measured in response to each addition. Artificial urine (composition shown in supplementary Table SI) with no NLX wasfirst diluted (1:1, v/v) with PBS and spiked with 3μM and 8 μM NLX. The spiked artificial urine samples were then centrifuged for 15 min at a speed of 10,000 rmp and the resulting supernatants were incubated with the MIP sensor and analysed. Calculated recoveries, using the equation from the calibration plot shown in Fig.6, of 97.0% and 92.7%, with % RSD of 8.1% and 9.2%, respectively, were obtained for the 3μM and 8μM NLX spiked samples. These results demonstrate the reliability and accuracy of the MIP/rGO-AuNPs/SPCE sensor for rapid and easy determination of NLX in complex bodilyfluid.
Conclusions
This report demonstrates the development of a MIP-based electrochemical sensor for NLX measurement by electropolymerizing p-PDA on the surface of rGO-AuNPs modified SPCE. The introduc-tion of rGO-AuNPs composite on the electrode surface significantly improved the MIP sensor’s performance, which may be ascribed to the increase in the conductive surface area of the electrode leading to enhanced electron transport and increased number of NLX immobi-lization sites per unit surface area. The MIP/rGO-AuNPs/SPCE showed a detection limit similar to the only reported MIP NLX sensor, good run-to-run measurement and batch-to-batch fabrication repeatability, and was stable for at least 2 weeks of dry storage. Unlike the sensor previously reported, where the sensor’s response to NLX was linear, the sensor reported here followed a Langmuir binding-isotherm. This allowed us to estimate the dissociation constant between the MIP and NLX to be 8.6 μM. The developed sensor also demonstrated excellent selectivity against structurally similar compounds (MO, NAL and NOMO), and was not affected by matrices present in urine. The previously reported MIP sensor yielded 40%–55% signal for NOMO and NAL, while our sensor gave only ∼18% response for these compounds, which is an advantage. The high recovery (>92%) rate of the MIP sensor in synthetic urine sample suggests that the sensor has excellent degree of accuracy and could be suitable for measuring NLX in complex biological samples.
Acknowledgments
The authors would like to acknowledge the support from NRC-Nanotechnology Research Centre and Defence Research and Development Canada—Suffield Research Centre.
ORCID
Abebaw B. Jemere https://orcid.org/0000-0002-8205-7304 References
1. J. Strang, R. McDonald, G. Campbell, L. Degenhardt, S. Nielsen, A. Ritter, and O. Dale,Drugs, 79, 1395 (2019).
2. M. R. Cohen, R. M. Cohen, D. Pickar, H. Weingartner, D. L. Murphy, and W. E. Bunney Jr.,Lancet, 2, 1110 (1981).
3. A. F. Martin de Campo, R. G. McMurray, and G. M. Besser,Biol. Psychiatry, 32, 344 (1992).
4. W. B. Fang, Y. Chang, E. F. McCance-Katz, and D. E. Moody,J. Anal. Toxicol., 33, 409 (2009).
5. M. J. Swortwood, K. B. Scheidweiler, A. J. Barnes, L. M. Jansson, and M. A. Huestis,J. Chromatogr. A, 1446, 70 (2016).
6. D. W. Kimmel, G. LeBlanc, M. E. Meschievitz, and D. E. Cliffel,Anal. Chem., 84, 685 (2012).
7. J. J. BelBruno,Chem. Rev., 119, 94 (2019).
8. R. Gui, H. Jin, H. Guo, and Z. Wan,Biosens. Bioelectron., 100, 56 (2018). 9. O. S. Ahmad, T. S. Bedwell, C. Esen, A. Garcia-Cruz, and S. A. Piletsky,Trends
Biotechnol., 37, 294 (2019).
10. P. S. Sharma, M. Dabrowski, F. D’Souza, and W. Kutner,Trends Anal.Chem., 51, 146 (2013).
11. R. Li, Y. Feng, G. Pan, and L. Liu,Sensors (Basel), 19, 177 (2019).
12. X. Tan, Q. Hu, J. Wu, X. Li, P. Li, H. Yu, X. Li, and F. Lei,Sens. Actuator. B: Chemical, 220, 216 (2015).
13. M. A. Belumonini, J. L. da Silva, G. C. Sedenho, and N. R. Stradiotto,Talanta, 165, 231 (2017).
14. J. Li, X. Ma, M. Zhang, D. Li, Y. Yuan, Y. Fan, X. Xie, L. Guo, and G. Zeng, J. Electrochem. Soc., 166, B84 (2019).
15. M. Maria Coroş, S. Pruneanu, and R. I. Stefan-van Staden,J. Electrochem. Soc., 167, 037528 (2020).
16. A. K. Yagati, J. Min, and S. Cho,J. Electrochem. Soc., 161, G133 (2014). 17. J. Kumarasamy, M. B. Camarada, D. Venkatraman, H. Ju, R. S. Dey, and Y. Wen,
Nanoscale, 10, 1196 (2018).
18. C. Liu, K. Wang, S. Luo, Y. Tang, and L. Chen,Small, 7, 1203 (2011). 19. S. Singh, S. K. Tuteja, D. Sillu, A. Deep, and C. R. Suri,Microchim. Acta, 183,
1729 (2016).
20. Y. Xu, W. Zhang, J. Shi, X. Zou, Y. Li, H. E. Tahir, X. Huang, Z. Li, X. Zhai, and X. Hu,Food Chem., 237, 423 (2017).
21. J. Wackerlig and R. Schirhagl,Anal. Chem., 88, 250 (2016).
22. P. S. Sharma, A. Pietrzyk-Le, F. D’Souza, and W. Kutner,Anal. Bioanal. Chem., 402, 3177 (2012).
23. B. Sun, C. Wang, J. Cai, D. Li, W. Li, X. Gou, Y. Gou, and F. Hu,J. Electrochem. Soc., 166, H187 (2019).
24. F. Lopes, J. G. Pacheco, P. Rebelo, and C. Delerue-Matos,Sensors Actuators, B Chem., 243, 745 (2017).
25. X. Zhang, Y. Peng, J. Bai, B. Ning, S. Sun, X. Hong, Y. Liu, Y. Liu, and Z. Gao, Sens. Actuator. B:Chemical, 200, 69 (2014).
26. A. G. Ayankojo, J. Reut, R. Boroznjak, A. Opik, and V. Syritski,Sens. Actuator. B: Chemical, 258, 766 (2018).
27. K. Kor and K. Zarei,Talanta, 146, 181 (2015).
28. T. Li, T. Yao, C. Zhang, G. Liu, Y. She, M. Jin, F. Jin, S. Wang, H. Shao, and J. Wang,RSC Adv., 6, 66949 (2018).
29. T.-X. Chu, V.-P. Vu, H.-T. Tran, T.-L. Tran, Q.-T. Tran, and T.-L. Manh, J. Electrochem. Soc., 167, 027527 (2020).
30. A. Afkhami, F. Gomar, and T. Madrakian,J. Electrochem. Soc., 162, B109 (2015). 31. R. Elshafey and A.-E. Radi,J. Electroanal. Chem., 813, 171 (2018).
32. X. Li, Y. He, F. Zhao, W. Zhang, and Z. Ye,RSC Adv., 5, 56534 (2015). 33. B. Öndes and M. Soysal,J. Electrochem. Soc., 166, B395 (2019).
34. W. Liu, Y. Ma, G. Sun, S. Wang, J. Deng, and H. Wei,Biosens. Bioelectron., 92, 305 (2017).
35. P. Manickam, F. Arizaleta, M. Gurusamy, and S. Bhansali,J. Electrochem. Soc., 164, B3077 (2017).
36. L. Chen, A. Xiaoyan Wang, A. Wenhui Lu, X. Wu, and J. Li,Chem. Soc. Rev., 45, 2137 (2016).
37. G. Zhao and G. Liu,Nanomaterials (Basel, Switzerland), 9, 41 (2018). 38. L. Chen, Y. Tang, K. Wang, C. Liu, and S. Luo,Electrochem. Commun., 13, 133
(2011).
39. X. Dong, W. Huang, and P. Chen,Nanoscale Res. Lett., 6, 60 (2011).
40. D. Graf, F. Molitor, K. Ensslin, C. Stampfer, A. Jungen, C. Hierold, and L. Wirtz, Nano Lett., 7, 238 (2007).
41. B. Tang, H. Guoxin, and H. Gao,Appl. Spectrosc. Rev., 45, 369 (2010). 42. I. Khalil, N. M. Julkapli, W. A. Yehye, W. J. Basirun, and S. K. Bhargava,
Materials (Basel), 9, 406401-438 (2016). 43. A. Das et al.,Nature Nanotech, 3, 210 (2008).
44. B. Lakard, G. Herlem, S. Lakard, and B. Fahys,J. Mol. Struct. (Theochem), 638, 177 (2003).
45. S. M. Sayyah, S. S. Abd El-Rehim, M. M. El-Deeb, S. M. Kamal, and R. E. Azooz, J. Appl. Polym. Sci., 638, 177 (2010).
46. K. Mazak, B. Norszal, and S. Hostztafi,ChemistryOpen, 8, 879 (2019). 47. S. Nishitani and T. Sakata,ACS Omega, 3, 5382 (2018).
48. M. Pesavento, S. Marchetti, L. De Maria, L. Zeni, and N. Cennamo,Sensors, 19, 13441341-1318 (2019).
49. A. Mostafavi, G. Abedi, A. Jamshidi, D. Afzali, and M. Talebi,Talanta, 77, 1415 (2009).
50. K. Pathy,Sch. J. Food Nutr., 1, 17 (2018).
51. J. S. Warrington, K. Booth, G. S. Warrington, and S. Francis-Fath,Addict. Sci. Clin. Pract., 15, 3 (2020).