Publisher’s version / Version de l'éditeur:
ASHRAE Transactions, 90, 1B, pp. 83-93, 1984
READ THESE TERMS AND CONDITIONS CAREFULLY BEFORE USING THIS WEBSITE. https://nrc-publications.canada.ca/eng/copyright
Vous avez des questions? Nous pouvons vous aider. Pour communiquer directement avec un auteur, consultez la première page de la revue dans laquelle son article a été publié afin de trouver ses coordonnées. Si vous n’arrivez pas à les repérer, communiquez avec nous à PublicationsArchive-ArchivesPublications@nrc-cnrc.gc.ca.
Questions? Contact the NRC Publications Archive team at
PublicationsArchive-ArchivesPublications@nrc-cnrc.gc.ca. If you wish to email the authors directly, please see the first page of the publication for their contact information.
NRC Publications Archive
Archives des publications du CNRC
This publication could be one of several versions: author’s original, accepted manuscript or the publisher’s version. / La version de cette publication peut être l’une des suivantes : la version prépublication de l’auteur, la version acceptée du manuscrit ou la version de l’éditeur.
Access and use of this website and the material on it are subject to the Terms and Conditions set forth at
A Statistical study of the thermal performance of a group of 1478
houses on the Canadian prairies
Hedlin, C. P.; Bantle, M.
https://publications-cnrc.canada.ca/fra/droits
L’accès à ce site Web et l’utilisation de son contenu sont assujettis aux conditions présentées dans le site LISEZ CES CONDITIONS ATTENTIVEMENT AVANT D’UTILISER CE SITE WEB.
NRC Publications Record / Notice d'Archives des publications de CNRC:
https://nrc-publications.canada.ca/eng/view/object/?id=3618a6e9-e49e-4c0b-b474-f83115083675 https://publications-cnrc.canada.ca/fra/voir/objet/?id=3618a6e9-e49e-4c0b-b474-f83115083675-
Ser
ITHl I
N21
d
National Research
Conseil national
no'
c.
1253
21
+
Council Canada
de recherches Canada
-
1
I
A STATISTICAL STUDY OF THE THERMAL PERFORMANCE
OF A GROUP OF 1478 HOUSES ON THE CANADIAN PRAIRIES
by
C.P. Hedlin and M. Bantle
Reprinted from
ASHRAE Transactions
Vol. 90, 1984, Part 1B
p.8 3
-
93
DBR Paper No. 1253
Division of Building Research
On a recueilli des donnges sur la consommation de gaz nature1
et d161ectricit6,
les dimensions, 1'8ge et le style de 1
478
maisons situ6es
3
R6gina.
On a kgalement 6tabli pour chaque maison, l'intersection de la
pente des deux axes de la consommation de gaz et d161ectricit6
et du nombre de degr6s-jours de chauffage.
Des calculs ont &tg effectu6s afin de mesurer les &arts de
consommation d'energie pour diffgrentes caractgristiques de
maisons.
Les variations dans les courbes repr6sentant la
consommation de gaz par rapport aux degrgs-jours de chauffage
ont ggalement 6t6 analysges. On a constat6 que ces variations
6taient fonction de la dimension des maisons et qu'elles se
retrouvaient parmi plusieurs groupes de maisoas apparemment
identiques.
No. 1
A Statistical Study of the Thermal
Performance of a Group of 1478 Houses
on the Canadian Prairies
C.P. Hedlin,
Ph.D.
M. Bantle
ASHRAE Member
ABSTRACT
Information about t h e n a t u r a l gas and e l e c t r i c i t y consumption, s i z e , age, and s t y l e of c o n s t r u c t i o n was o b t a i n e d f o r 1,478 houses i n t h e c i t y of Regina.
Slope-intercept r e l a t i o n s h i p s between n a t u r a l gas consumption and e l e c t r i c i t y consumption v e r s u s h e a t i n g d e g r e e d a y s were determined f o r each house.
C a l c u l a t i o n s were made t o f i n d t h e v a r i a t i o n of energy consumption w i t h s e v e r a l house c h a r a c t e r i s t i c s . The v a r i a t i o n i n t h e s l o p e s of t h e n a t u r a l g a s consumption v e r s u s h e a t i n g degree-days was a l s o s t u d i e d . V a r i a t i o n s w i t h house s i z e , and w i t h i n s e v e r a l groups of nominally i d e n t i c a l houses, were found.
INTRODUCTION
For houses on t h e Canadian p r a i r i e s , a major p a r t of t h e purchased energy shows up a s s p a c e h e a t t h a t i s needed t o balance h e a t l o s s through w a l l s , windows, r o o f s , and f l o o r s d u r i n g t h e h e a t i n g season. Some of t h i s comes a s t h e by-product of l i g h t i n g , cooking, domestic water h e a t i n g , and t h e u s e of r e f r i g e r a t o r s o r f r e e z e r s . A major p a r t of i t i s provided by t h e furnace s p e c i f i c a l l y f o r space heating. I n a d d i t i o n t o t h a t obtained from purchased energy, h e a t a l s o csmes from occupants and from t h e sun.
I n any given house, such f a c t o r s a s occupancy l e v e l s and l i f e - s t y l e a f f e c t energy consumption f o r s p a c e heating; however, t h e s i z e of t h e house and i t s h e a t - l o s s
c h a r a c t e r i s t i c s a r e t h e main f a c t o r s a f f e c t i n g s p a c e - h e a t i n g needs.
Laboratory measurements of t h e thermal p r o p e r t i e s of components, combined w i t h c a l c . u l a t i o n procedures, a r e s t a n d a r d methods of a r r i v i n g a t h e a t - l o s s e s t i m a t e s . I n some c a s e s , measuring instruments can be employed t o g a i n information. However, t h e time and effocrt r e q u i r e d l i m i t t h e number of houses t h a t can be studied.
Information obtained by d e t a i l e d l a b o r a t o r y and f i e l d instrument measurements can b e complemented, extended, and, i n some c a s e s , i t s v a l i d i t y t e s t e d , simply by u s i n g t h e measured energy consumptions (Mayer and Robinson 1975; Hedlin and O r r 1977; Sonderegger 1977178; Schrader 1978). These v a l u e s , a s measured by u t i l i t y companies, may cover a l l of t h e
purchased energy, u n l e s s f i r e p l a c e s o r woodburning s t o v e s a r e used. The i n t e r a c t i o n of many f a c t o r s means t h a t i t i s d i f f i c u l t t o i d e n t i f y some s p e c i f i c e f f e c t s ; t h e l i m i t a t i o n s of s u c h
C.P. Hedlin, Head, P r a i r i e Regional S t a t i o n , D i v i s i o n of B u i l d i n g Research, N a t i o n a l Research Council Canada, Saskatoon, Saskatchewan.
a n a l y s e s must be recognized, and they should n o t b e expected t o r e v e a l information about e f f e c t s t h a t a r e t o o h e a v i l y masked t o be i d e n t i f i a b l e .
Analyses based on purchased energy might be divided i n t o two c a t e g o r i e s : t h o s e i n v o l v i n g i n d i v i d u a l houses and t h o s e i n v o l v i n g groups of houses. The p r e s e n t study f a l l s i n t o t h e l a t t e r category. The analyses a r e s t a t i s t i c a l and, a s a r e s u l t , t h e conclusions a r e drawn f o r populations of houses and a r e expressed i n terms of p r o b a b i l i t y r a t h e r t h a n i n t h e p r e c i s e numbers o f t e n a s s o c i a t e d with h e a t balance e s t i m a t e s f o r i n d i v i d u a l houses.
I This study involves d a t a from houses i n which n a t u r a l gas i s used f o r space h e a t i n g and,
normally, f o r domestic water h e a t i n g , and e l e c t r i c i t y i s used f o r a l l o t h e r energy needs. Natural gas and e l e c t r i c a l consumption d a t a were provided by a Saskatchewan u t i l i t y company f o r 1,478 homes i n t h e c i t y of Regina w i t h i n t h e p e r i o d 1969-77. Information about t h e s i z e and shape, and some c o n s t r u c t i o n d e t a i l s f o r t h e s e homes, w a s provided by t h e C i t y of Regina Assessor's Off ice.
The year of c o n s t r u c t i o n ranges from 1911 t o 1973; main f l o o r a r e a (MFA) ranged from about 33 m2 t o 156 m2, t o t a l f l o o r a r e a of t h e h e a t e d s p a c e (TFA) from 50 m 2 t o 430 m2, and h e i g h t from one t o two and one-half s t o r i e s . Most of t h e houses had f u l l basements, but some had only p a r t i a l basements o r none a t a l l . Those w i t h no basement were b u i l t o v e r crawl- spaces o r were slab-on-grade homes.
I n s u l a t i o n l e v e l s varied. Before 1930 most houses were b u i l t with no i n s u l a t i o n , although i t would have been added t o many of them l a t e r . Those b u i l t between 1945 and 1973 would i n i t i a l l y have had no basement i n s u l a t i o n ; w a l l s would normally have R7
-
R10i n s u l a t i o n b u i l t i n t o them, and approximately R10 i n s u l a t i o n would have been placed i n c e i l i n g s .
A v a r i e t y of q u e s t i o n s could have been addressed u s i n g t h i s body of information; t h r e e were s e l e c t e d :
1. The e f f e c t of s e v e r a l v a r i a b l e s on energy consumption.
2. The n a t u r e of t h e s l o p e of t h e n a t u r a l g a s consumption v e r s u s h e a t i n g d e g r e e d a y r e l a t i o n s h i p a s a space-heating c h a r a c t e r i s t i c f o r houses.
3. The v a r i a t i o n i n t h e n a t u r a l g a s v e r s u s h e a t i n g d e g r e e d a y s l o p e w i t h i n groups of nominally i d e n t i c a l houses.
Discussion of t h e above t o p i c s i s preceded by a b r i e f d e s c r i p t i o n of heat-balance r e l a t i o n s h i p s and t h e n a t u r e of t h e d a t a used i n t h e analyses.
HEXT BALANCE RELATIONSHIPS
Fuel consumption v a r i e s w i t h t h e weather. I n t h i s study, h e a t i n g degree-days a r e used t o r e p r e s e n t t h e weather v a r i a b l e . In some c a s e s i t i s expressed i n terms of temperature (T):
where DD/day i s t h e average number of degree-dayslday f o r t h e period of o b s e r v a t i o n (one o r more days). T i s e q u a l t o t h e outdoor temperature (Ta) except f o r p e r i o d s t h a t i n c l u d e days having mean temperatures g r e a t e r than 18OC. For values of T below lS°C, t h e d i f f e r e n c e between T and Ta averages less t h a n O.S°C ( f i g u r e 1).
The h e a t e q u i v a l e n t of t h e f u e l consumption (EG) can be expressed:
The h e a t e q u i v a l e n t of t h e n a t u r a l g a s i s assumed t o be 37.3 M J / m 3 (1000 B t u / f t 3 ) . I and SG a r e t h e o r d i n a t e i n t e r c e p t (MJ/day) and s l o p e (W/DD) r e s p e c t i v e l y . The s u b s c r i p t G fs used t o denote n a t u r a l gas.
One would not expect a s c l o s e a r e l a t i o n s h i p between e l e c t r i c a l consumption and T; however,
s i n c e t h e use of l i g h t i n g and c a r block h e a t e r s increases i n cold weather, EE i s somewhat
dependent on T.
Between 20 and 50 values of natural. gas consumption were a v a i l a b l e f o r each house (and a
s i m i l a r number f o r e l e c t r i c a l consumption). Each n a t u r a l gas consumption value (which
represents, on average, gas use during about a two-month period) was combined with t h e
heating d e g r e e d a y t o t a l f o r t h e corresponding period. These d a t a p o i n t s were used t o f i n d
slope i n t e r c e p t r e l a t i o n s h i p s by l e a s t squares a n a l y s i s f o r each house. The same procedure
was used with e l e c t r i c i t y data. The r e s u l t s a r e exemplified i n f i g u r e 2.
Amount of Variation i n Natural Gas Consumption Accounted f o r by Heating Degree-Days
The r e l i a b i l i t y of these l e a s t squares r e l a t i o n s h i p s i n describing t h e f u e l consumption
of houses depends on how much of t h e v a r i a t i o n i n energy consumption i s accounted f o r by t h e
heating degree-day parameter. Measures of t h i s a r e given by t h e c o e f f i c i e n t of
determination ( r 2).
Coefficients of determination were calculated f o r a l l 1,478
buses
(of a l l s t y l e s andages). It w a s found that f o r approximately 33% of t h e
houses,
t h e c o e f f i c i e n t ofdetermination exceeded 0.97; f o r 77% of them, i t exceeded 0.90; and f o r 92%, i t exceeded
0.80. This i n d i c a t e s t h a t t h e r e l a t i o n s h i p explained 80% of t h e v a r i a t i o n i n about 90% of
t h e cases, and 90% of t h e v a r i a t i o n i n 77% of t h e cases; t h e remaining v a r i a t i o n presumably would be due t o o t h e r e f f e c t s ( r e s u l t s a r e shown i n f i g u r e 3).
Houses with c o e f f i c i e n t s of determination of l e s s than 0.80 were excluded from energy
analyses. The s e l e c t i o n of 0.80 was somewhat a r b i t r a r y , but inspection of t h e d a t a suggested
t h a t i t would remove anomalous cases. No s p e c i a l e f f o r t was made t o determine t h e cause of
low c o r r e l a t i o n s . In a few cases t h e reason was apparent; f o r example, swimming pools may
require a g r e a t deal of heat and so d i s t o r t t h e energy consumption versus degree-day
r e l a t i o n s h i p t h a t i t becomes unusable a s a measure of house thermal performance.
A general d e s c r i p t i o n of t h e houses was given i n t h e introduction. Figure 4 shows t h e
s i z e
-
population d i s t r i b u t i o n . The most common s i z e was i n t h e 150 t o 200 m 2 range.The t o t a l f l o o r a r e a , used here t o express house s i z e , i s t h e sum of t h e basement a r e a
and t h e a r e a s of abovegrade f l o o r s . The term ' f l o o r area' i s used loosely here; s i z e s a r e
based on e x t e r i o r measurements. Thus, occupiable f l o o r a r e a is l e s s than t h e i n d i c a t e d
amount by a q u a n t i t y approximately equal t o t h e product of t h e perimeter and t h e w a l l
thickness. The e x t e r i o r measurement i s used because i t i s t h e normal way of expressing house
s i z e i n t h i s region.
Factors Affecting Energy Consumption
Several s e t s of v a r i a b l e s may a f f e c t energy use i n houses. I n many regions t h e l a r g e s t
amount of energy i s used f o r space heating (Schrader 1978). Energy consumption f o r space
heating may be r e l a t e d t o a number of f a c t o r s , including s i z e , shape, and s t y l e , e.g. s i n g l e
s t o r y , two s t o r y , o r s p l i t level. Other f a c t o r s a r e o r i e n t a t i o n , occupancy, and color.
Thermal i n s u l a t i o n l e v e l s and a i r t i g h t n e s s have a very l a r g e e f f e c t . I n t h i s study t h e
a v a i l a b l e d a t a do not provide information about a l l of t h e s e f a c t o r s . However, consumption
a s a function of s i z e , year of construction, and s t y l e could be estimated.
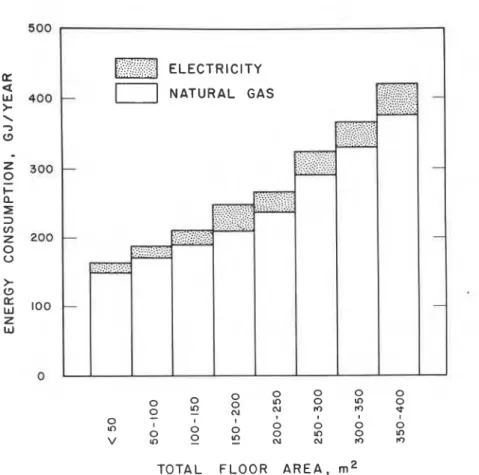
Figure 5 shows t h e n a t u r a l gas and e l e c t r i c i t y consumption a s a function of house s i z e .
Consumption h e r e r e p r e s e n t s t h e average annual consumption f o r a l l houses (with r 2
>
0.80) i neach s i z e range. Quantities f o r each house were c a l c u l a t e d from equations 2 and 3,
representing t h e i r n a t u r a l gas and e l e c t r i c i t y consumption based on 6,000 heating d e g r e e d a y s (OC) ( t h e average f o r Regina i s about 5,900 d e g r e e d a y s l y e a r ) . Both n a t u r a l gas and
e l e c t r i c i t y consumption increased with house s i z e . Natural gas consumption ranged from about
150 GJIyear f o r t h e smallest houses t o about 370 GJIyear f o r those i n t h e 350-400 m 2 range.
To construct f i g u r e 6, n a t u r a l gas consumptions were calculated f o r houses b u i l t a t
d i f f e r e n t times. Houses i n t h e o l d e s t group were b u i l t before 1921 and t h e newest a f t e r
1970. Groups containing fewer than f i v e houses were excluded. Small groups containing
Energy consumption d i d n o t vary widely w i t h y e a r of c o n s t r u c t i o n , although i n t h e l a r g e r s i z e s , o l d e r houses consumed somewhat more energy than newer ones.
F i g u r e 7 g i v e s a breakdown by s t y l e and s i z e f o r houses b u i l t a f t e r 1944. Again, groups c o n t a i n i n g fewer t h a n f i v e house a r e n o t shown. The t o t a l number of houses of each s t y l e i s shown i n brackets. The r e s u l t s do not show marked d i f f e r e n c e s i n consumption a s a f u n c t i o n of s t y l e , although duplexes and o n e s t o r y houses w i t h f u l l basements were somewhat lower t h a n others. Because of t h e paucity of houses i n some groups, i t would be i n a p p r o p r i a t e t o
conclude t o o much from them.
The Slope of t h e Natural Gas versus Heating Degree-Day R e l a t i o n s h i p a s a Measure of Space Heating Requirements
I n t h e preceding d i s c u s s i o n , t o t a l n a t u r a l gas consumption d a t a have been presented. Most of t h a t energy i s used f o r space heating; some of i t i s a l s o used t o h e a t w a t e r f o r domestic purposes and much of t h a t energy i s l o s t and does not c o n t r i b u t e t o space-heating needs. Since t h e u s e of n a t u r a l g a s f o r w a t e r h e a t i n g i s n o t measured s e p a r a t e l y , t h e s e d a t a do not g i v e e x p l i c i t information about space h e a t i n g requirements. However, SG i n equation 2 r e p r e s e n t s t h e change i n f u e l consumption w i t h t h e outdoor temperature (T) and, w i t h some q u a l i f i c a t i o n s , c o n s t i t u t e s a measure of t h e s p a c e h e a t i n g requirement f o r t h e house system. The v a l u e of SG w i l l be influenced by t h e s l o p e of t h e e l e c t r i c i t y consumption (SE), and by seasonal v a r i a t i o n s i n s o l a r g a i n and h o t water use. Nevertheless, f o r t h e s e houses, v a r i a t i o n s i n S w i l l be preponderantly dependent on s p a c e h e a t i n g requirements and i t i s
G
used h e r e a s a s p a c e h e a t i n g c o e f f i c i e n t .
'*
I n t h e following treatment, f i v e d i f f e r e n t house s t y l e s a r e studied: s p l i t l e v e l , two s t o r y , one and one-half s t o r y , one s t o r y f u l l basement and o n e s t o r y houses w i t h no
basement.
Values of SG f o r two-story, f u l l basement houses a r e p l o t t e d a g a i n s t t o t a l f l o o r a r e a ( f i g u r e 8). Values f o r houses of t h e same model were averaged t o produce a s i n g l e point. Thus each p o i n t r e p r e s e n t s one o r more houses of a given model. I n s p i t e of t h e s c a t t e r , t h e p l o t demonstrates a n upward t r e n d w i t h i n c r e a s i n g s i z e . To reduce t h e s c a t t e r , f i v e o r more p o i n t s were averaged t o produce a s i n g l e value, and t h e s e average v a l u e s a r e a l s o shown i n f i g u r e 8.
This averaging was a l s o done f o r t h e o t h e r s t y l e s of houses l i s t e d above. The combined r e s u l t s a r e shown i n f i g u r e 9. This g i v e s a c u r v i l i n e a r p l o t w i t h v a l u e s t h a t vary from about 21 MJ/DD f o r houses with a t o t a l f l o o r a r e a of 50 m 2 t o 50 MJ/DD a t 350 m2.
Data were a v a i l a b l e f o r o t h e r groups of houses, which were not used i n p r e p a r i n g f i g u r e 9 but were superimposed on i t . These i n c l u d e houses b u i l t b e f o r e 1945 and duplexes. A l l had f u l l basements. Consumptions per degree-day f o r duplexes were s u b s t a n t i a l l y l e s s
t h a n t h e average f o r o t h e r houses of corresponding s i z e .
The curve through t h e p o i n t s i n f i g u r e 9 was used t o prepare a second curve (S /A, s c a l e on r i g h t s i d e of f i g u r e ) . This g i v e s t h e space-heating coeff i c i e n t p e r u n i t a r e a , gegree-day v e r s u s area. T h i s shows v a l u e s f a l l i n g s h a r p l y from about 0.42 M . T / m 2 * ~ ~ f o r 50 m2 t o 0.15 M J / ~ ~ * D D f o r houses 200 m2 o r l a r g e r . Figure 10 shows SG as a f u n c t i o n of house s t y l e i n
s i z e increments of 50 m2. The p a t t e r n is s i m i l a r t o t h a t i n f i g u r e 7, where t h e o r d i n a t e v a r i a b l e w a s n a t u r a l g a s consmnp tion.
V a r i a t i o n i n SG f o r Nominally I d e n t i c a l Houses
The d a t a i n c l u d e values f o r a number of groups of houses of t h e same model. These were c o n s t r u c t e d according t o t h e same plans; n e v e r t h e l e s s t h e y would have somewhat d i f f e r e n t thermal performances due t o d i f f e r e n c e s i n exposure, o r i e n t a t i o n , c o l o r , q u a l i t y of c o n s t r u c t i o n , owner management and changes made by t h e owners a f t e r purchase, such a s f i n i s h i n g t h e basement and adding a d d i t i o n a l i n s u l a t i o n (Mitalas 1976). It i s t o be expected t h a t f u r n a c e e f f i c i e n c y would a l s o vary from house t o house. S t a t i s t i c a l
u n c e r t a i n t y about t h e s l o p e i n t r o d u c e s another v a r i a b l e . For e l e v e n such groups, of 19 t o 58 *Other f a c t o r s a r e involved, b u t space does n o t allow a complete d i s c u s s i o n of t h e v a l i d i t y
of SG as a device f o r c h a r a c t e r i z i n g energy u s e f o r space heating. 86
houses, t h e s l o p e s were found f o r each house and t h e mean and s t a n d a r d d e v i a t i o n of t h e s l o p e
were computed f o r each group ( t a b l e 1).
The s o r t i n g process i d e n t i f i e d a t o t a l of 374 houses i n t h e 11 groups. Of t h e s e , f i v e were known t o have heated swimming pools. These were r e j e c t e d s i n c e t h e n a t u r a l g a s u s e i s
s e v e r e l y d i s t o r t e d by t h a t load; i n some c a s e s , SG was negative.
I S i x of t h e houses were questioned because t h e i r v a l u e s of SG d i f f e r e d s u b s t a n t i a l l y from
t h e mean f o r t h e group. Their r a t i o s t o t h e i r r e s p e c t i v e mean v a l u e s ranged from 0.4 t o 1.7. I Also t h e c o e f f i c i e n t of determination f o r seven houses was l e s s t h a n 0.8. The d a t a a r e
I presented i n t a b l e 1 w i t h and without t h e q u e s t i o n a b l e houses, under t h e headings "No
Exclusions" and "Exclusions", r e s p e c t i v e l y .
I Table 1 shows t h a t when t h e q u e s t i o n a b l e v a l u e s a r e included t h e s t a n d a r d d e v i a t i o n of
t h e groups ranges from 7.6 t o 28.1%. I n c l u d i n g t h e q u e s t i o n a b l e v a l u e s i n c r e a s e d t h e
standard d e v i a t i o n of f i v e groups by up t o 75%. When q u e s t i o n a b l e v a l u e s were excluded, t h e s t a n d a r d d e v i a t i o n ranged from 6.6 t o 28.1%.
I
F i n a l l y , i n o r d e r t o e s t i m a t e t h e s c a t t e r of t h e houses a s a s i n g l e group, t h e s l o p e f o r each house (SG) w a s found as a f r a c t i o n of t h e mean s l o p e f o r i t s group(2).
These f r a c t i o n sI
were used t o p r e p a r e f i g u r e 11. The numbers of houses f a l l i n g i n each increment of .04 i n
sG/x
(sG/x from .94 t o .98, .98 t o 1.02 etc.) a r e p l o t t e d i n histogram form f o r a l l 369 houses.I
For t h e 369 houses a s a group, t h e standard d e v i a t i o n was 14.7% of t h e mean value. I f t h e 13 q u e s t i o n a b l e houses were d e l e t e d , t h e s t a n d a r d d e v i a t i o n was 12%. F u r t h e r , i f . t h e f i r s t group, which had an e x c e p t i o n a l l y l a r g e standard d e v i a t i o n , was excluded, t h e s t a n d a r d d e v i a t i o n f o r t h e remaining 334 houses was 10.2% of t h e mean.
I
Studies were a l s o made on t h e standard d e v i a t i o n s of energy consumption f o r t h e same houses. They were s l i g h t l y s m a l l e r t h a n t h e corresponding v a l u e s f o r SG: f o r n a t u r a l g a s consumption t h e s t a n d a r d d e v i a t i o n f o r t h e 369 houses was 13.9% of t h e mean; f o r n a t u r a l g a s p l u s e l e c t r i c i t y consumption, t h e s t a n d a r d d e v i a t i o n was 13.0% (compared t o 14.7% f o r SG). When t h e questionable values were excluded, t h e standard d e v i a t i o n s were 12.1 f o r n a t u r a l g a s consumption, 11.2 f o r n a t u r a l g a s p l u s e l e c t r i c i t y consumption, and 12.0 f o r SG.
Studies have been done by o t h e r s on energy consumption and i t s house-to-house v a r i a t i o n (Mayer and Robinson 1975; Sonderegger 1977/7 8). One r e p o r t concluded t h a t a s i g n i f i c a n t p a r t of t h e v a r i a t i o n could be a t t r i b u t e d t o occupant-related f a c t o r s (Sonderegger 1977/78). I n t h a t study t h e s t a n d a r d d e v i a t i o n was 22% of t h e mean
-
more t h a n t h e s t a n d a r d d e v i a t i o n f o r t h e combined groups i n t h e p r e s e n t study but less t h a n t h e d e v i a t i o n f o r t h e most s c a t t e r e d group. Our r e p o r t does n o t i n c l u d e information on t h e e f f e c t of occupant behavior o r o t h e r causes of t h e wide group-to-group v a r i a t i o n i n standard d e v i a t i o n (which ranged from 7.8 t o 26.4% f o r t h e combined group of 369 houses based on n a t u r a l g a s consumption, and from 7.6 t o 28.1% based on SG). This l a r g e d i f f e r e n c e suggests t h a t s i g n i f i c a n t modifications were made t o some of t h e houses and/or t h a t c o n s t r u c t i o n q u a l i t y d i f f e r e d widely from group t o group. It seems u n l i k e l y t h a t occupant behavioral p a t t e r n s f o r t h e d i f f e r e n t groups of houses would vary t h a t much. T h i s view i s supported by t h e f a c t t h a t SG v a r i e s a s much as energyconsumption and ( t h e o r e t i c a l l y a t l e a s t ) S should r e p r e s e n t t h e performance of t h e system. I d e a l l y i t should reduce o r n u l l i f y t h e e f f e c t of occupant p r e f e r e n c e f o r a h i g h o r low i n t e r i o r temperature and t h e e f f e c t of t h e amount of hot water consumed. I f i n t e r i o r temperature and h o t w a t e r consumption do n o t vary d u r i n g t h e h e a t i n g season, t h e f a c t t h a t they are high o r low should have l i t t l e e f f e c t on SG.
SUMMARY
1. Studies using records of consumption f o r n a t u r a l g a s and e l e c t r i c i t y were c a r r i e d o u t on 1,478 houses of a l l s t y l e s , ranging i n s i z e from about 45 t o 400 m 2 t o t a l f l o o r area. Slope i n t e r c e p t r e l a t i o n s h i p s between e l e c t r i c i t y and n a t u r a l gas consumption and h e a t i n g d e g r e e d a y s were found f o r each house.
2. The r e l a t i o n s h i p between t h e energy e q u i v a l e n t of n a t u r a l g a s consumption and h e a t i n g degree-days i s expressed h e r e a s EG = IG
+
S (18-
T), where 18-
T i s simply another expression f o r t h e number of h e a t i n g d e g r e e a a y s / d a y . The c o n s t a n t s IG and SG were found f o r each house i n t h e group by u s i n g f u e l meter readings and h e a t i n g d e g r e e d a y s f o r t h e corresponding periods. S i m i l a r l y IE and SE were found from e l e c t r i c i t y consumption data.3. T o t a l consumption of n a t u r a l gas v a r i e d from about 150 GJIyear f o r houses w i t h t o t a l f l o o r a r e a s i n t h e 50-100 m2 range t o 370 GJIyear f o r houses of 350 t o 400 m2.
Corresponding e l e c t r i c i t y consumption v a r i e d from 14 t o 50 GJIyear.
4.
Natural gas consumption was not markedly d i f f e r e n t f o r o l d houses t h a n f o r newer ones, and t h e s e d a t a d i d not show a l a r g e d i f f e r e n c e due t o s t y l e of houses.5 . I n t h e r e l a t i o n s h i p EG = IG
+
SG (18-
T), SG ( r e f e r r e d t o h e r e a s t h e 'space h e a t i n g c o e f f i c i e n t ' ) is c h a r a c t e r i s t i c of t h e house t o which t h e equation a p p l i e s . It r e p r e s e n t s approximately t h e r a t e of change i n f u e l consumption w i t h change i n t h e outdoor temperature (TI.6. S i n c r e a s e s with i n c r e a s i n g house s i z e i n a non-linear f a s h i o n , ranging from about 21 ~ / D D f o r houses w i t h a t o t a l f l o o r a r e a of 50 m2, t o 50 MT/DD f o r houses w i t h a t o t a l f l o o r a r e a of 350 m2.
7. For groups of nominally i d e n t i c a l houses, t h e s t a n d a r d d e v i a t i o n s f o r S (and average d a i l y consumption of n a t u r a l gas and e l e c t r i c i t y ) were approximately 109 of t h e mean v a l u e s f o r t h e groups. These would appear t o provide a measure of t h e combined e f f e c t s of such f a c t o r s a s exposure, occupant management, f u r n a c e e f f i c i e n c y , c o l o r , and
o r i e n t a t i o n , a s w e l l a s v a r i a t i o n s i n q u a l i t y of house c o n s t r u c t i o n and changes made a f t e r c o n s t r u c t i o n , on t h e thermal performance of t h e house.
8. The information gained from t h i s study provides a u s e f u l s e t of r e f e r e n c e values. F u e l consumption i n l o w energy houses can be compared t o t h e s e v a l u e s i n o r d e r t o e v a l u a t e t h e success of energy conserving measures. Studies designed t o i d e n t i f y causes of v a r i a t i o n i n f u e l consumption may b e n e f i t from a n a l y s i s of t h e t o t a l v a r i a t i o n t h a t w a s found h e r e f o r nominally i d e n t i c a l houses.
REFERENCES
Hedlin. C.P. and Orr. H.W.. 1977. "A study of t h e use of n a t u r a l gas and e l e c t r i c i t y i n siskatchewan homes", SHELTER, proceedings of t h e Technical program of t h e 9 1 s t Annual EIC Meetinn. J a s p e r , Alberta, May 1977, pp. 123-131, NRCC 16898.
Mayer, L.S. and Robinson, J.A., 1975. "A s t a t i s t i c a l a n a l y s i s of t h e monthly consumption of gas and e l e c t r i c i t y i n t h e home", Center f o r Environmental Studies Report NO. 18. P r i n c e t o n U n i v e r s i t y , NJ.
M i t a l a s , G.P., 1976. "Net annual h e a t l o s s f a c t o r method f o r e s t i m a t i n g h e a t requirements i n buildings", Building Research Note 117, Division of Building Research, National Research Council Canada, O t t m a .
Schrader, T.F., 1978. "A two-parameter model f o r a s s e s s i n g t h e determinants of r e s i d e n t i a l space heating". M.S. t h e s i s , Princeton University, NJ.
Sonderegger, R.C., 1977178. '?lovers and s t a y e r s : The r e s i d e n t ' s c o n t r i b u t i o n t o v a r i a t i o n a c r o s s houses i n energy consumption f o r space heating". Energy and Buildings 1
ACKNOWLEDGEMENT
The authors wish to express their appreciation to the Saskatchewan Power Corporation for providing the energy consumption data and to the City of Regina Assessor's Office for providing size and other information about these houses. Wiehout their assistance and cooperation, the study could not have been carried out. We also wish to thank H.W. Orr and
,
S.S. Tao for their advice and assistance and T.B. Remple for his work in carrying out theanalyses. This paper is a contribution from the Division of Building Research, National
;
Research Council Canada, and is published with the approval of the Director of the Division.I
TABLE 1
Mean and Standard Deviation of SG for Groups of Nominally Identical Houses
No Exclusions* ~xclusions+
I
Cons t ruc- Main Total No. in Mean Standard No. in Mean Standard tiondate floorarea floor group slope deviation group slope deviation
area (S ) (% of mean) (S ) (% of mean)
(m2> (ft2) (m2)
(EU~DD)
(MJ~DD) I Single-Story, no basement 1946 58 (625) 58 22 25.2 28.1 22 25.2 28.1 1957-60 88 (950) 88 19 21.8 11.7 18 21.9 11.6(c) 1960-61 89 (960) 89 23 26.3 17.0 2 2 25.7 12.7(c)Single-Story, full basement
1952 89 (960) 178 5 1 29.5 15.0 50 29.1 11.0(d)
1965-67 96 (1030) 191 37 27.3 7.7 3 7 27.3 7.7
Four-Level Split
1963-71 130 (1394) 259 32 39.6 12.6 3 1 39.6 12.7(c)
*Except for houses with heated swimming pools.
+~xcluded because of low coefficient of determination (c)
,
large difference from the mean (d).F i g u r e 1 . O u t d o o r t e m p e r a t u r e T v e r s u s T . T i s T , O C b a s e d o n m o n t h l y a v e r i g e s o f DD/day. F i g u r e 2 . A v e r a g e d a i l y c o n s u m p t i o n o f n a t u r a l T h e d o t t e d l i n e c o r r e s p o n d s t o T a = T . g a s ( E ) a n d e l e c t r i c i t y ( E E ) f M J / d a y ) f o r a f y p i c a l h o u s e f r o m s t u d y . A b s c i s s a s c a l e s h o w n b o t h f o r d e g r e e - d a y s / d a y a n d c o r r e s p o n d i n g t e m p e r a t u r e ( T I . COEFFICIENT OF DETERMINATION F i g u r e 3 . F r e q u e n c y v e r s u s c o e f f i c i e n t
d e t e r m i n a t i o n f o r l e a s t s q u a r e s f i t s TOTAL FLOOR AREA, rn2 o f n a t u r a l g a s c o n s u m p t i o n
-
h e a t i n gd e g r e e
-
d a y d a t a f o r 1 4 7 8 h o u s e s . F i g u r e 4 . S i z e - f r e q u e n c y d i s t r i b u t i o n o f h o u s e s i n s t u d y .-
ELECTRICITY ... .:. ...-
NATURAL GAS :?:. ... ...- :-
v ;.:; ;:.;>. .:..,: ... ...A ... ..r..'.:'..,:C.<.: :.',I::::: :: .;. ._-,.. ... ...& ... '.." ... <$;;o.:i,.::: , :.. :;:>j:j:,:: ... .>. ... : ::.,,::.::.:,>:.'.-
.;.::.,:, ... ... ....I_ ... ....-
7 ... ?,.,.,. :!::x.:- :.- ... ... : ;::. :... :::., :;.:..>,;:y ,:::::; :, , , . ."'.;: . ,.,,., .,._ . :::..:::<,. .,.... :.'. :.,,>::::v.,:,,.,C
m... :. -.:::..I.. :..:,. --
-Figure 5 . E l e c t r i c i t y and natural gas consumption as
a f u n c t i o n o f house s i z e . Each value repre- s e n t s consumption based on average f o r a l l houses i n t h e s i z e range. a 400 a W PRE 1921 ( 4 6 ) > 1921-40 ( 6 4 ) \ 7 1941-50 ( 2 2 2 ) a 1951 - 6 0 ( 3 4 3 ) 300 z 1961 - 7 0 (581)
0
1971 - 7 3 ( 9 7 ) I- a I 3 v, 200 z 0 0 v, a a 100 J a a 3 I- a 0Figure 6. Natural gas consumption versus year o f c o n s t r u c t i o n and t o t a l f l o o r area. Black d o t s i d e n t i f y groups o f only 5 t o 9 houses. Numbers i n b r a c k e t s are t o t a l houses o f t h a t e r a .
a a 2 STOREY ( 4 0 ) W > 1 STOREY ( 6 5 ) \ 7 SPLIT LEVEL ( 1 0 2 )
"
3 0 0 l STOREY FULL BASEMENT ( 6 5 6 ) I STOREY NO BASEMENT (143) Z DUPLEXES ( 4 2 )z
a I 3 2 0 0 V) Z 0 U V) a (3 100 1 a a 3 l- a z 0 T O T A L F L O O R A R E A , rn2 F i g u r e 7 . N a t u r a l g a s c o n s u m p t i o n v e r s u s s t y l e o f h o u s e and t o t a l f l o o r a r e a . B l a c k d o t s i n d i c a t e g r o u p s o f 5 t o 9 h o u s e s . O t h e r g r o u p s a r e l a r g e r . Numbers i n b r a c k e t s a r e t o t a l h o u s e s o f t h a t s t y l e . 60 5 0 n n \ 7 4 0-
(3 V) 30 2 0 I I I I 0 0 I N D I V I D U A L V A L U E S .AVERAGES O F F I V E V A L U E S 0-
-
0 . 0 0 o0-
0 0 - 0 0 0 O 0 . 0 0 oO 0 0 O.",OO-
2'
0-
OOo 0 OD 0 0 0 I I I I 100 200 300 TOTE,L: FLOOR A R E A , m2 ( N O M I N A L ) F i g u r e 8 . N a t u r a l g a s c o n s u m p t i o n-
d e g r e e - d a y s l o p e s (S ) v e r s u s t o t a l n o m i n a l f l o o r a r e a f o r 2 - s t o r y f u f l b a s e m e n t h o u s e s . 92I 0
1
o 3 0 100 2 0 0 3 0 0 400 P \2
TOTAL FLOOR AREA, m 2 (NOMINAL) 5
w
Figure 9 . Natural gas consumption
-
degree-day rn 2 0s l o p e s ( S G ) (data p o i n t s and dotted c u r v e ) f o r houses o f d i f f e r e n t s i z e s and t y p e s . SG/A M / m Z DD ( s o l i d c u r v e ) . 1 0 -
a
2 STOREY 1401 1 STOREY ( 6 5 ) SPLIT L E V E L ( 1 0 2 )1 I STOREY FULL BASEMENT ( 6 5 6 )
- I STOREY NO BASEMENT (1431 DUPLEXES ( 4 2 1
Figure 10. Average values o f S o r d i f f e r s n t
cf
s t y l e s o f houses as a f r a c t i o n o f s i z e . Black d o t s i d e n t i f y groups o f only 5 t o 9 houses. Numbers i n b r a c k e t s are t o t a l houses o f t h a t s t y l e .Figure 1 1 . Frequency o f occurrance versus S /I
G
f o r 369 houses i n 1 1 groups. S r e p r e s e n t s
G
t h e natural gas slope f o r a house and x t h e mean value o f S f o r G i t s group.
T h i s paper, w h i l e being d i s t r i b u t e d i n r e p r i n t form by t h e D i v i s i o n of B u i l d i n g Research, remains t h e c o p y r i g h t of t h e o r i g i n a l p u b l i s h e r . It should n o t be reproduced i n whole o r i n p a r t w i t h o u t t h e permission of t h e p u b l i s h e r . A