THE CHEMICAL EVOLUTION OF THE
BOÖTES I ULTRA-FAINT DWARF GALAXY
The MIT Faculty has made this article openly available. Please share
how this access benefits you. Your story matters.
Citation
Frebel, Anna, et al. “THE CHEMICAL EVOLUTION OF THE BOÖTES
I ULTRA-FAINT DWARF GALAXY.” The Astrophysical Journal 826, 2
(July 2016):110. © 2016 American Astronomical Society
As Published
http://dx.doi.org/10.3847/0004-637X/826/2/110
Publisher
IOP Publishing
Version
Final published version
Citable link
http://hdl.handle.net/1721.1/114026
Terms of Use
Article is made available in accordance with the publisher's
policy and may be subject to US copyright law. Please refer to the
publisher's site for terms of use.
THE CHEMICAL EVOLUTION OF THE BOÖTES I ULTRA-FAINT DWARF GALAXY
*Anna Frebel1,2, John E. Norris3, Gerard Gilmore4, and Rosemary F. G. Wyse5
1
Department of Physics and Kavli Institute for Astrophysics and Space Research, Massachusetts Institute of Technology, Cambridge, MA 02139, USA
2
Joint Institute for Nuclear Astrophysics—Center for Evolution of the Elements, East Lansing, MI 48824, USA
3
Research School of Astronomy and Astrophysics, Australian National University, Canberra, ACT, 2611, Australia
4
Institute of Astronomy, University of Cambridge, Cambridge CB3 0HA, UK
5
The Johns Hopkins University, Department of Physics & Astronomy, Baltimore, MD 21218, USA Received 2016 March 31; revised 2016 May 11; accepted 2016 May 11; published 2016 July 26
ABSTRACT
We present chemical abundance measurements of two metal-poor red giant stars in the ultra-faint dwarf galaxy
Boötes I, based on Magellan/MIKE high-resolution spectra. For Boo-980, with [Fe H/ ] = -3.1, we present the
first elemental abundance measurements, while Boo-127, with [Fe H/ ] = -2.0, shows abundances in good
agreement with previous measurements. Light and iron-peak element abundance ratios in the two Boötes I stars, as well as those of most other Boötes I members, collected from the literature, closely resemble those of regular metal-poor halo stars. Neutron-capture element abundances Sr and Ba are systematically lower than the main halo
trend and also show a significant abundance spread. Overall, this is similar to what has been found for other
ultra-faint dwarf galaxies. We apply corrections to the carbon abundances (commensurate with stellar evolutionary
status) of the entire sample and find 21% of stars to be carbon-enhanced metal-poor (CEMP) stars, compared to
13% without using the carbon correction. We reassess the metallicity distribution functions for the CEMP stars and
non-CEMP stars, and confirm earlier claims that CEMP stars might belong to a different, earlier population.
Applying a set of abundance criteria to test to what extent Boötes I could be a survivingfirst galaxy suggests that it
is one of the earliest assembled systems that perhaps received gas from accretion from other clouds in the system,
or from swallowing a first galaxy or building block type object. This resulted in the two stellar populations
observable today.
Key words: early universe– galaxies: dwarf – Galaxy: halo – Local Group – stars: abundances – stars:
Population II
Supporting material: machine-readable table
1. INTRODUCTION
Dwarf satellite galaxies are versatile probes of chemical evolution, galactic halo assembly, and early galaxy formation
processes. Ultra-faint dwarf galaxies (L <105
L ) are
particu-larly well-suited for testing these processes since they appear to have had limited star formation and chemical evolution, thus rendering them relatively simple and unevolved systems. What has made ultra-faint dwarfs particularly interesting is their overall low metallicity coupled with large metallicity spreads of
several dex (e.g., Kirby et al. 2008). While stars with
metallicities below [Fe H/ ] = -3.0have been found in nearly
all of these systems, the ultra-faint dwarfs completely lack
higher-metallicity stars [Fe H/ ] > -1.0showing that chemical
enrichment did not proceed long enough to reach even close to the solar level.
Based on the chemical abundances of the seven brightest stars, the faintest of the ultra-faint dwarfs, Segue 1, was found
to be a promising candidate for a survivingfirst galaxy (Frebel
et al.2014). Criteria for such a survivor include large spreads in
[Fe/H], halo-like α-abundances at higher metallicity, and low neutron-capture element abundances, all of which are found among Segue 1 stars. Being the faintest of all ultra-faint dwarf galaxies, Segue 1 may be regarded the best candidate for one of
the most primitive dwarf galaxies still observable (see also Ji
et al. 2015; Webster et al. 2016). But how common could
survivingfirst, or very early, galaxies be today? This can only
be answered with detailed inspections of the stellar chemical abundances in additional dwarf systems. This is, however, challenging given the faint nature of even the brightest available stars near the tip of the red giant branch. High-resolution spectra are thus only available of a few stars per galaxy: e.g., three each in Ursa Major II and Coma Berenices
(Frebel2010); one star in Leo IV (Simon et al.2010); 12 stars
in Hercules, although most of them have a very limited red
wavelength coverage (Koch et al. 2008; Adén et al. 2011);
seven stars in Segue 1(Norris et al.2010a; Frebel et al.2014);
and four stars in Boötes II(Koch & Rich2014; Ji et al.2016b.
Fortunately, Boötes I has been studied extensively since its
discovery in 2006 by Belokurov et al.(2006). Beginning with
medium-resolution spectroscopic surveys(Muñoz et al. 2006;
Norris et al. 2008, 2010b), membership was established and
then the [Fe/H] distributions were determined. Hughes et al.
(2008,2014) found a large abundance spread of at least from
[ ]
-3.7< Fe H/ < -1.9 based on photometric metallicities.
[C/Fe] spreads and α-abundances were also spectroscopically
measured for some subsamples (Lai et al. 2011). From these
samples, a total of 11 stars have been observed at high-resolution to produce their chemical abundance patterns
(Feltzing et al. 2009; Norris et al. 2010c; Gilmore
et al. 2013; Ishigaki et al. 2014). Most of these stars have
been observed by more than one group. This has led to well-established abundances for these stars, which is of importance for the overall interpretation of the chemical inventory of Boötes I. Additionally, a kinematic study has been carried out
(Koposov et al.2011), age estimates for Boötes I have been
The Astrophysical Journal, 826:110 (14pp), 2016 August 1 doi:10.3847/0004-637X/826/2/110
© 2016. The American Astronomical Society. All rights reserved.
*
This paper includes data gathered with the 6.5 m Magellan Telescopes located at Las Campanas Observatory, Chile.
obtained (Okamoto et al. 2012; Brown et al. 2014; Hughes
et al. 2014), and its chemical evolution has been modeled
(Romano et al. 2015).
In this paper we report observations for one star in Boötes I with no previous high-resolution spectroscopy, and a second that has been observed before. Our goal is to investigate the
chemical enrichment history of Boötes I to find out to what
extent this galaxy shows signs of being a survivingfirst galaxy.
To test such a hypothesis, we use the observational criteria
suggested by Frebel & Bromm(2012) for the metallicity spread
and different abundance levels in a given system. As part of this we also aim to quantify whether there were multiple stellar generations present and to what extent chemical evolution occurred in this system. This follows earlier hints that some element contributions by Type Ia supernovae have occurred in
the system (Gilmore et al. 2013). Because the luminosity of
Boötes I is about 100 times higher than that of Segue 1, and
nearly 105L(Muñoz et al.2006), we also aim to address how
the overall extent of chemical evolution relates to the luminosity of the system. Additional considerations in addition
to the metallicity–luminosity relationship (e.g., Kirby et al.
2008) that appears to exist for all dwarf galaxies may shed light
on the formation and evolution of these objects.
In Section 2 we describe our new observations and in
Section 3 we present our analysis techniques and
corresp-onding chemical abundance results. We apply a set of chemical abundances criteria to our and literature abundances to assess to
what extent Boötes I is a survivingfirst galaxy in Section4. We
discuss ourfindings in Section5.
2. TARGET SELECTION AND OBSERVATIONS
Targets were selected from Norris et al. (2008) who had
taken medium-resolution R ∼ 5000 AAOmega spectra of
Boötes I stars with the Anglo-Australian Telescope. Their wide
survey covered ∼6 half-light radii from the center of the
galaxy. Radial velocity-confirmed members were further
analyzed (Norris et al. 2010b). Star Boo-1137, with
[Fe H/ ] = -3.7, was observed with high spectral resolution
for a detailed abundance analysis(Norris et al.2010c), as were
seven additional stars(Gilmore et al.2013). Six of those stars
were also observed by Ishigaki et al.(2014). The only brighter
star that had not been observed was Boo-980. Being located at 3.9 half-light radii from the center it was only covered by the
Norris et al.(2010b) study. In contrast, another star, Boo-127,
was observed by all these studies,first by Feltzing et al. (2009)
and then by all the others. Discordant abundance ratios were found which made this star interesting for re-observation. We observed these latter two Boötes I stars with the MIKE
spectrograph (Bernstein et al. 2003) on the Magellan-Clay
telescope in 2010 March and 2011 March. Details of the MIKE
observations and photometry taken from Norris et al. (2008)
are given in Table 1. MIKE spectra have nearly full optical
wavelength coverage over the range∼3500–9000 Å. Observing
conditions during these runs were mostly clear, with an average
seeing of 0 8 to 1 0. The 1. 0 ´ 5 slit yields a spectral
resolution of ∼22,000 in the red and ∼28,000 in the blue
wavelength regime. We used 2× 2 on-chip binning. Exposure
times were ∼4 and 7 hr, and the observations were typically
broken up into 45–55 minute exposures to avoid significant
degradation of the spectra by cosmic rays.
Reductions of the individual MIKE spectra were carried out with the MIKE Carnegie Python pipeline initially described by
Kelson (2003).6 The orders of the combined spectrum were
normalized and merged to producefinal one-dimensional blue
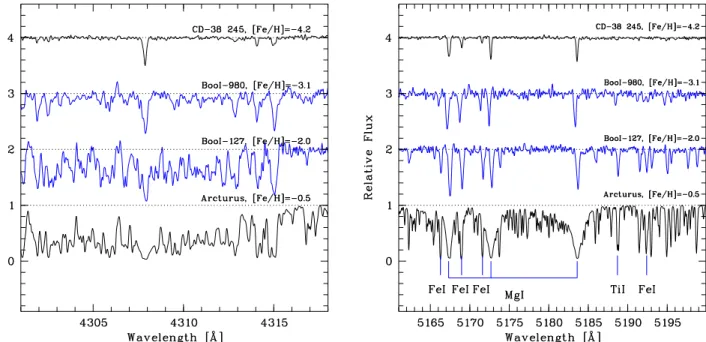
and red spectra for further analysis. The spectra have modest
S/Ns which range from 25 to 30 at ∼5300 Å and 37 to 43 at
∼6000 Å. Figure1shows representative portions of the spectra
around the CH G-band at 4313Å and the Mg b-lines at 5170 Å.
For comparison we also add CD −38° 245 with [Fe H/ ] ~
-4.2 as well as Arcturus([Fe H/ ] = -0.5). They bracket the
metallicities of the Boötes I stars.
3. CHEMICAL ABUNDANCE ANALYSIS RESULTS We measured the equivalent widths of metal absorption lines
throughout the spectra using software from Casey (2014).
Blending features were treated with spectrum synthesis to
obtain line abundances. Table 2 lists the lines used and their
measured equivalent widths and abundances for all elements,
together with 3σ upper limits for selected elements. Full details
of our analysis procedure are given in Frebel et al.(2014) who
analyzed the Segue 1 stars in exactly the same manner. Using one-dimensional plane-parallel model atmospheres
with α-enhancement from Castelli & Kurucz (2004) and the
latest version of the MOOG analysis code (Sneden 1973;
Sobeck et al. 2011), we computed local thermodynamic
equilibrium abundances for our Boötes I stars. Final abundance
ratios [X/Fe] are obtained using the solar abundances of
Asplund et al. (2009) and are listed in Table 3. Abundance
uncertainties refer to the standard deviation of the line abundance measurements for each element. In the case of elements with few lines and the standard deviation resulting in very small values, we adopt a nominal minimum uncertainty of 0.1 dex.
3.1. Stellar Parameters
We derive stellar parameters spectroscopically from FeIand
FeIIlines by minimizing abundance trends and matching the
FeIto FeIIabundance. We follow the procedure described in
Frebel et al. (2013) which adjusts the spectroscopic
Table 1 Observing Details
Star α δ UT Dates Slit texp g0 (g-r)0 S/N S/N
(J2000) (J2000) (hr) (mag) (mag) 5300Å 6000Å Boo-980 13 59 12.68 +13 42 55.8 2010 Mar 07/08/18/24 1 0 7.0 18.51 0.61 25 37 Boo-127 14 00 14.57 +14 35 52.7 2011 Mar 10/12 1 0 3.7 18.15 0.76 30 43 Note. The S/N is measured per ∼33 mÅ pixel.
6
temperatures to better match those derived from photometry. In this way, no unphysically cool temperatures and low surface gravities are obtained. We note that the present analysis procedures are identical to those employed in the analysis of
the stars in Segue 1(Frebel et al.2014). This allows us to make
a homogeneous comparison between the Boötes I and Segue 1
stars. The final spectroscopic stellar parameters are Teff=
4720 K,logg=1.4,vmicr=2.2km s−1, and [Fe H/ ] = -3.06
for Boo-980 and Teff=4765K, logg =1.35, vmicr=
2.3 km s−1, and [Fe H/ ] = -1.99 for Boo-127. We estimate
our temperature uncertainties to be ∼100-150 K, and those in
g
log and vmicr to be 0.3 dex and 0.3 km s−1, respectively. The
spectroscopic temperatures agree well with temperatures
derived from the (g -r)o color transformed to B− V (Jordi
et al.2006), and using color–temperature relations from Alonso
et al. (1999). They are Teff=4810K for Boo-980 and
=
Teff 4625K for Boo-127. Our final spectroscopic stellar
parameters agree very well with values of a 12 Gyr isochrone
with [α/Fe] = 0.4 and metallicities of [Fe H/ ] = -3.0 and
−2.0 (Kim et al.2002).
3.2. Chemical Abundances
Here we briefly summarize key aspects of our chemical
abundance analysis. Again, we refer the reader to Frebel et al.
(2014) for further details since our analysis follows the same
procedures. We use the 4313 and 4323Å CH features to
determine the C abundance. Both Boo-980 and Boo-127 have
slightly subsolar [C/Fe] ratios, when taken at face value.
However, one has to take into account that carbon is converted to nitrogen due to the CN cycle operating on the red giant branch. Many of the Boötes I stars are indeed located on the giant branch and suffer from this depletion. Calculating individual corrections based on stellar evolutionary modeling
(see Placco et al.2014for more details) for each star to counter
this effect leads tofinal carbon abundances of [C Fe/ ] =0.13
and 0.37, for the two stars, respectively. We also apply
Figure 1. Magellan/MIKE spectra of our Boötes I stars, shown near the G-band head at 4314 Å (left) and the Mg b-lines around 5180 Å (right). Some absorption lines are indicated. The stars are bracketed in terms of their metallicity by Arcturus(bottom) and CD −38° 245 (top).
Table 2
Equivalent Width Measurements of the Boötes I Stars
El. λ χ loggf EW(mÅ) lg (dex) EW(mÅ) lg (dex)
(Å) (eV) (dex) Boo-980 Boo-127
CH 4313 K K syn 4.97 syn 6.24 CH 4323 K K syn 4.97 syn 6.34 NaI 5889.950 0.00 0.108 153.6 3.56 218.6 4.19 NaI 5895.924 0.00 −0.194 129.9 3.46 199.4 4.27 MgI 3829.355 2.71 −0.208 163.7 4.96 K K MgI 3838.292 2.72 0.490 199.2 4.61 K K MgI 3986.753 4.35 −1.030 K K 88.7 6.16 MgI 4057.505 4.35 −0.890 K K 96.3 6.15 MgI 4167.271 4.35 −0.710 K K 97.7 5.99 MgI 4571.096 0.00 −5.688 46.2 4.92 122.6 6.06
corrections to the adopted literature carbon abundances which range from 0 dex for the warmer giants to 0.75 dex for giants
withTeff=4500K(see also Section3.3for further discussion).
The corrected carbon abundances of all stars in Boötes I together with corrected values of the comparison stars are
shown in Figure2.
As can be seen in the figure, there is a clear trend of
increasing carbon abundance with decreasing [Fe/H], very
similar to what is found among halo stars (e.g., Barklem
et al. 2005; Placco et al. 2014). Overall, a range in carbon
abundances of 2.7 dex is present among Boötes I stars, from
[ ]
-0.34< C Fe/ <2.31(after applying the carbon correction).
In fact, there are eight carbon-enhanced metal-poor (CEMP)
stars [C Fe/ ] >0.7 (CEMP subclasses are discussed further
below) after the application of the carbon corrections of Placco
et al.(2014). (There are five CEMP stars before the correction.)
This means that the overall fraction of CEMP stars is eight out
of 39, and thus ~21%. For stars with [Fe H/ ] < -2.5, the
fraction is seven out of 19, and thus 37%. This increases to
66%(four out of six) for [Fe H/ ] < -3.0, and 100%(one star)
for [Fe H/ ] < -3.5. These fractions of CEMP stars are
considerably higher than the results from halo stars for the
respective metallicities ranges, 24%, 43%, and 60% (Placco
et al. 2014). Note, however, that the Boötes I results are of
course based on significantly smaller samples. Nevertheless,
we broadly conclude that Boötes I does not show a carbon
Table 3
Magellan/MIKE Chemical Abundances of Our Two Boötes I Stars Species N log( )X σ [X/H] [X/Fe]
Boo-980 CH 2 4.97 0.20 −3.46 −0.40 NaI 2 3.51 0.10 −2.73 0.33 MgI 7 4.83 0.13 −2.77 0.29 AlI 2 2.62 0.20 −3.83 −0.77 SiI 2 4.88 0.10 −2.62 0.44 CaI 8 3.57 0.11 −2.77 0.30 ScII 6 0.08 0.10 −3.07 −0.01 TiI 8 2.28 0.15 −2.67 0.40 TiII 31 2.32 0.19 −2.63 0.43 CrI 6 2.13 0.17 −3.51 −0.45 MnI 3 1.93 0.10 −3.50 −0.44 FeI 125 4.44 0.20 −3.06 0.00 FeII 11 4.46 0.18 −3.04 0.02 CoI 4 2.45 0.10 −2.54 0.53 NiI 5 3.23 0.21 −2.99 0.07 ZnI 1 1.90 0.15 −2.66 0.40 SrII 2 −1.14 0.20 −4.01 −0.95 BaII 2 −2.11 0.20 −4.29 −1.23 EuII 1 <−2.44 K <−2.96 <0.10 Boo-127 CH 2 6.29 0.20 −2.14 −0.15 NaI 2 4.23 0.10 −2.01 −0.02 MgI 6 6.02 0.11 −1.58 0.41 AlI 1 3.57 0.20 −2.88 −0.89 SiI 1 6.28 0.20 −1.23 0.76 CaI 21 4.60 0.13 −1.74 0.24 ScII 9 1.07 0.10 −2.08 −0.09 TiI 22 3.11 0.12 −1.84 0.15 TiII 46 3.30 0.22 −1.65 0.33 CrI 20 3.57 0.18 −2.07 −0.09 CrII 2 3.64 0.11 −2.00 −0.01 MnI 7 2.94 0.14 −2.49 −0.50 FeI 204 5.51 0.21 −1.99 0.00 FeII 26 5.53 0.17 −1.97 0.01 CoI 4 2.88 0.16 −2.11 −0.12 NiI 16 4.17 0.44 −2.05 −0.07 ZnI 1 <2.52 K <−2.04 <−0.05 SrII 1 −0.32 0.99 −3.19 −1.20a BaII 3 −0.53 0.10 −2.71 −0.72 EuII 1 <−1.37 K <−1.89 <0.10 Note. a
Derived only from the l4215 line. The l4077 line gave a spuriously low abundance.
Figure 2. [C/Fe] abundance ratios (corrected for the evolutionary status of the stars) as a function of [Fe/H] (top panel) and surface gravity (bottom panel) of our Boötes I stars(filled red circles) and literature Boötes I stars (open red circles; Ishigaki et al.2014values were used for the best possible internal consistency), in comparison with metal-poor halo stars (black circles; Barklem et al. 2005) and other dwarf galaxy stars (Segue 1: blue circles (Frebel et al.2014); UMa II, ComBer, and Leo IV: green circles (Frebel et al.2010; Simon et al.2010). Representative error bars are also shown. The definition of C-enhancement from Aoki et al.(2007) is shown with a dashed line.
abundance distribution that is different from that of the Galactic halo.
Although also plagued by low number statistics, the same (qualitative) behavior is found for the combined population of
Segue 1(excluding their metal-rich CH star which is not shown
in Figure2), Ursa Major II, Coma Berenices, and Leo IV stars.
The overall fraction is five out 13 (38%). No stars with
[Fe H/ ] > -3.0 are CEMP stars but the five stars with
[Fe H/ ] < -3.0 are all carbon enhanced(100%).
Interestingly, two of the eight carbon-enhanced stars in Boötes I for which barium abundances are available belong to the class of CEMP-no stars, that is, CEMP stars without supersolar enhancement in neutron-capture elements, i.e., [Ba Fe/ ] <0(Beers & Christlieb2005). Additional data would
be needed to determine whether the remaining six objects are also CEMP-no stars. It should be noted, however, that no star with a barium measurement in Boötes I has enhanced neutron-capture element abundances compared to the solar level, making it likely that these six objects will turn out to be CEMP-no stars also. This speculation is furthermore supported by the fact that all CEMP stars in the group of ultra-faint dwarfs of
Segue 1 (SDSS J100714+160154, SDSS J100652+160235,
SDSS J100639+160008, Segue 1–7), Ursa Major II (UMa
II-S1), and Leo IV (Leo IV-S1) stars are CEMP-no stars. For
completeness, we also note that one CEMP-s star was found in Segue 1. Interestingly, several CEMP-r stars were recently
found in the ultra-faint dwarf galaxy Reticulum II (DES
J033523540407, DES J033607540235, DES J033454540558)
whose r-process elements likely stem from a independent source than all other elements, namely a neutron star merger or
magnetar(Ji et al.2016a).
Again, this behavior is very similar to that of halo stars which adds evidence that the most metal-poor halo stars could have originated in small dwarf galaxies such as the systems
discussed here(see e.g., discussion in Frebel & Norris2015). A
further extensive discussion on the carbon abundances in Boötes I in the context of chemical evolution can be found in
Gilmore et al.(2013) and will not be repeated here.
We used the MgI, SiI, CaI, and TiIIlines to determine
α-element abundances from equivalent width measurements and
spectrum synthesis (in the case of Si). Our two stars have
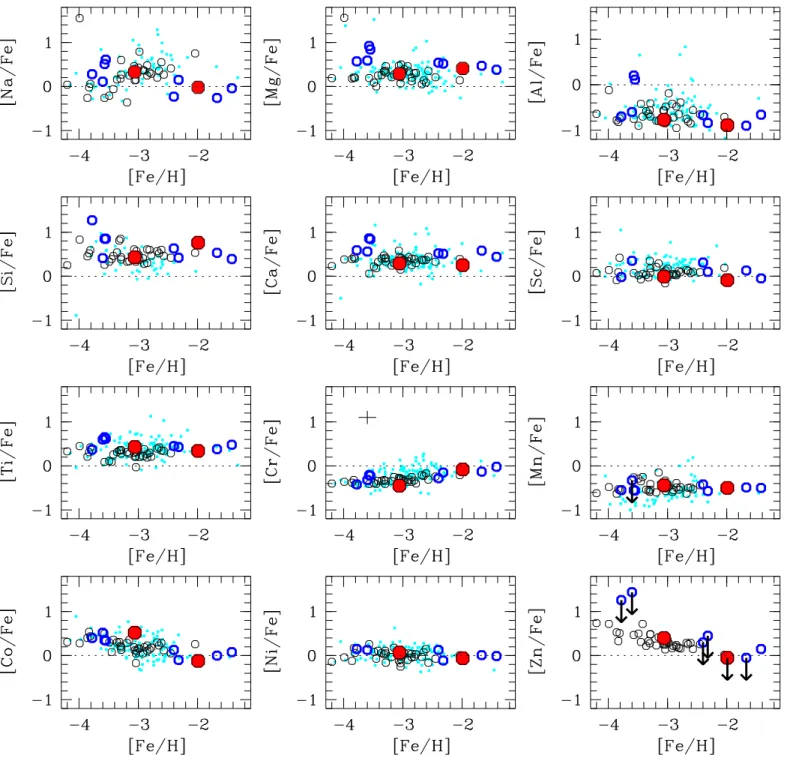
enhanced, halo-typical α-enhancement. Figure 3 shows the
comparison of most of our elemental abundances for the two stars, in comparison with those of the extremely metal-poor star
samples from Cayrel et al.(2004), Yong et al. (2013), as well
as the Segue 1 ultra-faint dwarf galaxy stars (Frebel
et al. 2014). Overall, the agreement of the different groups of
stars is remarkably good.
Considering the full Boötes I sample, a similar behavior is found. About two-thirds of the Boötes I stars with
high-resolution abundance measurements have halo-typical
α-element abundances, as can be seen in Figure 4 in the top
three panels. A combined [α/Fe] versus [Fe/H] (bottom two
panels) then delivers an overall reasonable agreement with halo
star abundances. No obvious downturn to solar-level ratios are
found for Mg, Ca, Ti, and the combined[α/Fe], despite some
individual stars having low abundances. Overall, though, the
slope of[α/Fe] does somewhat decrease with increasing [Fe/H].
Excluding Boo-119, a CEMP-no star with [Fe H/ ] = -3.3
and [α/Fe] = 0.77, the [α/Fe] slope is−0.10 (rms scatter of
0.12 dex), based on the high-resolution abundances (second
lowest panel in the figure). Also excluding Boo-41 (with
[Fe H/ ] ~ -1.9), as Gilmore et al. (2013) did, increases the
slope to−0.18. Gilmore et al. found −0.19, for comparison.
When adding the combined[α/Fe] measurements of Lai et al.
(2011), the slope decreases to −0.03 (bottom panel of Figure4;
excluding only Boo-119), with an rms scatter of 0.13 dex. The
implications of this behavior will be further discussed in
Section4.
Iron-peak element abundances were obtained from lines as
listed in Table2. The abundances found for our two Boötes I
stars are also in excellent agreement with those of comparable
halo stars(see Figure3). This indicates the robust production of
these elements in Boötes I, in the same way as in other dwarf galaxies and in the halo. This behavior thus appears to be independent of environment.
Finally, Sr and Ba are the only neutron-capture elements detectable in the two stars. Boo-980 has Sr and Ba abundances
similar to those of halo stars with [Fe H/ ] ~ -3, although they
are on the lower end of that range. They are actually rather similar to the abundances of Leo IV-SI in Leo IV studied
by Simon et al. (2010) and two of the Ursa Major II stars
(UMa II-S1, UMa II-S2) of Frebel (2010). This can be seen in
Figure5, where we show both [Sr, Ba/Fe] and [Sr, Ba/H] to
best illustrate the behavior of neutron-capture elements. Boo-127 shows a somewhat different behavior. Its Sr abundance is about 1 dex below the general Sr trend set by halo stars. However, based on about half a dozen data points,
Boo-127 seems to extend an emerging second branch(marked
in thefigure) of Sr abundance about one dex below the main
halo trend. It currently consists mainly of four Ursa Major II and Coma Berenices stars, two more Boötes I stars, together with a few halo stars. Additional measurements of Sr in stars
with [Fe H/ ] > -2 in ultra-faint dwarf galaxies would help to
further investigate the reality of this putative branch, in
particular for Boötes I, as currently only five stars have Sr
measurements.
Boo-1137 also has a Sr abundance indistinguishable from
halo stars. However, its [Sr/H] level is extremely low at
[Sr H/ ] ~ -5. Boo-94 has an even lower value of
[Sr H/ ] ~ -5.4. Compared to Boo-127, this indicates a [Sr/
H] spread of at least 2 dex. The low level of Sr abundances in
these two stars is comparable with that found in Segue 1. Generally, the Ba abundances of all Boötes I stars are somewhat uniformly offset from the main halo star trend. The Ba abundance spread is 1.5 dex, and as in the case of Sr, the lowest Ba abundances are similar to those found in Segue 1.
This behavior will be discussed further in Section4.
Interest-ingly, six Boötes I stars including Boo-127 cluster around
[Ba H/ ] ~ -2.7 and [Fe H/ ] ~ -2.2. These stars also have
other similar abundances and could perhaps represent a
dissolved star cluster candidate (Bland-Hawthorn et al. 2010;
Karlsson et al. 2012) although more accurate abundances are
needed to drawfirm conclusions.
3.3. Comparison of Boo-127 Abundances
Boo-127 was first observed by Feltzing et al. (2009) who
found the star to have unusually high Mg ([Mg Fe/ ] =0.76)
and low Ca ([Ca Fe/ ] =0.02) abundances. However, these
results were not confirmed by Gilmore et al. (2013) or Ishigaki
et al.(2014) who also included this star in their samples. Our
independent observation of Boo-127 also yields much more
moderate values of [Mg Fe/ ] =0.41 and [Ca Fe/ ] =0.24, in
conclude that Boo-127 has no unusual α-abundances, but rather a halo-like signature in these elements.
Figure 6 shows a detailed comparison of various elements
observed in Boo-127 that are common to these four studies.
The[C/Fe] abundance of Norris et al. (2010b) is also included
for comparison. Except for the high Mg abundance of Feltzing
et al. (2009) and the low carbon abundance of Ishigaki et al.
(2014), the abundances agree reasonably well and are within
∼0.3 dex of each other. We note here that Ishigaki et al. (2014)
have systematically lower carbon abundances compared to our
study, Norris et al. (2010b) and Lai et al. (2011) by 0.43 dex
(based on five stars). We note here that the stellar parameters of
all four studies are consistent, however. The effective temperatures agree within 165 K and the surface gravities
within 0.6 dex. The[Fe/H] abundances are remarkably close
and within 0.11 dex. Excluding the Feltzing et al.(2009) results
decreases these ranges to 65 K, 0.25 dex, and 0.07 dex. Since
the Mg b-lines are gravity sensitive(e.g., Hollek et al.2011),
the lower Feltzing et al. gravity choice oflogg=1.0 might, in
retrospect, explain their high Mg abundance.
3.4. Literature Data on Boötes I
In Table4we list the abundances of key elements common
to all studies of Boötes I stars. We list each star’s name as
Figure 3. Abundance ratios ([X/Fe]) as a function of metallicity ([Fe/H]) for various elements detected in our Boötes I stars (filled red circles) in comparison with those of stars in Segue 1(Norris et al.2010a; Frebel et al.2014) (blue open circles) and of halo stars (black and small cyan circles) of Cayrel et al. (2004) and Yong et al.(2013), respectively.
provided by the original authors. We note that this results in an apparently inconsistent system where, e.g., two distinct stars having the names Boo-7 and Boo07. Where applicable, two distinct names for the same star are also indicated. Coordinates for these stars can be found in the references given in the last column.
For many stars, duplicate studies exist. Given authors who use different data and analysis methods, to obtain a set of abundances as internally consistent as possible between studies,
Figure 4. Abundance ratios ([X/Fe]) of α-elements of our two Boötes I stars (full red circles) together with 11 Boötes I stars (filled red circles) as analyzed by Gilmore et al.(2013), Ishigaki et al. (2014), and Feltzing et al. (2009). Segue 1 stellar abundances(Frebel et al.2014) are shown with blue circles, and halo stars in black circles(Cayrel et al.2004) and cyan dots (Yong et al.2013). The bottom two panels show combined [α/Fe] ratios. The bottom panel additionally includes the[α/Fe] of Lai et al. (2011). Fits to the Boötes data points(with Boo-119 excluded; [α/Fe] = 0.77) are also shown.
Figure 5. Abundance ratios of neutron-capture-elements [Sr/Fe] and [Ba/Fe] (top panels) and [Sr/H] and [Ba/H] (bottom panels) as a function of metallicity [Fe/H] of our Boötes I stars (filled red circles) and literature Boötes I stars (open red circles; here Ishigaki et al. 2014 was used for Sr and Gilmore et al.2013for Ba, for internal consistency) in comparison with those of other ultra-faint dwarf galaxy stars in Segue 1(blue circles; Norris et al.2010a; Frebel et al.2014), UMa II, ComBer, Leo IV (green circles; Frebel et al.2010; Simon et al.2010), Draco and Hercules (cyan squares; Fulbright et al.2004; Koch et al.2008,2013), stars in the classical dwarf spheroidal galaxies (pink triangles; Venn et al.2004), and the galactic halo (black open circles; Aoki et al.2005; Barklem et al.2005; François et al.2007and Yong et al.2013). The dashed line is meant to guide the eye regarding a putative second dwarf galaxy star sequence. Note that both axes have the same scale, showing the huge range of neutron-capture abundances in metal-poor stars. Representative error bars are shown in the[Sr/Fe] and [Ba/Fe] panels.
and following the abundance comparison in Figure6, we adopt a
combination of(adjusted) abundances for our analysis and in the
figures shown. Adjustments were made to reflect different iron abundances, e.g., [C Fe/ ]adopted =[C Fe/ ]orig + DFe H/ ].
Generally, we adopted our own and the Gilmore et al.(2013)
abundances (we adopted an average of the “NY” and “GM”
abundances) together with the carbon values from Norris et al.
(2010b). We adjusted the [Sr/Fe] values from Ishigaki et al.
(2014) to the Gilmore et al. scale. We replaced the carbon
abundance upper limits of Ishigaki et al.(2014) with detections
of Norris et al. (2010b). We used the adjusted carbon
abundance of Norris et al. (2010b) together with the adopted
abundances of Feltzing et al. (2009) in the case of Boo-7.
Explanations of which elemental abundances have been used are given in the table notes but for clarity we list our adopted abundances for each star at the bottom of the table.
Regarding abundance uncertainties in [X/Fe], systematic
uncertainties taking into account uncertainties in the stellar parameters as well as random uncertainties are around
0.2–0.3 dex for this kind of data quality (e.g., Table 4 in
Frebel et al. 2014). Keeping this in mind, the various
abundance averages are not significantly affected by our
attempt to construct a homogeneous abundance set and vary by on order 0.1 dex. Nevertheless, even such subtle systematic changes could affect the interpretation, and more generally, are important for comparisons with chemical evolution models.
4. ON THE ORIGIN AND EVOLUTION OF BOÖTES I Using all available abundances of stars in Boötes I, as described in the previous section, we now investigate the global chemical abundance signatures to characterize the origin and history of this ultra-faint dwarf galaxy. In particular, we use
four abundance criteria developed by Frebel & Bromm(2012)
to assess to what extent chemical evolution has taken place in this system and how far removed Boötes I might be from being
a surviving first galaxy, like e.g., Segue 1. The abundance
criteria concern the(a) metallicity distribution function (MDF),
(b) light and iron-peak element abundances, (c) α-elements,
and (d) neutron-capture elements. Under (e) we also add a
discussion on the role of carbon in these early systems. All of
these are discussed in detail below and applied to the body of abundance data currently available for Boötes I.
(a) Iron abundance spread and MDF.This criterion
stipulates that a large spread of 2–3 dex in [Fe/H] as well as
a not too steep MDF shape(especially on the low-metallicity
side) would be signs of early inhomogeneous mixing. The
upper panel of Figure7shows the MDF of Boötes I as obtained
from the sample of 39 stars that includes both
medium-resolution and high-medium-resolution [Fe/H] abundances (Feltzing
et al.2009; Norris et al.2010b,2010c; Lai et al.2011; Gilmore
et al.2013; Ishigaki et al.2014, this work). When available, a
high-resolution value was used for a given star.
A spread in [Fe/H] of 2 dex is apparent, ranging from
[Fe H/ ] ~ -3.8 to [Fe H/ ] ~ -1.8. The lack of stars
[Fe H/ ] > -1.8(when considering high-resolution abundances
where available) is typical for ultra-faint dwarf galaxies (e.g.,
Kirby et al.2008; Frebel et al.2010,2014). The mean value for
Boötes I of [Fe H/ ] = -2.6based on this combined sample is
in line with previous results ([Fe H/ ] = -2.3, Belokurov
et al. 2006; [Fe H/ ] = -2.5, Muñoz et al.2006, Siegel 2006,
Martin et al.2007, and Norris et al.2008; [Fe H/ ] = -2.6, Lai
et al.2011).
From a theoretical viewpoint, chemical inhomogeneity likely
resulted in a large spread in [Fe/H] ranging from
[Fe H/ ] ~ -4.0 up to ~-1.0 (Greif et al. 2011), without a
very pronounced peak in the[Fe/H] distribution. This behavior
is found in Segue 1(Frebel et al.2014) which now presumably
contains only those first Pop II stars. In Boötes I, a similar
population of the earliest Pop II stars could have formed, with
their highest metallicity stars having [Fe H/ ] ~ -2.0. Any
additional Boötes I stars located at and near the peak region of
the MDF might then be stars from the second and/or later
stellar generations formed from more homogeneous gas
enriched by any first/early Pop II supernovae. Still, star
formation must have been rapidly quenched to prevent stars with [Fe H/ ] > -1.8to form.
Regarding the MDF shape, there is a steady increase from
[Fe H/ ] ~ -4.0 to the distinct peak of the distribution at
[Fe H/ ] ~ -2.5. Then, there is a relatively sharp drop-off
toward higher metallicities suggesting that star formation was extinguished rather abruptly, preventing the formation of stars
with [Fe H/ ] > -1.8. The same shape of the metallicity
distribution has also been found in other, more luminous
dwarf galaxies (e.g., Draco and Carina, although they have
higher peak metallicities; Figure 17 of Norris et al. 2010c).
Since this behavior is thus not unique to Boötes I we take it as a
sign of chemical evolution (as opposed to a limited chemical
enrichment), although likely in its early phases given the low
peak metallicity.
Lai et al.(2011) explored the nature of the Boötes I MDF
with simple chemical evolution models, following Kirby et al.
(2011). Taking into account our slightly more populated MDF
which also contains more stars with high-resolution [Fe/H]
measurements, it appears that their leaky-box model with pre-enriched initial gas would best describe the low-metallicity tail of Boötes I. That model begins with pre-enriched gas of low
level of [Fe H/ ] ~ -0 4.0which is close to the assumption of
pristine gas. However, it would simultaneously underpredict the very tall peak region of the MDF. We speculate that this could signify a subsequent population of stars that formed after
the initial generation emerged from gas enriched by thefirst/
early Pop II supernovae.
Figure 6. Abundance ratios ([X/Fe]) of the four different studies that analyzed Boo-127 as a function of atomic number. In the case of iron,[Fe/H] − [Fe/ H]Boo 127,this study‐ is shown on the y-axis. Symbols are as follows: red circles:
this work; green triangles: Gilmore et al.(2013); black crosses: Ishigaki et al. (2014); blue squares: Feltzing et al. (2009); and cyan asterisk: Norris et al. (2010b).
Table 4
Chemical Abundances of Key Elements of Boötes I Stars from the Literature
Name Teff logg [Fe/H] [C/Fe] [Mg/Fe] [Ca/Fe] [Ti/Fe] [Sr/Fe] [Ba/Fe] Comment References Boo02 5114 2.00 −2.37 0.36 0.28a K K K K med-res LAI11 Boo03 5127 1.99 −3.09 0.79 0.43a K K K K med-res LAI11 Boo04 5210 2.68 −2.39 0.34 0.35a K K K K med-res LAI11 Boo05 5077 2.55 −2.89 <0.00 0.05a K K K K med-res LAI11 Boo06 5404 2.40 −2.20 0.64 0.32a K K K K med-res LAI11 Boo07 5200 2.54 −2.49 0.39 0.16a K K K K med-res LAI11 Boo-7 4800 1.60 −2.32 −0.50 K K K K K med-res NOR10
K K −2.33 K 0.30 0.23 K K −0.75 high-res FEL09b,c Boo08 5178 2.30 −2.48 0.32 0.18a K K K K med-res LAI11 Boo-8 5090 2.30 −2.75 0.60 K K K K K med-res NOR10 Boo09 5563 2.44 −2.65 0.90 0.37a K K K K med-res LAI11 Boo-9 4630 1.10 −2.67 −0.55 K K K K K med-res NOR10
4750 1.40 −2.64 <−0.29 0.13 0.18 0.27 K −0.89 high-res ISH14b,c Boo10 5086 2.42 −2.59 <0.00 K K K K K med-res LAI11 Boo11 5199 2.65 −2.43 −0.05 0.05a K K K K med-res LAI11 Boo12 5168 2.19 −2.48 0.24 0.04a K K K K med-res LAI11 Boo13 5631 2.35 −2.49 <0.00 0.23a K K K K med-res LAI11 Boo14 5971 2.56 −2.57 <0.00 0.34a K K K K med-res LAI11 Boo15 5117 2.31 −2.89 <0.00 0.30a K K K K med-res LAI11 Boo18 5287 2.27 −2.51 0.44 0.13a K K K K med-res LAI11 Boo19 5141 2.38 −3.29 0.40 0.28a K K K K med-res LAI11
Boo20 4931 2.44 −2.42 −0.35 0.13a K K K K med-res LAI11
Boo22 4866 1.93 −2.87 −0.16 0.12a K K K K med-res LAI11
Boo23 5475 2.83 −2.90 1.86 0.16a K K K K med-res LAI11
Boo25 5141 2.02 −2.76 1.34 0.25a K K K K med-res LAI11
Boo28 5449 3.29 −2.31 0.27 0.06a K K K K med-res LAI11
Boo30 5449 3.29 −1.86 0.38 0.51a K K K K med-res LAI11
Boo-33 4730 1.40 −2.29 0.30 K K K K K med-res NOR10 4600 1.00 −2.52 K 0.69 0.40 K K −0.40 high-res FEL09 4740 1.40 −2.32 K 0.26 0.14 −0.02 K −0.35 high-res GIL13b,c
Boo-34 4840 1.60 −3.10 0.55 K K K K K med-res NOR10 Boo-41 4750 1.60 −1.93 −0.65 K K K K K med-res NOR10 (=Boo24) 4798 1.63 −1.65 −0.80 0.46a K K K K med-res LAI11
4750 1.50 −1.88 K 0.50 0.28 0.78 K −0.39 high-res GIL13b,c
Boo-78 4950 1.90 −2.46 −0.15 K K K K K med-res NOR10 Boo-94 4570 0.80 −2.90 −0.45 K K K K K med-res NOR10 4600 0.50 −2.95 K 0.47 K 0.22 K K high-res FEL09 4560 0.80 −2.94 K 0.49 0.30 0.26 K −0.95 high-res GIL13b,c,d 4500 0.80 −3.18 <0.25 0.39 0.46 0.55 −2.16 −0.80 high-res ISH14 Boo-117 4700 1.40 −2.25 −0.30 K K K K K med-res NOR10 (=Boo01) 4716 1.65 −2.34 −0.50 0.12a K K K K med-res LAI11
4600 1.00 −2.29 K 0.22 0.29 K K −0.46 high-res FEL09 4725 1.40 −2.18 K 0.18 0.20 0.14 K −0.65 high-res GIL13b,c,d 4750 1.50 −2.15 −0.79 0.04 0.01 0.44 −1.12 −0.43 high-res ISH14 Boo-119 4770 1.40 −3.33 K 1.04 0.46 0.80 K −1.00 high-res GIL13c,e
(=Boo21) 4775 1.48 −3.79 2.20 0.27a K K K K med-res LAI11 Boo-121 4630 1.10 −2.37 −0.25 K K K K K med-res NOR10
K K −2.44 K 0.62 0.38 K K −0.43 high-res FEL09 4500 0.80 −2.49 <−0.24 0.20 0.24 0.07 K −0.63 high-res ISH14b,c Boo-127 4670 1.40 −2.08f −0.25 K K K K K med-res NOR10
4600 1.00 −2.03 K 0.76 0.02 K K − 0.64 high-res FEL09 4685 1.40 −2.01 K 0.17 0.16 0.20 K −0.69 high-res GIL13 4750 1.60 −1.92 −0.77 0.11 0.19 0.20 −1.44 −0.87 high-res ISH14 4765 1.35 −1.99 −0.15 0.41 0.24 0.33 −1.20 −0.75 high-res this studyb
Boo-130 4750 1.40 −2.29 −0.40 K K K K K med-res NOR10 4775 1.40 −2.32 K 0.21 0.19 0.17 K −0.54 high-res GIL13b,c,d Boo-911 4540 1.10 −1.98 −0.55 K K K K K med-res NOR10
K K −2.26 K 0.11 0.40 K K −0.56 high-res FEL09 4500 0.90 −2.16 −0.77 0.35 −0.01 0.02 K −0.64 high-res ISH14b Boo-980 4890 1.70 −3.09 0.00 K K K K K med-res NOR10
4720 1.40 −3.06 −0.40 0.29 0.30 0.43 −0.95 −1.23 high-res this studyb Boo-1069 5050 2.20 −2.51 −0.35 K K K K K med-res NOR10 Boo-1137 4710 1.20 −3.66 0.20 K K K K K med-res NOR10 4700 1.20 −3.66 0.25 0.47 0.52 0.52 −1.42 −0.59 high-res NOR10bb
(b) Core-collapse supernova signatures.This criterion
stipulates that light elements (including iron-peak elements)
observed in early dwarf galaxy stars should match those of equivalent metal-poor halo stars as core-collapse supernovae are believed to be the progenitors of these elements. As can be
seen in Figure3, the observed abundances of stars in Boötes I
are in good agreement with metal-poor halo star abundances, in line with a fast enrichment in the earliest dwarf galaxies.
(c) α-element abundances: late-time star formation?This
criterion stipulates that theα-elements (Mg, Si, Ca, Ti) should
show enhanced abundances of ∼0.4 dex due to core-collapse
supernova as progenitors for all stars, even at high(er)
metallicities ([Fe H/ ] > -2.0) since it implies that no stars
formed after (any) late-time enrichment of iron by Type Ia
supernovae. This would support that only one/few generations
of early Pop II stars formed in a system.
As noted by previous author(e.g., Gilmore et al. 2013), the
α-element abundances of stars in Boötes I do not provide a
clear picture. Consideration of the individualα-elements, e.g.,
in Figure4, shows that all stars have[Mg/Fe] high-resolution
abundance ratios in agreement with halo stars. For[Ca/Fe] and
[Ti/Fe], most Boötes I stars have typical halo values but there are also several outliers with abundance near the solar ratio.
However, in all cases, the 2–3 most metal-rich stars do not
have the lowest abundances but rather halo-like values. In
fact, the highest metallicity star(Boo-41) has one of the highest
α-element abundances ([α/Fe] = 0.52). This supports Boötes I containing those early Pop II stars, although not exclusively.
The combined α-element abundances are then helpful to
assess whether Boötes I experienced late time, extended star
formation as evidenced by low(er) α-abundances. This is
illustrated in Figure8. In the bottom two panels, we show the
Boötes I abundances together with abundances of other ultra-faint dwarf galaxies as well as those of stars in the classical
dwarf spheroidal galaxies. Several Boötes I stars have abundances resembling those of the halo, Segue 1, and other ultra-faint dwarf galaxy stars, while many others have values
very similar to those of the classical dwarf galaxy stars (21
have[α/Fe] < 0.3 and 16 [α/Fe] < 0.2).
It thus appears like Boötes I is a system that was assembled
from or absorbed one(or a few) smaller building block type
objects(e.g., minihalos) like Segue 1 before forming more stars
and experiencing a chemical evolution (as opposed to just
chemical enrichment as, e.g., in Segue 1) that would eventually
lead to stars with low α-abundances. Such a two-population
scenario is qualitatively in line what was found based on the CEMP and non-CEMP star MDF components of Boötes I.
More preciseα-element abundances will be needed for all stars
(e.g., recall that Lai et al. 2011 only provided a combined
α-measurement) to conclusively determine whether any late-time enrichment by Type Ia supernovadid indeed occur in Boötes I. This would indicate extended star formation possibly due to gas accretion from other clouds or cloud fragments in the system or an early merger with a different system that
would have brought in extra gas(Smith et al.2015).
(d) Low and unusual neutron-capture element abundances:
evidence for one progenitor generation?This criterion
stipu-lates that abundances of heavy neutron-capture elements(e.g.,
Sr and Ba) should be very low since it implies that no stars
formed after late(r) time enrichment associated with the
s-process operating in asymptotic giant branch (AGB) stars.
Small amounts of neutron-capture elements, primarily with [Sr/Ba] ratios characteristic of the r-process (occurring in
supernovae) could, however, be present in the system without
implying late-time star formation.
We have already discussed that the neutron-capture elements
Sr and Ba are of low abundance in Boötes I (Figure 5).
Specifically, the Sr abundances are not like those of halo stars
Table 4 (Continued)
Name Teff logg [Fe/H] [C/Fe] [Mg/Fe] [Ca/Fe] [Ti/Fe] [Sr/Fe] [Ba/Fe] Comment References
Adopted abundances of high-resolution spectroscopic studies
Boo-7 K K −2.33 −0.49(0.07g) 0.30 0.23 K K −0.75 high-res FEL09, NOR10 Boo-9 4750 1.40 −2.64 −0.58(−0.02g) 0.13 0.18 0.27 K −0.89 high-res ISH14, NOR10
Boo-33 4740 1.40 −2.32 0.29(0.74g) 0.26 0.14 −0.02 K −0.35 high-res GIL13, NOR10
Boo-41 4750 1.50 −1.88 −0.78(−0.24g) 0.50 0.28 0.78 K −0.39 high-res GIL13, NOR10 Boo-94 4560 0.80 −2.94 −0.44(0.31g) 0.49 0.30 0.26 −2.43 −0.95 high-res GIL13, NOR10, ISH14 Boo-117 4725 1.40 −2.18 −0.50(0.04g) 0.18 0.20 0.14 −1.22 −0.65 high-res GIL13, NOR10, ISH14 Boo-119 4770 1.40 −3.33 1.85(2.16g) 1.04 0.46 0.80 K −1.00 high-res GIL13, LAI11
Boo-121 4500 0.80 −2.49 −0.13(0.62g) 0.20 0.24 0.07 K −0.63 high-res ISH14, NOR10
Boo-127 4765 1.35 −1.99 −0.15(0.37g) 0.41 0.24 0.33 −1.20 −0.75 high-res FRE14
Boo-130 4775 1.40 −2.32 −0.41(0.17g) 0.21 0.19 0.17 K −0.54 high-res GIL13, NOR10 Boo-911 4500 0.90 −2.16 −0.77(−0.01g) 0.35 −0.01 0.02 K −0.64 high-res ISH14 Boo-980 4720 1.40 −3.06 −0.40(0.13g) 0.29 0.30 0.43 −0.95 −1.23 high-res FRE14 Boo-1137 4700 1.20 −3.66 0.25(0.90g) 0.47 0.52 0.52 −1.42 −0.59 high-res NOR10b
Notes. Note the different numbering schemes, e.g., Boo07 and Boo-7 do not refer to the same star. Different designations for the same star are indicated.
a
These values are[α/Fe], not [Mg/Fe].
b
Abundances from this study have been adopted for this star.
c[C/Fe] values of Norris et al. (
2010b), adjusted for the different [Fe/H] abundances, were used.
d
[Sr/Fe] values of Ishigaki et al. (2014), adjusted for the different [Fe/H] abundances, were used.
e
[C/Fe] values of Lai et al. (2011), adjusted for the different [Fe/H] abundances, was used.
f
[Fe/H] from Norris et al. (2010b) is based on early analysis of a high-resolution UVES spectrum. The medium-resolution value is [Fe H/ ] = -1.49.
g
Final carbon abundances corrected for evolutionary status of the star(following Placco et al.2014) is given in parenthesis.
References. FEL09: Feltzing et al. (2009); NOR10: Norris et al. (2010b); NOR10b: Norris et al. (2010c); LAI11: Lai et al. (2011); GIL13: Gilmore et al. (2013); ISH14: Ishigaki et al.(2014); FRE14: this study. “med-res” refers to medium-resolution spectroscopy results, “high-res” refers to high-resolution spectroscopy results.
but up to ∼1 dex lower. Ba does roughly follow the halo star abundance trend but all Boötes I stars still have abundances that place them at the lower edge of the region covered by halo data. In addition, the spread in neutron-capture element abundances in Boötes I, as evidenced by only four stars, is about 1 dex. This precludes overarching statements regarding the exact neutron-capture process responsible for this material.
The stars with [Sr Ba/ ] ~ -0.5 ratio technically fall in the
regime of the r-process (we note that most Segue 1 stars are
also near this value). The s-process is characterized by
[Sr Ba/ ] < -1.0and indeed one Boötes I star has such a low
[Sr/Ba] value. Overall, this is consistent with Boötes I being an old system that formed its stars early and relatively quickly, before the onset of any regular AGB star-based s-process element enrichment. Consequently, fast neutron-capture enrich-ment might have occurred by just one of the earliest generations of massive stars in the system.
In Figure9, there exists no obvious correlation between[Sr/
Ba] and [Fe/H]. When plotting [Sr/Ba] versus [Ba/Fe] (see
bottom panel), however, a clear trend emerges. Interestingly,
the halo stars form a distinct branch while the various dwarf galaxy stars form something that resembles a second sequence below the halo branch. The few Boötes I stars with measured Sr abundances follow this trend set by the UMa II, ComBer, Leo IV, and three Segue 1 stars. Some halo stars do exhibit similar neutron-capture element characteristics to those of the dwarf galaxy stars. This might indicate that these halo stars are stars that originated in small dwarf galaxies similar to those in the surviving ultra-faint dwarfs. While more data for ultra-faint
dwarf galaxy stars is clearly needed to more firmly establish
this second sequence, perhaps also more halo data could help
Figure 7. Metallicity distribution function for Boötes I. Note the lack of metal-rich stars above[Fe H/ ] = -1.8. Top panel: complete sample of 39 stars. Bottom panel: red histogram depicts CEMP stars with [C Fe/ ] >0.7, black histogram the remaining non-CEMP stars. See part (e) of this section for additional discussion about the CEMP histogram.
Figure 8. Combined Mg–Ca–Ti α-element abundances as diagnostic of early star formation; adapted from Frebel & Bromm (2012). Top: schematic representation of chemical enrichment in the [α/Fe] vs. [Fe/H] plane for different environments. The dotted line indicates the solar ratio. Second: high-resolutionα-abundances of metal-poor stars from Cayrel et al. (2004) (halo) and Fulbright(2000) (thin/thick disk). The diagonal dotted lines indicate the enrichment behavior of the dSph galaxies(see top panel). A representative uncertainty is shown. Third: the yellow shaded region around[α/Fe] = 0.35 depicts the predicted Frebel & Bromm(2012) one-shot enrichment behavior (with a 0.15 dex observational uncertainty) reflecting massive core-collapse supernova enrichment. Several evolutionary paths are indicated with dashed lines. High-resolutionα-abundances of metal-poor stars are shown; For ultra-faint dwarf galaxies: Boötes I stars, this study(filled red circles); Boötes I, literature(open red circles, see the text for references); Segue 1 (blue circles; Norris et al.2010a; Frebel et al.2014); Ursa Major II and Coma Berenices (green circles; Frebel 2010); Leo IV (pink circle; Simon et al. 2011); and Hercules(cyan squares; Koch et al.2008). For classical dSphs (small open black circles; see Frebel & Bromm2012and references therein). Bottom: same as above but with only the Boötes I stars that include the[α/Fe] measurements of Lai et al.(2011).
shape up any of the differences between the halo star branch and the dwarf galaxy sequence even more clearly.
Using neutron-capture element abundances is clearly a promising way path to learn not only about the nature of the host dwarf galaxy but also about the origin of halo stars. Lighter element abundances have been repeatedly shown to all agree with each other for halo and dwarf galaxy stars making it more challenging to use them as a discriminator.
Alternatively, the distinct patterns of halo stars and dwarf galaxy stars could originate from highly inhomogeneous enrichment of their respective birth gas clouds. However,
while this would explain the large spreads in [element/H]
abundance ratios such as[Fe/H] or [Sr/H], [element/element]
ratios should in principle be hardly affected (Frebel &
Bromm 2012). Indeed, the lighter elements show tight
[element/Fe] ratios and support this possibility. In turn, the
large spread in[Sr/Ba] might indicate that the two elements are
not produced with a strong correlation between them as the fusion-produced elements are, or that metal mixing did not play a primary role.
(e) Carbon enrichment: prevalent at early times?After applying carbon abundance corrections according to stellar
evolutionary status(see Table4), there are eight CEMP stars in
Boötes I with metallicities below [Fe H/ ] -2.6. Incidentally,
the CEMP stars are all CEMP-no stars and rather equally distributed among the lower metallicity half of all Boötes I stars.
All stars have[C/H] values higher than [C H/ ] = -3.4placing
them well above the critical carbon and oxygen abundance
criterion ofD =log 10( [ ]+0.3´10[ ])= -3.5
trans C H/ O H/ that
may have facilitated their formation from carbon and oxygen
enriched gas in the early universe(Frebel et al.2007). Carbon
must thus have played an important role in the early evolution of Boötes I.
[C/H] ratios of the Boötes I sample do not show a clear trend
with either [Fe/H] orlog , although the sample does followg
the overall carbon abundance range given by halo stars (see
Figure 2, also for references). The CEMP stars in Boötes I
increasingly appear all at lower metallicities, at
[Fe H/ ] -2.6. Generally, the high-carbon outliers may
indicate that the production of carbon and iron and their subsequent mixing into the gas has been decoupled or that CEMP and non-CEMP signatures have been produced at different sites. For a more extended discussion on the origin of
CEMP stars, we refer the reader to Norris et al.(2013) or Frebel
& Norris(2015).
Cooke & Madau(2014) suggested a minihalo environment
as a site for CEMP star formation with faint fall-back first
supernovae (e.g., Umeda & Nomoto 2003) responsible for
large quantities of lighter elements such as carbon but for less or none of the heavier ones like iron. The bottom panel of
Figure7 shows the separate MDFs for CEMP stars(red) and
non-CEMP stars (black). The CEMP stars cluster at low
metallicities albeit with some spread in[Fe/H]. But chemical
inhomogeneity could possibly account for this(e.g., Frebel &
Bromm2012). These CEMP stars thus might have formed in a
minihalo environment that would later become Boötes I or part of Boötes I.
The non-CEMP star MDF lacks the pronounced
low-metallicity tail and an average low-metallicity of[Fe H/ ] = -2.5.
This leaves the MDF to be more like the one predicted by the
leaky-box chemical evolution model with extra gas (Kirby
et al. 2011; Lai et al. 2011). This incorporates an additional
reservoir of gas available to the galaxy from which to form stars. A merger of said minihalo with another early halo (presumably prior to it forming any stars) could have provided
this gas. Thesefindings build in some way on the conclusions
of Gilmore et al.(2013) who suggest that the “CEMP-no” stars
(our “CEMP stars”) formed rapidly and prior to the “normal
branch” (our “non-CEMP” stars).
More generally, massive rotating Pop III“spinstars” (Meynet
et al.2006; Chiappini et al. 2011) could have dominated the
enrichment of Boötes I at the earliest times by providing large amounts on carbon to the star forming gas prior to their
explosions. Fall-back supernovae (Umeda & Nomoto 2003)
could have been equally responsible for high[C/Fe] ratios in
environments more massive than minihalos. Regardless, the
earliest low-mass stars would likely show a variety of [C/Fe]
Figure 9. [Sr/Ba] abundance ratios as a function of [Fe/H] (top panel) and [Ba/Fe] (bottom panel) of our Boötes I stars (filled red circles) and literature Boötes I stars(open red circles; here the Ishigaki et al.2014values were used for internal consistency) in comparison with those of other ultra-faint dwarf galaxy stars in Segue 1(blue circles; Norris et al.2010a; Frebel et al.2014), UMa II, ComBer, Leo IV(green circles; Frebel et al.2010; Simon et al.2010), and the galactic halo (black open circles; Barklem et al. 2005 and Yong et al.2013).
ratios, and a clear trend would only emerge with the onset of more regular Pop II supernovae and extended star formation.
5. CONCLUSION
We have studied the stellar chemical abundances of Boötes I with high-resolution spectroscopy, including a previously unobserved member star. Considering all available abundance data, we examined Boötes I in light of several criteria for
identifying the earliest galaxies. Theα- and carbon abundances
suggest two potential populations, although more precise
abundances are required to drawfirm conclusions.
Considera-tions of these chemical signatures alone suggests that Boötes I
is not a surviving first galaxy but an already somewhat
assembled system that could have been built up from a
minihalo (a first galaxy) in which the CEMP stars formed
(Cooke & Madau2014), and then merged with another
metal-free or metal-poor halo (or large gas clouds or filaments) that
resulted in an injection of fresh gas triggering star formation and leading to a second population of stars. Both populations
show [Fe/H] spreads of >1 dex which is in line with
predictions of chemical inhomogeneity (e.g., Frebel &
Bromm 2012) and expected for such early star formation.
Similar results have also been derived by Romano et al.
(2015) who modeled the formation and chemical evolution of
Boötes I. They conclude that Boötes I formed from accretion of
a baryonic mass Mb~107 M of gas over a very short
timescale of order 50 Myr. This is also in agreement with what
was already qualitatively predicted by Gilmore et al. (2013)
who found that the CEMP stars formed rapidly and prior to the non-CEMP stars.
All thesefindings are highly consistent with results based on
deep Hubble Space Telescope photometry. Brown et al.(2014)
found Boötes I to currently consist of two ancient stellar
populations of 13.4 Gyr(containing 3% of stars) and 13.3 Gyr
(97% of stars). We note, however, that these ages are relative to the globular cluster M92, and assuming its age to be 13.7 Gyr. Nevertheless, it is apparent that all the dwarf galaxies contain one ancient dominant stellar population plus a small age spread. The two-population scenario follows Koposov et al.
(2011) who also found that Boötes I is best described with two
components, based on a kinematic analysis. They identified a
“colder” (∼3 km s−1) component (containing 70% of stars) and
a “hotter” ∼9 km s−1 component (30% of stars). In addition,
they suggested that the colder component has “an extremely
extended, very metal-poor, low-velocity dispersion
comp-onent”. The chemical abundances and the MDF available for
Boötes I stars clearly show the existence of such a
low-metallicity tail (see Figure 7) which is mainly composed of
CEMP stars.
In summary, evidence based on multiple independent approaches suggests Boötes I to be an ancient system with two stellar populations of which at least the more metal-poor
one likely consisted of thefirst low-mass stars that formed in its
progenitor halo(s). This makes Boötes I an assembled system
with a more complex evolution than what would be expected of a surviving galactic building block, such as Segue 1. Never-theless, Boötes I is likely one of the earliest galaxies to have
formed. Not just for its age of ∼13.4 Gyr (Brown et al.2014)
but also because we seem to be witnessing what is the product of two systems, one minihalo and one larger halo which merged to form Boötes I. To some extent this outcome is
already indicated by its larger luminosity of nearly ∼105L,
compared to e.g., Segue 1 with only about ∼103 L. This
leaves the question as to whether an average metallicity of an early galaxy is a useful quantify if more than one population contributes stars in different metallicity ranges. Ideally, one
could cleanly disentangle the population(s) to report separate
results. This might work for Boötes I but will surely become impossible for more complex, more luminous systems.
More ultra-faint galaxies need to be extensively studied with photometry and spectroscopy from a chemical and kinematic point of view to assess the nature of as many as possible of the faint dwarfs currently known. Only then can be better understand the early evolution of galaxies and the details of the associated star formation, chemical enrichment and overall growth mechanisms and timescales of these ancient systems.
A.F. is supported by NSF CAREER grant AST-1255160.
She also acknowledges support from the Silverman (1968)
Family Career Development Professorship. Studies at RSAA,
ANU, of the Galaxy’s most metal-poor stars and ultra-faint
satellite systems are supported by Australian Research Council grants DP0663562, DP0984924, DP120100475, and DP150100862 which J.E.N. gratefully acknowledges. This
work made use of NASA’s Astrophysics Data System
Bibliographic Services.
Facility: Magellan-Clay(MIKE).
REFERENCES
Adén, D., Eriksson, K., Feltzing, S., et al. 2011,A&A,525, 153 Alonso, A., Arribas, S., & Martínez-Roger, C. 1999,A&AS,140, 261 Aoki, W., Beers, T. C., Christlieb, N., et al. 2007,ApJ,655, 492 Aoki, W., Honda, S., Beers, T. C., et al. 2005,ApJ,632, 611
Asplund, M., Grevesse, N., Sauval, A. J., & Scott, P. 2009,ARA&A,47, 481 Barklem, P. S., Christlieb, N., Beers, T. C., et al. 2005,A&A,439, 129 Beers, T. C., & Christlieb, N. 2005,ARA&A,43, 531
Belokurov, V., Zucker, D. B., Evans, N. W., et al. 2006,ApJL,647, L111 Bernstein, R., Shectman, S. A., Gunnels, S. M., Mochnacki, S., & Athey, A. E.
2003,Proc. SPIE,4841, 1694
Bland-Hawthorn, J., Krumholz, M. R., & Freeman, K. 2010,ApJ,713, 166 Brown, T. M., Tumlinson, J., Geha, M., et al. 2014, MmSAI,85, 493 Casey, A. R. 2014, arXiv:1405.5968
Castelli, F., & Kurucz, R. L. 2004, arXiv:astro-ph/0405087 Cayrel, R., Depagne, E., Spite, M., et al. 2004,A&A,416, 1117 Chiappini, C., Frischknecht, U., Meynet, G., et al. 2011,Natur,472, 454 Cooke, R. J., & Madau, P. 2014,ApJ,791, 116
Feltzing, S., Eriksson, K., Kleyna, J., & Wilkinson, M. I. 2009,A&A,508, L1 François, P., Depagne, E., Hill, V., et al. 2007,A&A,476, 935
Frebel, A. 2010,AN,331, 474
Frebel, A., & Bromm, V. 2012,ApJ,759, 115
Frebel, A., Casey, A. R., Jacobson, H. R., & Yu, Q. 2013,ApJ,769, 57 Frebel, A., Johnson, J. L., & Bromm, V. 2007,MNRAS,380, L40 Frebel, A., & Norris, J. E. 2015,ARA&A,53, 631
Frebel, A., Simon, J. D., Geha, M., & Willman, B. 2010,ApJ,708, 560 Frebel, A., Simon, J. D., & Kirby, E. N. 2014,ApJ,786, 74
Fulbright, J. P. 2000,AJ,120, 1841
Fulbright, J. P., Rich, R. M., & Castro, S. 2004,ApJ,612, 447 Gilmore, G., Norris, J. E., Monaco, L., et al. 2013,ApJ,763, 61 Greif, T. H., Springel, V., White, S. D. M., et al. 2011,ApJ,737, 75 Hollek, J. K., Frebel, A., Roederer, I. U., et al. 2011,ApJ,742, 54 Hughes, J., Wallerstein, G., & Bossi, A. 2008,AJ,136, 2321
Hughes, J., Wallerstein, G., Dotter, A., & Geisler, D. 2014,MNRAS,439, 788 Ishigaki, M. N., Aoki, W., Arimoto, N., & Okamoto, S. 2014, A&A,
562, A146
Ji, A. P., Frebel, A., & Bromm, V. 2015,MNRAS,454, 659 Ji, A. P., Frebel, A., Chiti, A., & Simon, J. D. 2016a,Natur,531, 610 Ji, A. P., Frebel, A., Simon, J. D., & Geha, M. 2016b,ApJ,817, 41 Jordi, K., Grebel, E. K., & Amman, K. 2006,A&A,460, 339
Karlsson, T., Bland-Hawthorn, J., Freeman, K. C., & Silk, J. 2012, ApJ, 759, 111
Kim, Y.-C., Demarque, P., Yi, S. K., & Alexander, D. R. 2002,ApJS,143, 499 Kirby, E. N., Lanfranchi, G. A., Simon, J. D., Cohen, J. G., & Guhathakurta, P.
2011,ApJ,727, 78
Kirby, E. N., Simon, J. D., Geha, M., Guhathakurta, P., & Frebel, A. 2008,
ApJL,685, L43
Koch, A., Feltzing, S., Adén, D., & Matteucci, F. 2013,A&A,554, A5 Koch, A., McWilliam, A., Grebel, E. K., Zucker, D. B., & Belokurov, V. 2008,
ApJL,688, L13
Koch, A., & Rich, R. M. 2014,ApJ,794, 89
Koposov, S. E., Gilmore, G., Walker, M. G., et al. 2011,ApJ,736, 146 Lai, D. K., Lee, Y. S., Bolte, M., et al. 2011,ApJ,738, 51
Martin, N. F., Ibata, R. A., Chapman, S. C., Irwin, M., & Lewis, G. F. 2007,
MNRAS,380, 281
Meynet, G., Ekström, S., & Maeder, A. 2006,A&A,447, 623
Muñoz, R. R., Carlin, J. L., & Frinchaboy, P. M. a. 2006,ApJL,650, L51 Norris, J. E., Gilmore, G., Wyse, R. F. G., et al. 2008,ApJL,689, L113 Norris, J. E., Gilmore, G., Wyse, R. F. G., Yong, D., & Frebel, A. 2010a,
ApJL,722, L104
Norris, J. E., Wyse, R. F. G., Gilmore, G., et al. 2010b,ApJ,723, 1632
Norris, J. E., Yong, D., Bessell, M. S., et al. 2013,ApJ,762, 28
Norris, J. E., Yong, D., Gilmore, G., & Wyse, R. F. G. 2010c, ApJ, 711, 350
Okamoto, S., Arimoto, N., Yamada, Y., & Onodera, M. 2012,ApJ,744, 96 Placco, V. M., Frebel, A., Beers, T. C., & Stancliffe, R. J. 2014,ApJ,797, 21 Romano, D., Bellazzini, M., Starkenburg, E., & Leaman, R. 2015,MNRAS,
446, 4220
Siegel, M. H. 2006,ApJL,649, L83
Simon, J. D., Frebel, A., McWilliam, A., Kirby, E. N., & Thompson, I. B. 2010,ApJ,716, 446
Simon, J. D., Geha, M., Minor, Q. E., et al. 2011,ApJ,733, 46
Smith, B. D., Wise, J. H., O’Shea, B. W., Norman, M. L., & Khochfar, S. 2015,MNRAS,452, 2822
Sneden, C. A. 1973, PhD thesis, The Univ. Texas
Sobeck, J. S., Kraft, R. P., Sneden, C., et al. 2011,AJ,141, 175 Umeda, H., & Nomoto, K. 2003,Natur,422, 871
Venn, K. A., Irwin, M., Shetrone, M. D., et al. 2004,AJ,128, 1177 Webster, D., Frebel, A., & Bland-Hawthorn, J. 2016,ApJ,818, 80 Yong, D., Norris, J. E., Bessell, M. S., et al. 2013,ApJ,762, 26

![Figure 2. [C/Fe] abundance ratios (corrected for the evolutionary status of the stars ) as a function of [ Fe / H ] ( top panel ) and surface gravity ( bottom panel ) of our Boötes I stars (fi lled red circles ) and literature Boötes I stars ( open red circ](https://thumb-eu.123doks.com/thumbv2/123doknet/14280465.491543/5.918.62.441.113.788/figure-abundance-corrected-evolutionary-function-boötes-literature-boötes.webp)
![Figure 4. Abundance ratios ([ X / Fe ]) of α -elements of our two Boötes I stars ( full red circles ) together with 11 Boötes I stars (fi lled red circles ) as analyzed by Gilmore et al](https://thumb-eu.123doks.com/thumbv2/123doknet/14280465.491543/8.918.487.848.73.699/figure-abundance-elements-boötes-circles-boötes-analyzed-gilmore.webp)
![Figure 6. Abundance ratios ([ X / Fe ]) of the four different studies that analyzed Boo-127 as a function of atomic number](https://thumb-eu.123doks.com/thumbv2/123doknet/14280465.491543/9.918.71.435.76.326/figure-abundance-ratios-different-studies-analyzed-function-atomic.webp)
![Figure 7. Metallicity distribution function for Boötes I. Note the lack of metal- metal-rich stars above [ Fe H/ ] = - 1.8](https://thumb-eu.123doks.com/thumbv2/123doknet/14280465.491543/12.918.482.851.74.599/figure-metallicity-distribution-function-boötes-note-metal-metal.webp)
