Aalborg Universitet
CLIMA 2016 - proceedings of the 12th REHVA World Congress
Heiselberg, Per Kvols
Publication date: 2016
Document Version
Publisher's PDF, also known as Version of record
Link to publication from Aalborg University
Citation for published version (APA):
Heiselberg, P. K. (Ed.) (2016). CLIMA 2016 - proceedings of the 12th REHVA World Congress: volume 10. Aalborg: Aalborg University, Department of Civil Engineering.
General rights
Copyright and moral rights for the publications made accessible in the public portal are retained by the authors and/or other copyright owners and it is a condition of accessing publications that users recognise and abide by the legal requirements associated with these rights. ? Users may download and print one copy of any publication from the public portal for the purpose of private study or research. ? You may not further distribute the material or use it for any profit-making activity or commercial gain
? You may freely distribute the URL identifying the publication in the public portal ?
Take down policy
If you believe that this document breaches copyright please contact us at [email protected] providing details, and we will remove access to the work immediately and investigate your claim.
Towards nzeb goal for newly built office buildings in Europe using
high temperature cooling.
Francois Randaxhe#1, Vincent Lemort#1, Jean Lebrun*2
# Thermodynamics and Energetics Laboratory, University of Liege
Allee de la decouverte, 4000 Liege, Belgium
*JCJ Energetics
Boulevard Gustave Kleyer 166, 4000 Liege, Belgium
Abstract
In the design phase of a building, many HVAC systems options are available to satisfy the basic requirements related to its use. The design engineer is responsible for considering various systems and recommending a system that will meet the project goals and perform as desired. In addition, high efficiency requirements are imposed to the HVAC equipments through strong regional regulation such as the Energy Performance of Buildings Directive which requires minimum efficiency of HVAC equipments in the market. In reaction, major improvements have been made by manufacturers to improve the performance of their systems and meet all these criteria. With the nearly zero energy goal for all newly constructed buildings in Europe after 2020, it seems very likely that the design of the future building should rely on today’s technology to meet these targets. The integration of High Temperature Cooling in buildings can bring a fresh perspective in this context. The study presents the sensitivity analysis of a primary system to chilled water supply temperature for a water cooled chiller with a cooling tower and a free-chilling heat exchanger. It allows a proper assessment of the impact of the chilled water temperature on the primary system performance.
Keywords – HVAC design; nzeb; high temperature cooling; free-chilling
1.
IntroductionIn the design phase of a building, many HVAC systems options are available to satisfy the basic requirements related to its use. The design engineer is responsible for considering various systems and recommending a system that will meet the project goals and perform as desired. In addition, high efficiency requirements are imposed to the HVAC equipments through strong regional regulation such as the Energy Performance of Buildings Directive (EPBD) in European Union which requires minimum efficiency of HVAC equipments in the market. In reaction, major improvements have
been made by manufacturers to improve the performance of their systems and meet all these criteria. Current technologies in the market have now only a small window of opportunity for improvements still open [1]. With the nearly zero energy goal for all newly constructed buildings in Europe after 2020, it seems very likely that the design of the future building should rely on today’s technology to meet these targets. The integration of High Temperature Cooling (HTC) in buildings can bring a fresh perspective in this context.
This study presents the sensitivity analysis of a primary system to the chilled water supply temperature. The system is composed of a water cooled chiller with a cooling tower and a free-chilling heat exchanger. The analysis of the system is based on semi-empirical model tuned with manufacturer data at full and part load in large range of operation. This section allows a proper assessment of the impact of the chilled water temperature on the primary system performance and give a first overview of possible optimization guidelines.
In the final part of the paper, the analysis is extended to the whole HVAC system integrated in a high efficiency newly built office building, considering the distribution, the emission and the ventilation. Results are presented at first for a few hypothetical operating conditions including the Belgium summer sizing point. A full year simulation is then presented together with a sensitivity analysis of the internal heat gains impact on the total system performance. These results will allow to draw conclusions on the impact of chilled water temperature on the system performance. It will also give guidance on the sizing and the control of such system in the frame of nearly zero energy building.
2.
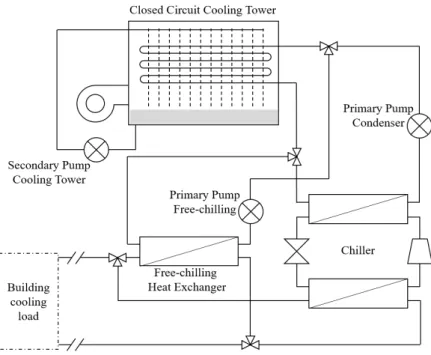
Sensitivity analysis of the primary chilled water systemThis section presents the sensitivity analysis of a cooling plant composed of a water cooled screw chiller coupled to a closed circuit cooling tower. A free-chilling heat exchanger is also included in the system. The schematic of the cooling plant is presented in Fig. 1. The influence of the chilled water temperature on the system performance is analysed using a detailed model simulated in EES equation solver [2]. Two operating modes are considered in the analysis:
the standard operation mode with the chiller coupled to the cooling tower;
the free-chilling mode with the chiller turned off and with the free-chilling heat exchanger coupled to the cooling tower. The control of the two modes is not considered in this section since the analysis is based on steady-state conditions with a fixed chilled water cooling load constant and for steady outdoor conditions. Other parameters are considered in the analysis such as the water temperature set point at the
exhaust of the cooling tower, the oversizing of the cooling tower and the type of fan speed control in the cooling tower.
Fig. 1 Cooling plant schematic.
2.1. Model
Semi empirical models are used for both the cooling tower [3] and the water cooled chiller [4][5]. The first step consists in sizing the cooling tower together with the other system components. The system main inputs in nominal condition are summarized in Table 1. The sizing of the cooling tower capacity (1) is based on the cooling capacity of the evaporator (design cooling load of the building), the chiller energy efficiency ratio (EER) and the cooling tower oversizing factor.
oversizing ct chiller ev n ct
Q
EER
f
Q
,
(
1
1
/
)
, (1) n ct n ct aQ
M
, ,
0
.
022
*
, (2) n ct n ct fanQ
W
, ,
0
.
018
*
, (3) n ct n ct pumpQ
W
,2, ,
0
.
002
*
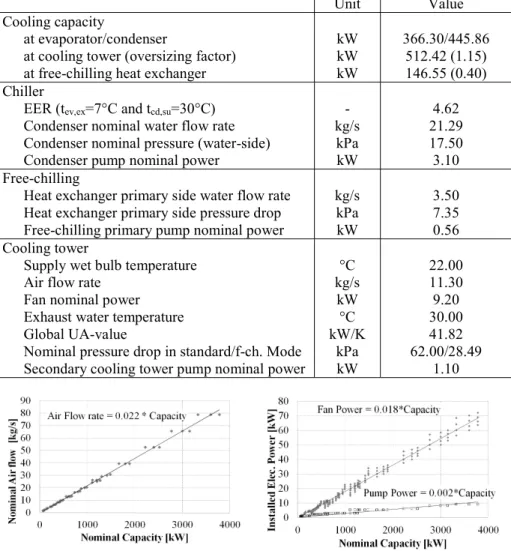
, (4)Table 1. System sizing data
Unit Value Cooling capacity
at evaporator/condenser
at cooling tower (oversizing factor) at free-chilling heat exchanger
kW kW kW 366.30/445.86 512.42 (1.15) 146.55 (0.40) Chiller
EER (tev,ex=7°C and tcd,su=30°C)
Condenser nominal water flow rate Condenser nominal pressure (water-side) Condenser pump nominal power
- kg/s kPa kW 4.62 21.29 17.50 3.10 Free-chilling
Heat exchanger primary side water flow rate Heat exchanger primary side pressure drop Free-chilling primary pump nominal power
kg/s kPa kW 3.50 7.35 0.56 Cooling tower
Supply wet bulb temperature Air flow rate
Fan nominal power Exhaust water temperature Global UA-value
Nominal pressure drop in standard/f-ch. Mode Secondary cooling tower pump nominal power
°C kg/s kW °C kW/K kPa kW 22.00 11.30 9.20 30.00 41.82 62.00/28.49 1.10
Fig. 2 Correlation between cooling tower capacity and air flow rate, nominal absorbed power of the centrifugal fans and nominal absorbed power of the secondary pump.
The sizing of the air flow rate (2) in the cooling tower together with the nominal absorbed power both the centrifugal fans (3) and the secondary pump (4) are then evaluated as a percentage of the cooling capacity ([6]) based on manufacturer data as show in Fig. 2. From these inputs, the cooling tower heat transfer global coefficients is evaluated in nominal conditions, giving the global UA-value in nominal condition.
2.2. Standard operation mode
The sensitivity analysis of the system performance to chilled water temperature (set point at evaporator exhaust) can be achieved using the described model. The performance of the system is evaluated through a global coefficient of performance defined in (5).
)
/(
, ,,1 ,2,,plant ev fanct pump ct pump ct chiller
cooling
Q
W
W
W
W
COP
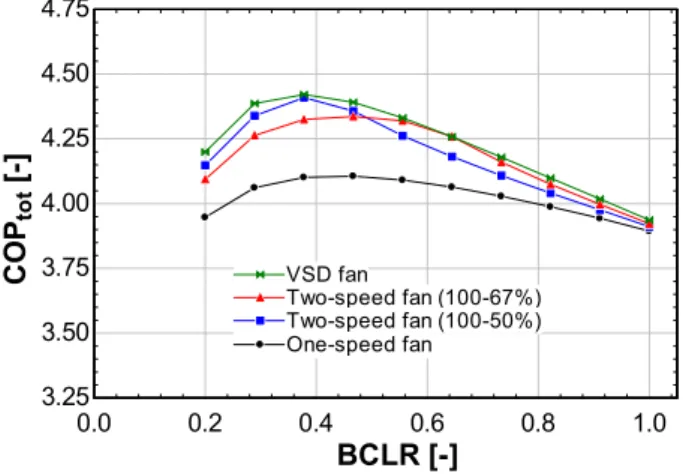
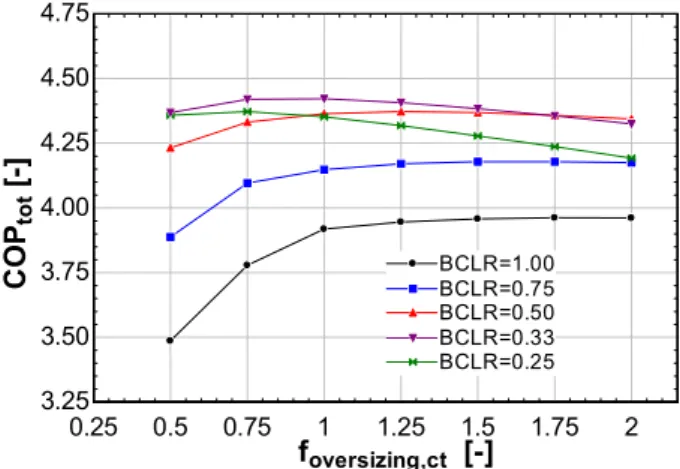
(5)In each simulation, the load at the evaporator (or at the free-chilling heat exchanger) is defined as the building cooling load ratio or BCLR, ratio between the actual cooling load at the evaporator and its nominal load. Fig. 3 presents the influence of the cooling tower fan speed control for different cooling load, considering the system as defined in the design phase (Table 1). It shows an improvement between one speed fan and variable speed with performance increase ranging from 1.3% to 8.1%, especially at lower cooling load. In Fig. 4, the influence of the cooling tower oversizing is analyzed considering the VSD fan and the system as designed. It shows on one side, slight degradation when the cooling tower is oversized, but also, on the other side, severe degradation of the performance of the system at high cooling load when the cooling tower is undersized. This effect is coming from the increase of the water temperature leaving the cooling tower and entering the condenser, lowering significantly the chiller EER. In Fig. 5, the impact of the water temperature leaving the cooling tower is then considered again based the system as designed. It shows an optimal temperature around 28°C almost independently of the cooling load.
0.0 0.2 0.4 0.6 0.8 1.0 3.25 3.50 3.75 4.00 4.25 4.50 4.75 BCLR [-] CO Pto t [-] Two-speed fan (100-67%) Two-speed fan (100-67%) Two-speed fan (100-50%) Two-speed fan (100-50%) One-speed fan One-speed fan VSD fan VSD fan
0.25 0.5 0.75 1 1.25 1.5 1.75 2 3.25 3.50 3.75 4.00 4.25 4.50 4.75 foversizing,ct [-] C O Pto t [-] BCLR=1.00 BCLR=1.00 BCLR=0.75 BCLR=0.75 BCLR=0.50 BCLR=0.50 BCLR=0.25 BCLR=0.25 BCLR=0.33 BCLR=0.33
Fig. 4 Sensitivity of the cooling plant perfomance to cooling tower sizing at different BCLR.
24 26 28 30 32 34 3.25 3.50 3.75 4.00 4.25 4.50 4.75 tw,ex,ct [°C] CO Ptot [-] BCLR=0.33 BCLR=0.33 BCLR=0.50 BCLR=0.50 BCLR=1.00 BCLR=1.00 BCLR=0.75 BCLR=0.75 BCLR=0.25 BCLR=0.25
Fig. 5 Sensitivity of the cooling plant perfomance to fan speed control at different BCLR.
From these three sensitivity analysis, one can already draw some conclusions. First, the impact of the fan type selection and of the oversizing of the cooling tower should be taken into account in the sizing of the system. From that, a control law should be defined based on the climate and the building cooling load associated. Based on the model sized as above, one can then assessed the sensitivity of the cooling plant performance to the chilled water temperature. Fig. 6 shows for wet bulb temperature of 22°C, that an increase of 1°C of the chilled water temperature improve, in average, the cooling plant performance by 5.8%. This observation shows the importance that should be given to the control of the chilled water at all time.
4 6 8 10 12 14 16 3.50 3.75 4.00 4.25 4.50 4.75 5.00 5.25 5.50 5.75 6.00 6.25 6.50 6.75 7.00 tcw,ex,ev [°C] C O Ptot [-] BCLR=1.00 BCLR=1.00 BCLR=0.75 BCLR=0.75 BCLR=0.25 BCLR=0.25 BCLR=0.50 BCLR=0.50 BCLR=0.33 BCLR=0.33
Fig. 6 Sensitivity of the cooling plant perfomance to chilled water temperature leaving the evaporator at different BCLR.
2.3. Free-chilling mode
The free-chilling mode can significantly improve the system performance under certain outdoor conditions. The sizing of both the free-chilling heat exchanger and its corresponding primary pump (see Fig. 1) has a significant impact on the free-chilling potential. In Fig. 7, the impact of the sizing is analyzed considering 10% of the nominal load (BCLR=0.1) and outdoor conditions of 10°C/50%RH. The sensitivity to sizing is substantial, showing the importance of proper sizing of such system.
4 6 8 10 12 14 16 0 2 4 6 8 10 12 14 16 18 20 22 24 26 28 30 32 34 tcw,ex,hx [°C] CO Ptot [-] SIZING FACTOR=0.2 SIZING FACTOR=0.2 SIZING FACTOR=0.4 SIZING FACTOR=0.4 SIZING FACTOR=0.6 SIZING FACTOR=0.6 SIZING FACTOR=0.8 SIZING FACTOR=0.8 SIZING FACTOR=1.0 SIZING FACTOR=1.0 SIZING FACTOR=1.0 SIZING FACTOR=1.0 CHILLER MODE CHILLER MODE
Fig. 7 Sensitivity of the cooling plant perfomance to free-chilling sizing at different chilled water temperature leaving the evaporator, at BCLR=0.1 and Tout=5.5°C/RH=50%
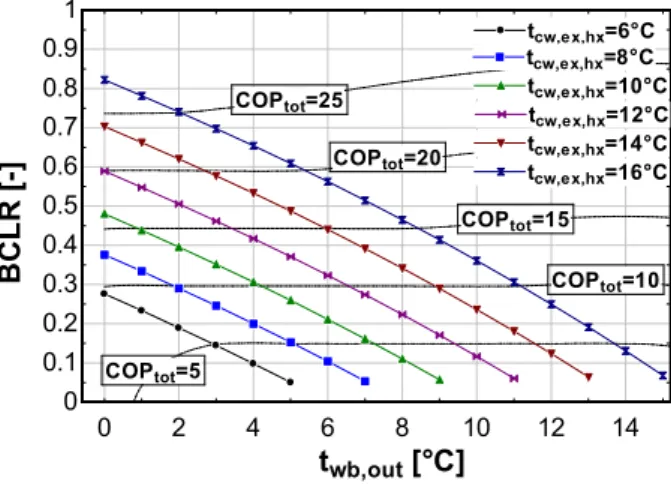
Fig. 8 presents the sensitivity of the system to chilled water temperature at different cooling load and outdoor conditions of 10°C/50%RH. It shows the potential benefit of the free-chilling when working at higher chilled water temperature and at low cooling load with high COP, conditions commonly occurring in mild climate. In Fig. 9, the available cooling at the free-chilling heat exchanger and the associated COP is given as a function of the outdoor wet bulb temperature and for different chilled water temperature.
4 6 8 10 12 14 16 0 2 4 6 8 10 12 14 16 18 20 22 24 26 28 30 32 34 tcw,ex,hx [°C] CO Pto t [-] BCLR=0.04 BCLR=0.04 BCLR=0.08 BCLR=0.08 BCLR=0.12 BCLR=0.12 BCLR=0.16 BCLR=0.16
Fig. 8 Sensitivity of the cooling plant perfomance to chilled water temperature leaving the free-chilling heat exchanger at different BCLR.
0 2 4 6 8 10 12 14 0 0.1 0.2 0.3 0.4 0.5 0.6 0.7 0.8 0.91 twb,out [°C] B CL R [-] COPtot=5 COPtot=10 COPtot=15 COPtot=20 COPtot=25 tcw,ex,hx=6°C tcw,ex,hx=6°C tcw,ex,hx=8°C tcw,ex,hx=8°C tcw,ex,hx=10°C tcw,ex,hx=10°C tcw,ex,hx=12°C tcw,ex,hx=12°C tcw,ex,hx=14°C tcw,ex,hx=14°C tcw,ex,hx=16°C tcw,ex,hx=16°C
Fig. 9 Free-chilling cooling capacity as a function of the outdoor wet bulb temperature and for different chilled water temperature leaving the free-chilling heat exchanger
2.4. Full year performance
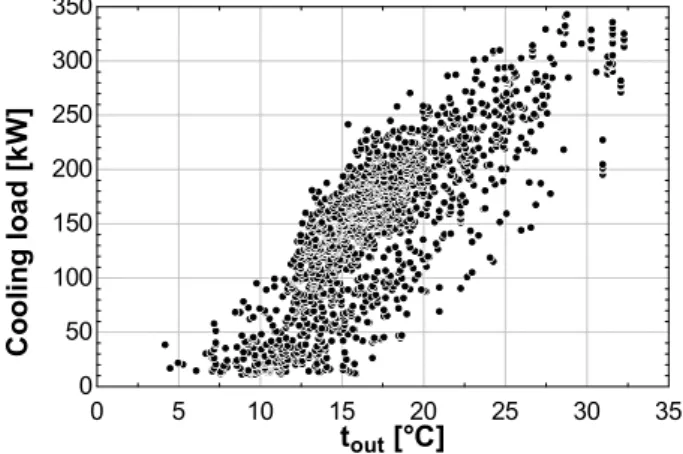
In addition to the results obtain studying separately both mode for different outdoor and indoor conditions, it is interesting to consider the impact of the sizing and control on the performance of the system on a full year simulation. To do so, a reference building developed in the frame of IEA EBC Annex 59 on “High Temperature Cooling & Low Temperature Heating in Buildings”[7] is considered supply in chilled water using the studied system. The building is a hypothetical building designed in accordance with European regulation for newly built office building (EPBD recast 2010). It is a 10 storeys building of 16.600 m² with a ventilation units complying with the specific Ecodesign requirement of NRVUs (ErP 2018). The indoor environment is controlled with high performance fan coil units. Fig. 10 present the hourly cooling load covered by the system for a selected typical climatic year in Brussels.
0 5 10 15 20 25 30 35 0 50 100 150 200 250 300 350 tout [°C] C oo lin g lo ad [k W ]
Fig. 10 Reference building hourly cooling load
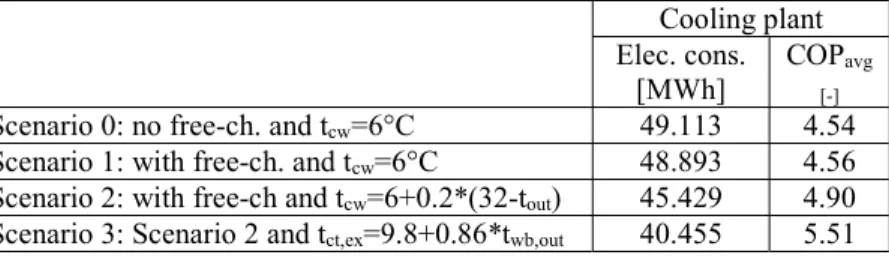
From this load assumed as the inputs of the developed model, the annual consumption and performance of the system can be studied to assess the annual impact of free-chilling and proper control. In Table 2, the annual performance and the electricity consumption of the cooling plant are evaluated through 4 scenarios. The reference case is based on the cooling plant as sized and control in Table 1 characteristics and without free-chilling. In the three other scenarios, the system performance is gradually improved with the
enabling of the free-chilling mode,
control of the chilled-water temperature with a heating curve link to the outside temperature,
control of the cooling tower exhaust water temperature with a heating curve link to the outside wet bulb temperature.
These scenarios show important improvement of the performance of the system with an increase of 21.3% of the system performance giving a reduction of 17.6% of the plant electrical consumption.
Table 2. Influence of free-chilling, chilled-water temperature control and cooling tower exhaust water temperature control on annual performance of the cooling plant.
Cooling plant Elec. cons.
[MWh] COP[-]avg
Scenario 0: no free-ch. and tcw=6°C 49.113 4.54
Scenario 1: with free-ch. and tcw=6°C 48.893 4.56
Scenario 2: with free-ch and tcw=6+0.2*(32-tout) 45.429 4.90
Scenario 3: Scenario 2 and tct,ex=9.8+0.86*twb,out 40.455 5.51
3.
ConclusionFrom the results of the present study, a wide range of improvement possibilities are offered when working at high temperature cooling. The proper sizing of the system components and the impact of their auxiliaries consumption on the total system performance is crucial. The climatic location and the specific load profile of the concerned building should be taken into account in the sizing phase but even more in the definition of the control of the system most sensitive parameters.
Acknowledgment
The authors are grateful to the Walloon Region who funded this research in the frame of IEA EBC Annex 59 project.
References
[1] Brelih, N., Seppänen, O., Bertilsson, T., Maripuu, M.-L., Lamy, H. , Vanden Borre, A., Design of Energy Efficient Ventilation and Air-Conditionning Systems. REHVA. 2012. [2] Klein S.A., and Alvarado F.L., "EES - Engineering Equation Solver", Middletown, WI: F-Chart Software, 2000.
[3] Stabat, P., Marchio, D. 2004. Simplified model for indirect-contact evaporative cooling-tower behaviour. Applied Energy, Vol 78, pp. 433-451.
[4] Lemort, V., Bertagnolio, S., The use of semi-empirical modeling to extrapolate chiller performance maps. ASHRAE Annual Meeting - Seminar 26, Albuquerque, 2010.
[5] Lemort, V., Bertagnolio, S., A Generalized Simulation Model of Chillers and Heat Pumps to be Calibrated on Published Manufacturer's Data. International Symposium on Refrigeration Technology, Zhuhai, China, 2010.
[6] Bertagnolio, S., Stabat, P., Soccal, B., Gendebien, S., André, P., Simulation Based Assessment of Heat Pumping Potential in Non Residential Buildings – Part 1: Modeling. Proceedings of the 10th REHVA World Congress - Clima, 2010.
[7] Randaxhe, F., Lemort, V., Lebrun, J., Global optimization of the production and the distribution system for typical European HVAC systems. Energy Procedia, Volume 78, 2452-2457, 2015.