Snowpack characteristics on steep frozen rock slopes
Marcia Phillips
a,⁎, Anna Haberkorn
a,b, Hansueli Rhyner
aaWSL Institute for Snow and Avalanche Research SLF, Fluelastrasse 11, CH-7260 Davos Dorf, Switzerland
bUnit of Geography, Department of Geosciences, University of Fribourg, ch. du Musée 4, CH-1700 Fribourg, Switzerland
Data from 27 snow profiles taken in frozen rock walls at two sites in the Swiss Alps reveal that steep slopes have distinctive snowpack characteristics. Snow pits were dug in 50–65° slopes at elevations between 2900 and 3600 m asl on north- and south-facing slopes at Gemsstock and Jungfraujoch Sphinx in the winters 2012–2013 and 2013–2014. There were marked contrasts in snow characteristics between the two aspects, yet strong inter-site similarities. Under the influence of intense solar radiation, basal ice layers and multiple hard melt-freeze crusts formed on the south-facing slopes. Soft layers of facets and depth hoar developed between the crusts. On the shady north-facing slopes, thick basal melt-freeze crusts formed when snow persisted during stable weather periods in autumn. The dominant snow grain types in winter were facets and depth hoar. When solar elevation exceeded slope angle from mid-April onwards, gravity-driven percolation of melt water flowing parallel to the frozen rock surface from areas with warm protruding rocks led to the formation of thick basal ice layers in the north-facing slopes. Windward slopes were covered with rime and glaze during storms, regardless of aspect and season. Despite widespread snowpack instability, the formation of large slab avalanches was hindered by the pronounced roughness of the rock surfaces. The main drivers contributing to the distinctive character of snow covers in frozen rock walls are the negative rock surface temperatures, enhanced/minimized solar radiation and multidirectional fluxes of water, vapour and heat induced by the steepness of the rock slopes.
1. Introduction
Snow accumulates in rock walls with slope angles reaching ap-proximately 75° (Haberkorn et al., 2015a), yet slopes around 50–55° are often regarded to be the threshold angle for snow deposition (Warscher et al., 2013; Winstral et al., 2002). Snow and rime can adhere to rock slopes steeper than 75° during storms but tend to rapidly sluff off or melt. The spatial distribution of snow in rock walls has been described using terrestrial laser scanning (Haberkorn et al., 2015b; Sommer et al., 2015; Wirz et al., 2011) and its effects on rock temperature in perma-frost regions have recently been investigated using snow gauge poles (Magnin et al., 2015) and time-lapse photography, combined with rock temperature measurements (Haberkorn et al., 2015a). Whilst laser scanning allows to determine snow depth and distribution during winter (Deems et al., 2013), neither this method nor other remote sensing techniques allow insight to snowpack properties and their evolution in the course of a winter.
Realistic simulations of the constitution of the snow cover can be obtained using 1D snow cover models such as SNOWPACK (Lehning et al., 2002) or CROCUS (Vionnet et al., 2012), but with the exception of the simulations of snow depth carried out by Haberkorn et al.
(2015a)using the former model, there are no examples of snowpack characteristics being modelled in very steep terrain. Although vertical fluxes such as melt water runoff can be modelled in the snow cover using SNOWPACK (Wever et al., 2014), lateral gravity-induced effects (e.g. waterfluxes beneath the snowpack, parallel to the rock surface) or lateral heat transfer caused by terrain microstructure, as modelled by Arons et al. (1998)are not taken into account by 1D snow cover models. Ground based information from steep slopes is essential to verify such point scale models and improve spatially distributed energy balance models like ALPINE3D (Lehning et al., 2006), which can realistically simulate snow cover duration in very steep terrain but less convincingly reproduce snow cover distribution and snow characteristics (Haberkorn et al., 2016). This problem is aggravated by a complete lack of me-teorological data measured directly in steep slopes.
To our knowledge, there are no examples of situ snow cover in-vestigations in rock walls exceeding 50° in the literature. In addition, the SLF snow profile data base (which currently contains almost 31,000 snow profiles), does not contain any snow pit observations from rock slopes over 50°, other than those presented in this paper. The lack of snow pit data from very steep terrain can probably be explained by the challenge of access and by the fact that this type of terrain is not
⁎Corresponding author.
E-mail address:[email protected](M. Phillips).
http://doc.rero.ch
Published in "Cold Regions Science and Technology 141 (Supplement C): 54–65, 2017"
which should be cited to refer to this work.
particularly relevant for avalanche formation. However, information on snowpack characteristics is essential to determine the thermal influence of snow on rock walls. This is of particular interest with regard to the stability of frozen rock walls containing ice in pores and fractures, and where rock and fracture dynamics can be strongly linked to the thermal regime (Draebing et al., 2016; Hasler et al., 2012; Krautblatter et al., 2013). The influence of winter conditions and of snow on rock slope failures is unclear and currently being investigated, as large events exceeding 100,000 m3 have been observed in mid-winter (Phillips et al., 2016b).
27 snow profiles measured in rock walls at two sites in the Swiss Alps with slope angles at or exceeding 50° are discussed here. The data were obtained in the context of a research project designed to de-termine the role of snow on rock slope temperature and stability in mountain permafrost (Haberkorn et al., 2015a; Haberkorn et al., 2015b). These two papers focused on the spatial distribution and depth of the snowpack and its effects on rock temperature. Here, we focus on the properties of the snowpack measured directly in rock walls. The number of snow profiles is restricted and their aspect-distribution un-even (17 on north-facing slopes and 10 on south-facing ones), thus preventing a robust statistical analysis. In addition, the snow profiles were taken at different times of winter, yet never simultaneously at the two study sites.
We therefore present a preliminary qualitative characterization of snow in very steep rocky terrain at elevations between 2900 and 3600 m asl in the Swiss Alps to illustrate the potential of such slopes for more detailedfield investigations and for improved modelling of par-ticular processes and characteristics. The aims of this paper are to de-scribe the main characteristics of snow in frozen rock walls on the basis of 27 snow profiles and to discuss certain recurring particularities of the snow on steep north- and south-facing rock slopes at high elevations in Alpine environments. In addition to the well known drivers influencing snow layer properties and snow instability (Reuter et al., 2015; Schweizer et al., 2008), we propose that there are additional drivers which are specific to snowpacks on steep frozen rock slopes.
2. Study sites and winter conditions
Snow profiles were measured during the winters 2012–2013 and 2013–2014 at two sites with frozen rock walls in the Swiss Alps: Gemsstock (46°36′7.74″N/8°36′41.98″E, 2961 m asl) in the central Swiss Alps and Jungfraujoch Sphinx (46°32′51.13″N/7°59′07.80″E, 3572 m asl) in the Bernese Alps (Fig. 1). Both sites consist of a mountain ridge with rock walls facing NE to NW in the northern sector and SE to SW in the southern one. For simplicity we henceforth refer to north- (N) and south-facing (S) rock walls. These walls have slope angles ranging from 50° to vertical or overhanging sectors.
The Gemsstock ridge consists of Gotthard paragneiss and grano-diorite, containing quartz veins. The S face is a smooth dip slope, whereas the N face is a rough scarp slope characterized by a series of
persistent parallel joints dipping steeply south-eastwards at 70°, forming horizontal ledges in the rock wall with a spacing of 3 to 5 m (Phillips et al., 2016a). The rougher rock surface enhances snow ac-cumulation here. Both slopes at Gemsstock are around 50 m high.
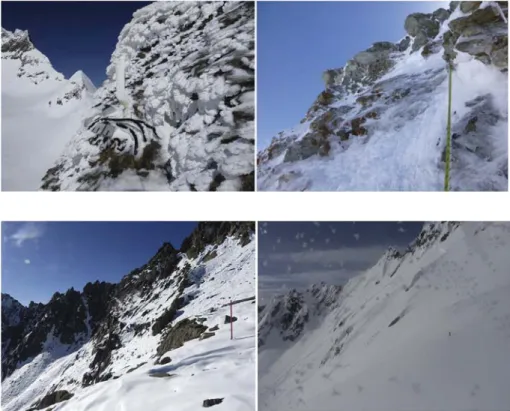
At Jungfraujoch Sphinx the top of the ridge consists of gneiss and is underlain by limestone and the basement Gastern granite. In the areas investigated, the rock dips southwards at an angle of 10–15° and is strongly fractured (Keusen and Amiguet, 1987). Both the N and the S face have a rough microtopography (Fig. 2) and are around 100 m high (Figs. 1 and 2).
Whereas Gemsstock is at the lower fringe of Alpine permafrost (Kenner et al., 2011), with patchy occurrences of permafrost in the North face, Jungfraujoch Sphinx has permafrost in both aspects (Hasler et al., 2011), due to its higher elevation. An overview of the permafrost distribution at both sites can be obtained from the Swiss permafrost distribution map (seehttp://map.geo.admin.ch).
The Gemsstock ridge is on the central Alpine divide and is therefore affected by southerly and northerly airflows. The site has enhanced orographic and convective cloud formation and high precipitation va-lues with measured maximum winter snow depths exceeding 4 m. Mean annual precipitation at the MeteoSwiss automatic weather station (AWS) Gütsch, 6 km North of Gemsstock at 2287 m asl, is around 1500 mm a− 1. The mean annual air temperature (MAAT) at the AWS Gemsstock (2869 m asl) is−3 °C (Phillips et al., 2016a). Jungfraujoch is on the northern Alpine divide, also affected by enhanced orographic cloud formation. Most precipitation falls as snow and MAAT at Jung-fraujoch is−7.3 °C (Hasler et al., 2011).
Winter 2012–2013 was a very snow rich winter, with snow depths deeper than average in the study regions. The snow season started in October 2012 and intense snowfalls in May 2013 prolonged the snow cover duration into the early summer (Techel and Darms, 2014). In contrast, winter 2013–2014 was characterized by having little snow until the end of December 2013. Snow depths in the study areas re-mained lower than average thereafter (Techel et al., 2015).
3. Flux directions in steep terrain
Heatfluxes, vapour transport and gravity driven processes can occur in different directions on steep slopes, which is relevant for snowpack evolution. Conductive and radiative heatflow mainly occur normal to the rock/snow surface and vapour fluxes occur along temperature gradients (Pinzer et al., 2012) with the same orientation. Heat transfer can also occur laterally/horizontally, for example from warm rock outcrops into the snow (Arons et al., 1998). In contrast, waterfluxes (and thus convective heat transfer) occur along preferentialflow paths (Marsh, 2006) - i.e. both vertically and parallel to harder snow/ice layers or to the rock surface. Finally, capillary suction occurs upwards (Ceaglio et al., 2017; Mitterer and Schweizer, 2012), both normally and vertically. This combination offlux directions leads to more complex conditions within the snowpack in rock walls than those found inflatter
Fig. 1. Map of Switzerland (inset, right) showing the loca-tion of the study sites Gemsstock (G) in the central Swiss Alps (topographic map, left) and Jungfraujoch Sphinx (J) in the Bernese Alps (topographic map right). The study areas in the rock walls are circled in red. The automatic weather station at Gemsstock is marked with a red dot. (Swisstopo maps reproduced with permission 5,704,000,000).
terrain. A sketch of the mainflux directions referred to here is shown in Fig. 3.
4. Methods
4.1. Snow pits
27 snow pits were dug on the rock walls at Gemsstock and Jungfraujoch Sphinx at various times in the course of the winters 2012–2013 and 2013–2014 (Table 1). They were located between 2900 and 3600 m asl. 17 snow pits were taken on northern aspects, 10 on southern ones. Slope angles ranged between 50° and 65° and mean slope angle was 57°. Certified rope access techniques were used to reach the snow pit sites, which were approached by abseiling from above and then moving laterally to avoid snow cover disturbance. Pits were dug
from the base of the slope upwards.
The pits were dug vertically and snow temperatures were measured laterally. Snow properties were classified according to the International Classification for Seasonal Snow on the Ground (Fierz et al., 2009). Layer thickness, grain type, grain size and hand hardness index were recorded. Wherever possible, snow density was measured - unless crusts or ice layers were too hard to penetrate with the density cylinder. South-facing pits were always dugfirst in the early morning, to avoid wet snow slides and to minimize the influence of solar radiation. No snowpack stability tests were carried out, but structural instability threshold values (Schweizer and Jamieson, 2007), also referred to as ‘lemons’ or ‘yellow flags’ in the literature, were automatically identified by the SLF Snowprofiler program which was used to register all profiles. 4.2. Near-surface rock temperature measurements
At the Gemsstock site, continuous in-situ near-surface rock tem-perature (NSRT) data are available for the entire 2 year study period. These were measured in 0.1 m deep boreholes in the rock walls and at 2 h intervals, using coin-sized Maxim iButton® DS1922L temperature loggers. After calibration in an ice-water bath, instrument accuracy was ± 0.25 °C at 0 °C. The open access software iAssist (Keller et al., 2010) was used to deploy and read out the temperature loggers. These were placed in water resistant plastic capsules, which caused a short but acceptable delay in the thermal reaction (Haberkorn et al., 2015b). The 0.1 m deep boreholes were sealed with a gum plug to protect the de-vices from water, atmospheric influences and the direct exposure to solar radiation.
A total of 30 iButtons were installed (11 on the N slope, 19 on the longer S slope), in a linear array with a vertical spacing of around 3 m (Haberkorn et al., 2015b). Here we only show data from 4 devices: 2 on the S slope, 2 on the N slope. For each aspect, the NSRT data from one device located near the top of the rock wall in very steep, practically snow-free terrain and from one device located further downslope in
Fig. 2. Photographs of the investigated rock walls. The north- (top left) and south-facing (top right) rock slopes at Gemsstock and at Jungfraujoch Sphinx (bottom left and bottom right). Yellow arrows indicate areas where snow pits were dug. Open orange circles indicate the positions of the upper temperature loggers (S1 and N2), full orange circles the positions of the
lower loggers (S9 and N7) described inSection 4.2and inFig. 4.
Fig. 3. Sketch of a snowpack in steep terrain and the mainflux directions within it, which
are referred to in this paper.
snow covered terrain are shown (Figs. 2 and 4). The NSRT data help to interpret processes occurring at the rock-snow interface in the course of the two winters investigated.
4.3. Automatic weather station
Unfortunately no meteorological data were measured directly in the rock walls we studied, although slope-scale micrometeorological pro-cesses are important drivers of snowpack development on these steep slopes. Nevertheless, there is an automatic flat-field weather station (AWS) nearby at Gemsstock at 2869 m asl, at the foot of the N rock slope (Fig. 1). We show air temperature data measured at the Gems-stock AWS for the two year period 1 October 2012 to 30 September 2014 (Fig. 4, top).
5. Results and discussion
5.1. General snow cover characteristics
In the 27 snow pits investigated, vertical snow depths ranged be-tween 0.11 and 1.95 m. Mean vertical snow depth was 0.64 m. Long steep rock walls (e.g. the Jungfraujoch Sphinx N slope,Fig. 2c) had lower snow depths than shorter slopes or those with distinct rock ledges (e.g. the Gemsstock N slope,Fig. 2a), on which snow could accumulate. Snow layers generally accumulated parallel to the underlying rock surface but terrain roughness initially caused numerous local dis-continuities until rocky asperities were covered. Wind and gravity in-duced sluffing and spindrift, leading to cross-bedding and dune for-mation. Snow densities (of the entire snowpack) ranged between 163
and 577 kg m− 3, with a mean density of 268 kg m− 3. On the N-facing slopes the mean snow density was 252 kg m− 3and on the S-facing ones it was 296 kg m− 3. In 5 cases density could not be measured down to the base of the snowpack due to excessive hardness of snow or ice layers.
Despite differences in elevation, micro-topography and snow cover regime at the two sites, snow characteristics showed clear inter-site similarities and comparable evolutions in the course of the two winters, although there were different snow conditions in the snow-rich winter 2012–2013 and the snow-poor winter 2013–2014. As expected, there were marked contrasts between snow cover properties in the N and S aspects at the individual sites, linked to the strong differences in direct solar radiation received in winter.
5.2. Near-surface rock temperatures and selected snow profiles at Gemsstock
As air temperature data and continuous near-surface rock tem-peratures (NSRT) were available for the Gemsstock site (Fig. 4), seven selected snow profiles taken in the S and N slopes of Gemsstock over the two year study period are shown inFig. 5a–g. The NSRT help to in-terpret the evolution of the snow cover characteristics. Four snow profiles were taken in the N slope and three in the S slope. The snow cover characteristics observed in these profiles and in the 20 others carried out at both study sites are discussed in the subsequent sections. The remaining 20 snow profiles, including those measured at Jung-fraujoch Sphinx are shown as Supplementary material.
InFig. 5a–g below, seven selected snow profiles Sa, Sb, Sc, Na, Nb, Nc
and Nd(see Table 1for details and Fig. 4for the corresponding air
Table 1
Overview of the dates, locations, elevations, aspects and slope angles of 27 snow profiles measured at Jungfraujoch Sphinx (J. Sphinx) and Gemsstock between 2012 and 2014. Rock surface temperature at the base of the snowpack, snow surface temperature and snow depths are also shown. The dates are not chronologically sorted but listed according to time of
winter (November to May). 7 selected profiles shown inFigs. 5a to g are marked with an asterisk* in column 2. The remaining 20 profiles are shown as Supplementary material.
Date Site
*[Profile ID inFig. 5a–g]
Elevation (m asl)
Aspect Slope
(°)
Rock surface temperature (°C)
Snow surface temperature (°C) Snow depth (m) 21 Nov. 2012 J. Sphinx 3532 N 53 −6.6 −10.4 0.40 21 Nov. 2012 J. Sphinx 3480 SW 53 −3.0 −7.0 0.31 21 Nov. 2012 J. Sphinx 3548 NW 65 −8.4 −7.0 0.11 9 Jan. 2013 Gemsstock *[Na] 2920 N 64 −1.0 −8.2 1.95 9 Jan. 2013 Gemsstock *[Sa] 2921 S 56 0.0 −0.4 0.82 9 Jan. 2013 Gemsstock 2927 S 50 −0.9 −0.7 0.78 28 Jan. 2014 Gemsstock 2940 NW 52 −7.5 −17.2 0.37 28 Jan. 2014 Gemsstock *[Sc] 2917 SE 58 −2.2 0.0 0.90 28 Jan. 2014 Gemsstock 2922 SE 61 −3.1 −0.1 0.24 28 Jan. 2014 Gemsstock 2926 SE 60 −2.9 0.0 0.73 28 Jan. 2014 Gemsstock 2926 NW 50 −5.2 −16.0 0.54 28 Jan. 2014 Gemsstock *[Nc] 2917 NW 52 −6.1 −19.7 0.67 28 Feb. 2013 Gemsstock 2918 SE 60 −1.4 −4.2 0.38 28 Feb. 2013 Gemsstock *[Sb] 2923 SE 58 −1.3 −3.8 0.73 28 Feb. 2013 Gemsstock 2927 SE 60 −2.6 −4.4 0.58 28 Feb. 2013 Gemsstock *[Nb] 2926 N 58 −5.6 −3.5 1.11 28 Feb. 2013 Gemsstock 2915 NW 54 −7.4 −5.2 1.21 28 Feb. 2013 Gemsstock 2921 NW 64 −4.7 −3.8 1.20 1 Apr. 2014 J. Sphinx 3541 N 54 −9.3 −9.6 0.39 1 Apr. 2014 J. Sphinx 3547 N 50 −9.0 −10.5 0.68 1 Apr. 2014 J. Sphinx 3540 NW 55 −9.8 −8.4 0.38 2 May 2013 J. Sphinx 3485 S 50 −1.5 −4.1 0.45 2 May 2013 J. Sphinx 3540 N 65 −5.0 −7.3 0.60 2 May 2013 J. Sphinx 3550 N 60 −5.0 −7.8 0.13 2 May 2013 J. Sphinx 3530 NW 58 −6.4 −5.6 0.54 2 May 2013 J. Sphinx 3545 N 58 −5.8 −4.6 0.69 16 May 2014 Gemsstock *[Nd] 2917 N 58 nn −6.4 0.49
http://doc.rero.ch
temperatures and near-surface rock temperatures) are shown using the visualization tool SnopViz (Fierz et al., 2016). In the column headed F, the snow grain types are shown for each layer. Column E shows the size of the grains (mm). Column R shows the hand hardness of the snow layers. To the right of this column‘flags’ or ‘lemons’ indicating struc-tural instability are shown (see Section 5.6). On the far right, the densities of each snow layer are shown (kg m− 3). Snow pit character-istics such as snow depth, snow hardness and snow temperature profiles (red line) are depicted graphically on the left hand side of each dia-gram. All symbols and colours for the grain types follow Fierz et al. (2009), as do the definitions for grain size and hand hardness. The le-gend for symbols and colours used inFig. 5a to g and in the Supple-mentary material is shown inFig. 5h.
5.3. Dominant snowpack characteristics on south-facing rock slopes
The snowpacks on the S-facing slopes were characterized by three particular phenomena (Fig. 6), which were observed throughout the winter: i) basal ice layers, ii) multiple melt-freeze crusts and iii) faceted grains or depth hoar between melt-freeze crusts. These snow types and their possible formation are discussed below.
We observed basal ice layers in 7 of the 10 profiles on S-facing slopes and their thickness ranged between 0.02 and 0.1 m. They were present throughout the winter and were likely caused by percolation and refreezing of snow melt water along the base of the snowpack, as has been observed in Arctic snow covers (Marsh, 2006). In rock walls, snow melt waterflows parallel to the rock surface from higher areas with protruding rocks warmed by solar radiation and refreezes lower downslope at the cold snow-rock interface. Woo and Heron (1981) showed that if the rock under the snowpack is cold enough to dissipate the latent heat of freezing, a basal ice layer can form at the snow-rock interface by refreezing of the melt water. Rock surface temperatures on the S-facing rock slopes ranged between 0 and−3 °C (mean − 1.9 °C).
Upward capillary suction of water (Mitterer and Schweizer, 2012) at the base of the snowpack may also contribute to forming thick basal ice layers or melt-freeze crusts. Incoming shortwave radiation warming the underlying rock during the day through very thin snow covers and then freezing of melt water during clear sky conditions at night may also play a role in the formation of basal ice layers on S-facing slopes.
The near-surface rock temperatures (NSRT) measured at 0.1 m depth in the S slope at Gemsstock provide thermal evidence for the presence of a basal ice layer: they show a long-lasting zero curtain throughout the winter beneath the snow cover (Fig. 4, centre, S9), contrasting strongly with NSRT measured in snow-free areas (Fig. 4, S1), which are strongly influenced by air temperature and solar radia-tion. Above the basal ice layer, a series of hard melt-freeze crusts formed on the S-facing slopes from early winter onwards. For example, up to 5 crusts were observed in early January 2013 at the Gemsstock site (Fig. 5a). Melt-freeze crusts can develop as a result of rain on snow or due to strong insolation and melt followed by freezing (Smith et al., 2008). When the crusts did not occur in parallel on the N-facing slopes, we assumed they were sun crusts, as described byJamieson (2006). The alternation of intense solar radiation during the day and cold clear-sky freezing conditions at night were likely responsible for their formation. In winter, when solar elevation is low, steep S-facing slopes receive more solar radiation than horizontal terrain (Blumthaler, 2012). Short-wave radiation penetrates the surface of the snowpack and attenuates with depth (Bakermans and Jamieson, 2009). Reuter and Schweizer (2012) measured maximum near-surface warming at around 0.1 m depth. The crusts we observed were between 0.02 and 0.08 m thick when a series of crusts was present (Fig. 5a). However, in most cases one or two very thick melt-freeze crusts were observed (up to 0.35 m thick,Fig. 5c). In the course of winter, melt-freeze crusts were found anywhere in the snow cover, i.e. at the base, in the middle and at the top on these S-facing slopes (Fig. 5a–c). From a total of 14 snow pits with melt-freeze crusts, 9 were on S-facing slopes.
Interestingly, the melt-freeze crusts on the S slopes were interlaid by layers of faceted crystals or depth hoar (Fig. 5a–c). Various studies have investigated near-crust faceting. These include the formation of facets below crusts (Fierz, 1998) due to the blocking of water vapour migrating upwards by the denser crust, and faceting above crusts (Colbeck and Jamieson, 2001; Jamieson, 2006) due to the decay of the wetter crust, initiating facet growth above and thus inducing a higher temperature gradient within the layer of facets, which further enhances their growth.Jamieson and Fierz (2004)also demonstrated that facets form in a dry snow layer overlying wet snow, due to the presence of a strong temperature gradient favourable to kinetic grain growth during freezing of the wetter layer. These authors also found that an impeding horizon, such as an ice lens under the wet layer can additionally en-hance faceting above it.Domine et al. (2009)showed that melt-freeze crusts can also transform into depth hoar in thin snowpacks with high temperature gradients causing strong upward vapourfluxes. Controlled laboratory experiments carried out byHammonds et al. (2015)helped to interpret such observations. They revealed very high temperature gradients on a sub-millimetre scale above and below ice lenses. Hammonds and Baker (2016) then found that thermal contact re-sistance is the main cause for the local increase in temperature gradient and that the porosity of the snowpack at the ice-snow interface is of primary importance to kinetic snow metamorphism.
Combinations of these scenarios are likely in the steep sunny rock walls investigated here. Under clear-sky conditions and with subzero rock surface temperatures under the snow, near-surface temperature gradients and their sign can vary strongly on a diurnal basis due to marked temperature changes at the snow surface (Fig. 6). The principal driving factors are incoming shortwave and outgoing long wave ra-diation, but reflected long wave radiation also raises the snow surface temperature under cloudy conditions. These diurnal temperature var-iations are favourable for both the formation of melt-freeze crusts and for temperature gradient metamorphism between and above them. A
Fig. 4. Top: Air temperature measured by the AWS Gemsstock. Centre: Near-surface rock temperature (NSRT) in a steep, snow-free sector of the Gemsstock S slope (S1) and in a snow covered sector lower down (S9). Bottom: NSRT in a steep, snow-free sector of the Gemsstock N slope (N2) and in a snow covered sector lower down (N7) - all measured
between 1 Oct. 2012–30 Sept. 2014. SeeFig. 2for the positions of S1, S9, N2 and N7. The
dates on which 7 selected snow profiles were carried out are shown (black vertical lines)
and labelled (see alsoTable 1,Fig. 5a–g). Black circles show the times at which NSRT are
positive for thefirst time at the top of the N slope at N2, leading to the formation of a
basal ice layer lower downslope and a zero-curtain at N7.
layer of new snow on a layer of wet snow will prolong the duration of a temperature gradient favourable to faceting during freezing of the wet layer until the slope is influenced by solar radiation again, inducing the formation of a new melt-freeze crust at the snow surface. This leads to the sandwich-like layering we observed, consisting of hard melt-freeze crusts with soft facets or depth hoar between them.
5.4. Dominant snow cover characteristics on north-facing rock slopes
On the N-facing slopes, three main features were observed in the snowpack (Fig. 7): i) the dominant snow grain types were depth hoar and facets, ii) thick melt-freeze crusts were sometimes present at the
base of the snow cover and iii) a thick basal ice layer formed from mid-April onwards.
Temperature gradient metamorphism leading to the formation of facets and depth hoar (Fig. 5d–f) is typical on shady slopes with thin snow covers, due to pronounced differences in temperature (Baunach et al., 2001), which induce a water vapour pressure gradient in the pore space and an associated vapourflux (Pinzer et al., 2012). However, as rock surface temperatures were well below 0 °C throughout the winter in both N-facing slopes (between−5 °C and −11.1 °C), temperature gradients within the snowpack were likely lower than they would be on warmer non-permafrost substrates. However, Phillips and Schweizer (2007)showed that the effect of lower temperature gradients in snow
Fig. 5. a) Snow profile Sa(Gemsstock S, 9 Jan.
2012).
b) Snow profile Sb(Gemsstock S, 28 Feb. 2013).
c) Snow profile Sc(Gemsstock S, 28 Jan. 2014).
d) Snow profile Na(Gemsstock N, 9 Jan. 2012).
e) Snow profile Nb(Gemsstock N, 28 Feb. 2013).
f) Snow profile Nc(Gemsstock N, 28 Jan. 2013).
g) Snow profile Nd(Gemsstock N, 16 May 2014).
h) Legend (colours and symbols) for the snow
grain shapes shown inFig. 5a–g and in the 20
figures shown in the Supplementary material.
on mountain permafrost substrates has a minimal effect on the max-imum grain size and grain types at the base of the snow cover, and that depth hoar and faceted crystals can dominate on shady slopes even when temperature gradients are lower. In addition, as mentioned above for the S-facing slopes, a layer of new snow on a layer of moist snow will prolong the duration of a strong temperature gradient favourable to faceting during freezing of the moist layer (Jamieson and Fierz, 2004). As sun crusts are absent on steep N-facing slopes, the formation of basal melt-freeze crusts here can be attributed to sensible heat (Jamieson, 2006) and requires the persistence of autumn snow in shady locations, the influence of positive and negative air temperatures and/ or rainfall events, combined with cold clear sky conditions and a lack of solar radiation. This was for example the case at the Gemsstock site in early winter 2013–2014, when the first snowfall leading to a persistent snow cover occurred on 6 October 2013, followed by long periods of
stable high pressure weather and air temperatures ranging between + 14 and −17 °C (Fig. 4, top). Basal melt-freeze crusts (0.08 and 0.23 m thick) were registered on 16 and 19 November 2013 in two snow pits dug by other observers (SLF snow profile database) on gentler (35°) N-facing slopes located below the rock walls described here. On 28 January 2014 we observed even thicker (0.30–0.32 m thick) basal melt-freeze crusts in the N-facing rock walls at this site (Fig. 5f).
From mid-April onwards, we observed the formation of basal ice layers at the snow-rock interface in the N-facing slopes at both study sites (Fig. 8). The basal ice layers on the N slopes were up to 0.17 m thick (Fig. 5g). As soon as protruding rocks in the upper reaches of the N-facing slopes receive direct solar radiation, warming leads to snow melt around them and the water percolates downslope, parallel to the steep rock surface. At Jungfraujoch Sphinx for example, solar elevation exceeds 55° as of 25 April, so solar radiation can subsequently directly
Fig. 5. (continued)
influence the top of a 55° N-facing slope, initiating snow melt, down-slope percolation and refreezing at the cold snow-rock interface downslope. The near-surface rock temperatures (NSRT) measured in the N slope at Gemsstock provide thermal evidence for the formation of a basal ice layer (Fig. 4, black circles): As soon as NSRT in snow-free areas at the top of the N slope become positive in April (Fig. 4, bottom, N2), for example on 15 April 2013, NSRT in snow covered areas further downslope rise abruptly towards 0 °C (Fig. 4, N7). The ensuing zero-curtain lasts until the end of snow melt. Positive air temperatures in the course of winter do not trigger a temperature increase at N7, but po-sitive NSRT at the top of the slope at N2 do, which is evidence for the start of the formation of a basal ice layer due to refreezing of melt water flowing downslope.
Woo et al. (1982)found that the thickness of basal ice is controlled by the amount of water percolating at the base of the snowpack, the permeability of the substrate and by the snow and substrate tempera-tures. At our study sites, NSRT, rock surface and snow temperatures on the N slopes were much lower than on the S-facing ones (Table 1and
Figs. 5 and 6). Modelling and laboratory experiments carried out by Mitterer and Schweizer (2012)andYamaguchi et al. (2012)showed that water can rise up to 0.2 m into the snow due to capillary effects caused by a strong hydraulic pressure gradient resulting from large differences in liquid water content. Upward capillary suction and freezing of meltwater from the impermeable rock surface upwards may have contributed towards the formation of these thick basal ice layers. Long-term rock temperature data measured in a horizontal borehole through the ridge at the Gemsstock site indicate that basal ice layers form yearly every spring and are so thick that they prevent infiltration of snowmelt into joints on the N slope of Gemsstock, thus having a positive influence on rock slope stability (Phillips et al., 2016a).
To our knowledge there is currently no other literature on basal ice layers in the Alps, although they have regularly been observed. For example, the SLF snow profile database contains 70 profiles with basal ice layers on slopesflatter than 50° and at elevations above 2400 m asl (the approximate lower limit of alpine permafrost). Of these, 24 were on north-facing slopes, and 20 on south-facing ones. 7 were on
Fig. 6. Simplified representation of the dominant snow types,
temperature gradients, directions of water/heat and vapourflux
and approximate snow hardness index observed in snowpacks in
south-facing rock walls (Figure adapted fromFernandez (1998)).
Theflux directions are based onFig. 3. TGM is temperature
gra-dient metamorphism. Fig. 5. (continued)
substrates with a surface temperature of ≤−3 °C, indicating likely permafrost (Gruber and Hoelzle, 2001). However, only one of all the basal ice layers registered was over 0.1 m thick. This was a 0.35 m thick ice layer on a 32° NE-facing rock slope with a rock surface temperature of−4 °C. This underlines the unique nature of the thick and annually recurring basal ice layers we observed in the frozen rock walls.
5.5. Aspect-independent features
Two phenomena were observed on all slopes, regardless of aspect and season. Thefirst was associated with the steepness of the sites in-vestigated: during storms with super-cooled fog droplets, layers of rime and glaze formed at the snow surface or on bare rock surfaces on the windward slopes (Fig. 9a and b). Riming occurs when ice particles and super-cooled droplets collide with an obstacle, freeze and accrete there by‘dry growth’ (Makkonen, 2000). Glazing occurs when there is a li-quid layer at the surface of the accretion and freezing takes place be-neath - a process termed ‘wet-growth’ (Makkonen, 2000). The rock walls we studied acted as obstacles in the path of storms, collecting rime and glaze in the normal or upwind direction in the same manner as exposed engineering structures do (Tsuboi and Kimura, 2012). These accretions generally sluffed off within a few hours or days of their formation. In some cases they were snowed in and formed denser layers within the snowpack. Interestingly, rime cannot be directly registered in the SLF Snowprofiler program, which may be an indication of its scarcity in less steep terrain.
The second aspect-independent feature we observed was cavity hoar at the base of the snow cover in open rock joint entrances (in the ab-sence of a basal ice layer). This phenomenon is however not restricted to steep terrain. Cavity hoar forms when vapour is transported along a temperature gradient in cavities and condenses against colder surfaces (Fierz et al., 2009). It can locally contribute towards snow grain growth and the formation of a weak layer at the base of the snowpack.
5.6. Snowpack stability
The heterogeneous micro-topography of rock walls leads to a patchy distribution of snow covered and snow-free areas, with a multitude of bare rocky outcrops.Arons et al. (1998)showed that depth hoar growth is enhanced close to protruding rocks. They attributed this‘terrain enhanced growth’ either to reduced snow thickness close to rocks or to increased heatflow from the warmer rocks. They also suggested that ‘anchors’ such as rock outcrops cause thermal perturbations which can change the properties of the snow by metamorphism and make it more susceptible to failure. Our observations confirmed that temperature gradient metamorphism was enhanced close to rocky outcrops. How-ever this did not particularly seem to affect snowpack stability in a negative manner, due to the rough nature of the rock surfaces.
Sluffs or small loose snow slides frequently occurred at the study sites (Fig. 10a), and were registered by time-lapse cameras. Sluffs can occur on slopes steeper than 40° and the density of the snow in sluffs is typically very low; they generally consist of new snow, decomposing precipitation particles, or near-surface faceted crystals (Conway and Newcomb, 1998).
Progressive terrain smoothing by snow accumulation and sub-sequent avalanche formation have been investigated byVeitinger et al. (2014). As soon as the rocky asperities were snowed in at the Gems-stock site, shallow slab avalanches were observed (Fig. 10b), but at the Jungfraujoch Sphinx we never observed the slopes to be completely snow covered. We never observed any snow gliding on any of the rock surfaces either, such as described byMcClung et al. (1994), despite the percolation of melt water at the base of the snowpack. This was likely due to the rock surface roughness and to the formation of basal melt-freeze crusts and basal ice layers.
We did not carry out snowpack stability tests in the context of this study. However, the SLF Snowprofiler program detected 5 or more structural instability threshold values at layer interfaces in 12 of the 27
Fig. 8. a (left): Basal ice layer in the N slope of Gemsstock on 16 May 2014. The snow card is 20 cm long. Panel b (right): Basal ice layer in the N slope of Jungfraujoch Sphinx on 2 May 2013. The ice-axe is 45 cm long. Fig. 7. Simplified representation of the dominant snow types,
temperature gradients, directions of water/heat and vapourflux
and approximate snow hardness index observed in snowpacks in
north-facing rock walls (Figure adapted fromFernandez, 1998).
Theflux directions are based onFig. 3. TGM is temperature
gra-dient metamorphism.
snow profiles discussed here (e.g.Fig. 5a–c, f and g). The presence of 5 or more instability threshold values or ‘lemons’ indicates mostly un-stable conditions (Schweizer and Jamieson, 2007). They are for ex-ample attributed when contrasting hardness (e.g. between dense melt-freeze crusts and low density facets or depth hoar), facets, or weak layers at < 1 m beneath the snow surface are detected. At our sites the lemons were attributed due to contrasts in hardness and size between adjacent layers in 6 cases, in 4 cases due to contrasts in hardness and in 2 cases due to differences in grain size. In 7 cases the 5 or more lemons were on S slopes and these lemons were found in up to 7 layer inter-faces, mainly due to hard melt-freeze crusts adjacent to soft tempera-ture gradient metamorphism grains. In the N slopes≥5 lemons oc-curred in 5 cases and in up to 3 layer interfaces. Despite these inherently unstable conditions, the lack of thick slab avalanches can be ascribed to the generally thin snow covers on slopes exceeding 50° and to the roughness of the rock walls, which prevents the presence of a continuous weak layer at the base of the snowpack.
6. Conclusions
On the basis of 27 snow profiles in rock walls with slope angles between 50° and 65° we were able to observe striking inter-site simi-larities in snowpack characteristics and their evolution over two win-ters with different snow conditions, as well as strong contrasts between north- and south-facing slopes. Some features are probably restricted to very steep terrain, or their characteristics are particularly exaggerated there. These are included in the following observations:
•
Solar radiation had a strong influence on the snow cover in the steep south-facing rock walls due to low solar elevation in winter, causing early-winter basal ice layer formation and the development of sev-eral melt-freeze crusts.•
The hard melt-freeze crusts on the south-facing slopes were always interlaid by soft layers of facets and/or depth hoar.•
The persistence of autumn snow led to the development of parti-cularly thick basal melt-freeze crusts on north-facing rock slopes.•
In the north-facing rock walls temperature gradient metamorphism dominated for most of the winter, producing large depth hoarcrystals and facets.
•
Thick basal ice layers formed yearly in north-facing slopes from mid-April onwards, when solar elevation exceeded slope angle and caused downslope percolation of melt water.•
Rime and glaze were deposited on windward slopes during storms. These deposits generally sluffed off but were sometimes snowed in.•
Despite the presence of numerous structural instability threshold values or‘lemons’, no large slab avalanches were observed, due to pronounced rock surface roughness.•
Inter-site similarities in snow properties persisted over the winters 2012–2013 and 2013–2014, despite strongly contrasting snow depths and snow cover durations in these winters. This suggests that slope angle, aspect and rock temperature probably have more in-fluence on the snow characteristics in rock walls than the general winter conditions do.In summary, we suggest that the main drivers influencing the snowpack characteristics in frozen rock walls are the low rock surface temperatures, the thin snow covers induced by slope angle, the en-hanced/minimized aspect-dependent effects of solar radiation and fi-nally, the variable directions of heat, water and vapourfluxes caused by the high slope angles and rock surface roughness. These three-dimen-sional components strongly contribute towards forming the rather particular snowpacks described above. On the one hand, these addi-tional complexities and the lack of in-situ meteorological data make it particularly challenging to simulate snow characteristics realistically in steep terrain using existing snow cover models. On the other, the inter-site transferability of snow characteristics in steep slopes makes them straightforward to anticipate. Our preliminary investigation has in any case shown that there is a wide potential for process-orientedfield measurements in these rather unique snowpacks in steep terrain.
Acknowledgements
This study was carried out in the context of a project funded by the Swiss National Science Foundation SNF (project no. 200021E-135531). The International Foundation High Altitude Research Stations Jungfraujoch and Gornergrat (HFSJG) is thanked for transport and
Fig. 9. a (left): Rime in the South face of Jungfraujoch Sphinx (2 May 2013) shortly after a storm with southerly winds. Scale: the white boxes with black cables are ap-proximately 25 cm long. Panel b (right): Glaze on rocks in the North face of Jungfraujoch Sphinx (2 May 2013), de-posited during the initial phase of the storm when the pre-vailing wind was northerly. A rope is visible on the right for scale.
Fig. 10. a (left): loose snow slides on the South face of Gemsstock, 8 December 2014. Panel b (right): Shallow slab avalanche on the South face of Gemsstock, 28 December 2012. Scale: the red pole in the foreground on the right is 3 m long.
accommodation at Jungfraujoch. Carlo Danioth and Björn Becker en-sured avalanche-safe approaches to our sites at Gemsstock (SkiArena Andermatt-Sedrun). We thank Marc-Olivier Schmid, Jan Beutel and Samuel Weber for their valuable support in thefield and Frank Graf for assistance with the SnopViz illustrations. Michael Lehning, Nander Wever and in particular Charles Fierz are thanked for productive dis-cussions. We are grateful to the editors Bruce Jamieson and Jürg Schweizer, and to two anonymous reviewers for their constructive feedback.
Appendix A. Supplementary material
Supplementary data to this article can be found online athttp://dx. doi.org/10.1016/j.coldregions.2017.05.010.
References
Arons, E.M., Colbeck, S.C., Gray, J.M.N.T., 1998. Depth-hoar growth rates near a rocky outcrop. J. Glaciol. 44 (148), 477–484.
Bakermans, L., Jamieson, B., 2009. SWarm: a simple regression model to estimate near-surface snowpack warming for back-country avalanche forecasting. Cold Reg. Sci.
Technol. 59 (2–3), 133–142.http://dx.doi.org/10.1016/j.coldregions.2009.06.003.
Baunach, T., Fierz, C., Satyawali, P., Schneebeli, M., 2001. A model for kinetic grain growth. Ann. Glaciol. 32, 1–6.
Blumthaler, M., 2012. Solar radiation of the high alps. In: Lütz, C. (Ed.), Plants in Alpine Regions. Springer, Vienna, pp. 11–20.
Ceaglio, E., Mitterer, C., Maggioni, M., Ferraris, S., Segor, V., Freppaz, M., 2017. The role of soil volumetric liquid water content during snow gliding processes. Cold Reg. Sci.
Technol. 136, 17–29.http://dx.doi.org/10.1016/j.coldregions.2017.01.007.
Colbeck, S.C., Jamieson, J.B., 2001. The formation of faceted layers above crusts. Cold
Reg. Sci. Technol. 33 (2–3), 247–252.http://dx.doi.org/10.1016/S0165-232X(01)
00045-3.
Conway, J., Newcomb, M., 1998. Sluff Management. International Snow Science Workshop. Montana State University, Sunriver, Oregon USA, pp. 502–505. Deems, J.S., Painter, T.H., Finnegan, D.C., 2013. Lidar measurement of snow depth: a
review. J. Glaciol. 59 (215), 467–479.http://dx.doi.org/10.3189/2013JoG12J154.
Domine, F., Taillandier, A.S., Cabanes, A., Douglas, T.A., Sturm, M., 2009. Three ex-amples where the specific surface area of snow increased over time. Cryosphere 3 (1),
31–39.http://dx.doi.org/10.5194/tc-3-31-2009.
Draebing, D., Haberkorn, A., Krautblatter, M., Kenner, R., Phillips, M., 2016. Thermal and mechanical responses resulting from spatial and temporal snow cover variability in
permafrost rock slopes, Steintaelli, Swiss Alps. Permafr. Periglac. Process..http://dx.
doi.org/10.1002/ppp.1921.(n/a-n/a).
Fernandez, A., 1998. An energy balance model of seasonal snow evolution. Phys. Chem. Earth 23 (5–6), 661–666.
Fierz, C., 1998. Field observation and modelling of weak-layer evolution. Ann. Glaciol. 26, 7–13.
Fierz, C., Armstrong, R.L., Durand, Y., Etchevers, P., Greene, E., McClung, D.M., Nishimura, K., Satyawali, P.K., Sokratov, S.A., 2009. The International Classification of Seasonal Snow on the Ground. I.S. UNESCO, Paris.
Fierz, C., Egger, T., Gerber, M., Techel, F., Bavay, M., 2016. SnopViz, an Interactive Vizualization Tool for both Snow-Cover Model Output and Observed Snow Profiles. International Snow Science Workshop. ISSW, Breckenridge, Colorado, USA, pp. 637–641.
Gruber, S., Hoelzle, M., 2001. Statistical modelling of mountain permafrost distribution: local calibration and incorporation of remotely sensed data. Permafr. Periglac. Process. 12, 69–77.
Haberkorn, A., Hoelzle, M., Phillips, M., Kenner, R., 2015a. Snow as a driving factor of rock surface temperatures in steep rough rock walls. Cold Reg. Sci. Technol. 118,
64–75.http://dx.doi.org/10.1016/j.coldregions.2015.06.013.
Haberkorn, A., Phillips, M., Kenner, R., Rhyner, H., Bavay, M., Galos, S.P., Hoelzle, M., 2015b. Thermal regime of rock and its relation to snow cover in steep alpine rock
walls: Gemsstock, Central Swiss Alps. Geogr. Ann. Ser. A Phys. Geogr.http://dx.doi.
org/10.1111/geoa.12101.
Haberkorn, A., Wever, N., Hoelzle, M., Phillips, M., Kenner, R., Bavay, M., Lehning, M., 2016. Distributed snow and rock temperature modelling in steep rock walls using
Alpine3D. Cryosphere Discuss. 2016, 1–30.http://dx.doi.org/10.5194/tc-2016-73.
Hammonds, K., Baker, I., 2016. Investigating the thermophysical properties of the ice–snow interface under a controlled temperature gradient. Part II: analysis. Cold
Reg. Sci. Technol. 125, 12–20.http://dx.doi.org/10.1016/j.coldregions.2016.01.
006.
Hammonds, K., Lieb-Lappen, R., Baker, I., Wang, X., 2015. Investigating the thermo-physical properties of the ice–snow interface under a controlled temperature gra-dient: part I: experiments & observations. Cold Reg. Sci. Technol. 120, 157–167.
http://dx.doi.org/10.1016/j.coldregions.2015.09.006.
Hasler, A., Gruber, S., Beutel, J., 2012. Kinematics of steep bedrock permafrost. J.
Geophys. Res. Earth Surf. 117 (F1), F01016.http://dx.doi.org/10.1029/
2011jf001981.
Hasler, A., Gruber, S., Haeberli, W., 2011. Temperature variability and offset in steep
alpine rock and ice faces. Cryosphere 5 (4), 977–988.
http://dx.doi.org/10.5194/tc-5-977-2011.
Jamieson, B., 2006. Formation of refrozen snowpack layers and their role in slab
ava-lanche release. Rev. Geophys. 44 (2).http://dx.doi.org/10.1029/2005rg000176.(n/
a-n/a).
Jamieson, B., Fierz, C., 2004. Heatflow from wet to dry snowpack layers and associated faceting. Ann. Glaciol. 38, 187–194.
Keller, M., Hungerbuehler, G., Knecht, O., Sheikh, S., Beutel, J., Gubler, S., Fiddes, J., Gruber, S., 2010. In: iAssist: rapid deployment and maintenance of tiny sensing systems. Proceedings of the 8th ACM Conference on Embedded Networked Sensor Systems. ACM, Zurich, Switzerland, pp. 401–402.
Kenner, R., Phillips, M., Danioth, C., Denier, C., Zgraggen, A., 2011. Investigation of rock and ice loss in a recently deglaciated mountain rock wall using terrestrial laser
scanning: Gemsstock, Swiss Alps. Cold Reg. Sci. Technol. 67, 157–164.http://dx.doi.
org/10.1016/j.coldregions.2011.04.006.
Keusen, H.-R., Amiguet, J.-L., 1987. Die Neubauten auf dem Jungfraujoch. In: Geologie, Felseigenschaften, Permafrost. 30-31. Schweizer Ingenieur und Architekt, pp. 905–906.
Krautblatter, M., Funk, D., Günzel, F.K., 2013. Why permafrost rocks become unstable: a rock–ice-mechanical model in time and space. Earth Surf. Process. Landf. 38 (8),
876–887.http://dx.doi.org/10.1002/esp.3374.
Lehning, M., Bartelt, P., Brown, R.L., Fierz, C., Satyawali, P., 2002. A physical SNOWPACK model for the Swiss avalanche warning services. Part III: meteorological boundary conditions, thin layer formation and evaluation. Cold Reg. Sci. Technol. 35 (3), 169–184.
Lehning, M., Völksch, I., Gustafsson, D., Nguyen, T.A., Stähli, M., Zappa, M., 2006. ALPINE3D: a detailed model of mountain surface processes and its application to
snow hydrology. Hydrol. Process. 20 (10), 2111–2128.http://dx.doi.org/10.1002/
hyp.6204.
Magnin, F., Deline, P., Ravanel, L., Noetzli, J., Pogliotti, P., 2015. Thermal characteristics of permafrost in the steep alpine rock walls of the Aiguille du Midi (Mont Blanc
Massif, 3842 m a.s.l). Cryosphere 9, 109–121.
http://dx.doi.org/10.5194/tc-9-109-2015.
Makkonen, L., 2000. Models for the growth of rime, glaze, icicles and wet snow on structures. Phil. Trans. R. Soc. A 358, 2913–2939.
Marsh, P., 2006. Water Flow through Snow and Firn, Encyclopedia of Hydrological Sciences. John Wiley & Sons, Ltd.
McClung, D.M., Walker, S., Golley, W., 1994. Characteristics of snow gliding on rock. Ann. Glaciol. 19, 97–103.
Mitterer, C., Schweizer, J., 2012. Towards a Better Understanding of Glide-Snow Avalanche Formation. International Snow Science Workshop, Anchorage, Alaska, pp. 610–616.
Phillips, M., Haberkorn, A., Draebing, D., Krautblatter, M., Rhyner, H., Kenner, R., 2016a.
Seasonally intermittent waterflow through deep fractures in an Alpine Rock Ridge:
Gemsstock, Central Swiss Alps. Cold Reg. Sci. Technol. 125, 117–127.http://dx.doi.
org/10.1016/j.coldregions.2016.02.010.
Phillips, M., Schweizer, J., 2007. Effect of mountain permafrost on snowpack stability. Cold Reg. Sci. Technol. 47 (1–2), 43–49.
Phillips, M., Wolter, A., Lüthi, R., Amann, F., Kenner, R., Bühler, Y., 2016b. Rock slope failure in a recently deglaciated permafrost rock wall at Piz Kesch (Eastern Swiss
Alps), February 2014. Earth Surf. Process. Landf.http://dx.doi.org/10.1002/esp.
3992.
Pinzer, B.R., Schneebeli, M., Kaempfer, T.U., 2012. Vaporflux and recrystallization
during dry snow metamorphism under a steady temperature gradient as observed by
time-lapse micro-tomography. Cryosphere 6 (5), 1141–1155.http://dx.doi.org/10.
5194/tc-6-1141-2012.
Reuter, B., Schweizer, J., 2012. The effect of surface warming on slab stiffness and the
fracture behavior of snow. Cold Reg. Sci. Technol. 83–84, 30–36.http://dx.doi.org/
10.1016/j.coldregions.2012.06.001.
Reuter, B., van Herwijnen, A., Veitinger, J., Schweizer, J., 2015. Relating simple drivers
to snow instability. Cold Reg. Sci. Technol. 120, 168–178.http://dx.doi.org/10.
1016/j.coldregions.2015.06.016.
Schweizer, J., Jamieson, J.B., 2007. A threshold sum approach to stability evaluation of
manual snow profiles. Cold Reg. Sci. Technol. 47 (1–2), 50–59.http://dx.doi.org/10.
1016/j.coldregions.2006.08.011.
Schweizer, J., Kronholm, K., Jamieson, J.B., Birkeland, K.W., 2008. Review of spatial variability of snowpack properties and its importance for avalanche formation. Cold
Reg. Sci. Technol. 51 (2–3), 253–272.http://dx.doi.org/10.1016/j.coldregions.2007.
04.009.
Smith, M., Jamieson, B., Fierz, C., 2008. Observation and modeling of a buried melt-freeze crust. In: M.S. University (Ed.), International Snow Science Workshop. Montana State University, Whistler, Canada, pp. 170–178.
Sommer, C.G., Lehning, M., Mott, R., 2015. Snow in a very steep rock face: accumulation
and redistribution during and after a snowfall event. Front. Earth Sci. 3.http://dx.
doi.org/10.3389/feart.2015.00073.
Techel, F., Darms, G., 2014. Schnee und Lawinen in den Schweizer Alpen. In: Hydrologisches Jahr 2012/13, Eidgenössische Forschungsanstalt für Wald, Schnee und Landschaft WSL. W.I.f.S.a.A.R. SLF, Birmensdorf.
Techel, F., Stucki, T., Margreth, S., Marty, C., Winkler, K., 2015. Schnee und Lawinen in den Schweizer Alpen. In: Hydrologisches Jahr 2013/14, Eidgenössische
Forschungsanstalt für Wald, Schnee und Landschaft WSL. W.I.f.S.a.A.R. SLF, Birmensdorf.
Tsuboi, K., Kimura, S., 2012. Application of Eulerian approach to simulate hard rime
accretion. J. Adhes. Sci. Technol. 26 (4–5), 505–521.http://dx.doi.org/10.1163/
016942411x574646.
Veitinger, J., Sovilla, B., Purves, R.S., 2014. Influence of snow depth distribution on surface roughness in alpine terrain: a multi-scale approach. Cryosphere 8 (2),
547–569.http://dx.doi.org/10.5194/tc-8-547-2014.
Vionnet, V., Brun, E., Morin, S., Boone, A., Faroux, S., Le Moigne, P., Martin, E., Willemet, J.M., 2012. The detailed snowpack scheme Crocus and its implementation in SURFEX
v7.2. Geosci. Model Dev. 5 (3), 773–791.
http://dx.doi.org/10.5194/gmd-5-773-2012.
Warscher, M., Strasser, U., Kraller, G., Marke, T., Franz, H., Kunstmann, H., 2013. Performance of complex snow cover descriptions in a distributed hydrological model system: a case study for the high Alpine terrain of the Berchtesgaden Alps. Water
Resour. Res. 49 (5), 2619–2637.http://dx.doi.org/10.1002/wrcr.20219.
Wever, N., Fierz, C., Mitterer, C., Hirashima, H., Lehning, M., 2014. Solving Richards Equation for snow improves snowpack meltwater runoff estimations in detailed
multi-layer snowpack model. Cryosphere 8 (1), 257–274.http://dx.doi.org/10.5194/
tc-8-257-2014.
Winstral, A., Elder, K., Davis, R.E., 2002. Spatial snow modeling of wind-redistributed
snow using terrain-based parameters. J. Hydrometeorol. 3 (5), 524–538.http://dx.
doi.org/10.1175/1525-7541(2002)003<0524:ssmowr>2.0.co;2.
Wirz, V., Schirmer, M., Gruber, S., Lehning, M., 2011. Spatio-temporal measurements and
analysis of snow depth in a rock face. Cryosphere 5, 893–905.http://dx.doi.org/10.
5194/tc-5-893-2011.
Woo, M.-k., Heron, R., 1981. Occurrence of ice layers at the base of high Arctic
snow-packs. Arct. Alp. Res. 13 (2), 225–230.http://dx.doi.org/10.2307/1551198.
Woo, M.-K., Heron, R., Marsh, P., 1982. Basal ice in high Arctic snowpacks. Arct. Alp. Res. 14 (3), 251–260.
Yamaguchi, S., Watanabe, K., Katsushima, T., Sato, A., Kumakura, T., 2012. Dependence of the water retention curve of snow on snow characteristics. Ann. Glaciol. 53 (61),
6–12.http://dx.doi.org/10.3189/2012AoG61A001.