HAL Id: hal-01661692
https://hal.archives-ouvertes.fr/hal-01661692
Submitted on 12 Dec 2017
HAL is a multi-disciplinary open access
archive for the deposit and dissemination of sci-entific research documents, whether they are pub-lished or not. The documents may come from teaching and research institutions in France or abroad, or from public or private research centers.
L’archive ouverte pluridisciplinaire HAL, est destinée au dépôt et à la diffusion de documents scientifiques de niveau recherche, publiés ou non, émanant des établissements d’enseignement et de recherche français ou étrangers, des laboratoires publics ou privés.
Numerical signal processing methods for partial
discharge detection in more electrical aircraft
Cédric Abadie, Thibaut Billard, Thierry Lebey
To cite this version:
Cédric Abadie, Thibaut Billard, Thierry Lebey. Numerical signal processing methods for partial discharge detection in more electrical aircraft. ICD 2016 (1st Conference on Dielectrics), Jul 2016, Montpellier, France. pp. 1-4. �hal-01661692�
O
pen
A
rchive
T
OULOUSE
A
rchive
O
uverte (
OATAO
)
OATAO is an open access repository that collects the work of Toulouse researchers and
makes it freely available over the web where possible.
This is an author-deposited version published in :
http://oatao.univ-toulouse.fr/
Eprints ID : 18223
To link to this article :
DOI: 10.1109/ICD.2016.7547661
URL :
http://dx.doi.org/10.1109/ICD.2016.7547661
To cite this version :
Abadie, Cédric and Billard, Thibaut and Lebey,
Thierry Numerical signal processing methods for partial discharge
detection in more electrical aircraft. (2016) In: ICD 2016 (1st Conference
on Dielectrics), 3 July 2016 - 7 July 2016 (Montpellier, France).
Any correspondence concerning this service should be sent to the repository
administrator:
[email protected]
Numerical signal processing methods for partial
discharge detection in more electrical aircraft
Cedric ABADIE1,2 and Thibaut BILLARD11Technology Research Institute (IRT) Saint Exupéry 118 Route de Narbonne, 31432 Toulouse, France
Thierry LEBEY2
2LAPLACE Laboratory, CNRS-UPS-INP 118 Route de Narbonne, 31432 Toulouse, France
Abstract—In forecoming “more electrical aircrafts”, aircrafts
will become more compact and lighter. Hydraulic, pneumatic or mechanical systems will be replaced by electrical ones thus leading to an increased demand of electric power. The network voltage is expected to increase far above Paschen’s minimum, thus increasing the risk of partial discharges. Furthermore the use of inverter drives will be generalized and PD detection on square voltage powered equipments will become a mandatory challenge. The purpose of this study is to propose a method to denoise partial discharge signals embedded in the electromagnetic noise induced by switchings. This denoising is performed using the wavelet decomposition
Keywords—Partial discharge; square voltage; wavelet; automated method
I. INTRODUCTION
In forecoming “more electrical aircrafts”, hydraulic and/or pneumatic systems will be gradually replaced by electrical systems. The associated increased demand of electric power leads to an increase of the network voltage from 115VAC to 230VAC and/or from 270VDC to 540VDC. On the other hand, the widespread use of inverter drives (with their associated high dV/dt) will increase the electrical stresses on the insulation system, especially if wide band gap switch are to be used. Both events increase the risk of partial discharges (PD) ignition [1]. These discharges, known as the silent enemies, will affect the reliability of the equipment. Last, but not least, some of the electrical equipments may be located in unpressurized or under pressure zones. These parameters put together have an influence on discharges inception voltage and may also modify their nature. Therefore, for such operating conditions, it is important to pay a particular attention to the detection system characteristics in order to have the best signal to noise ratio while filtering the noise induced by the voltage switchings.
Compared to conventional PD measurements under AC and DC voltages, PD’s detection under repetitive impulse voltage appears more complex. The detection in the VHF [30- 300MHz] and UHF [300-3000MHz] range is one of the most widely used technique offering a high signal to noise ratio (SNR). Changes in the semiconductors devices technology (from Si to SiC or GaN) lead to use components presenting shorter rise times, inducing changes in the interference spectrum. The spectrum spreads to higher frequencies and it becomes more difficult to distinguish PD signals from these interferences [1]. In addition, we have recently shown that a decrease in the pressure modifies
the rise time of the PD pulses and therefore of the discharge spectrum[2], [3].
The aim of this study is to demonstrate the ability of the proposed denoising method based on the wavelet decomposition of PD noisy data obtained on samples supplied by PWM voltage. This study also shows the efficiency of a method of automated mother wavelet choice for extremely noisy signal.
II. EXPERIMENTAL SET-UP
A. PWM power supply
The PWM like voltage shape is created by a homemade PWM inverter associated to a high voltage power source (up to 1.7 kV DC and back up current peaks up to 50 A). This bipolar pulse like generator allows testing low voltage electric motors. The IGBTs components used are able to withstand 1.5 kV, allowing almost full use of the high power supply thus offering the possibility to reach Partial Discharge Inception Voltage (PDIV). The bipolar inverter drive part is fully adaptable: the duration of the pulses, the time between pulses, the switching frequency and the duty cycle may be modified.
B. Sensor
The non-intrusive sensor used to detect partial discharge is based on a capacitive effect. Partial discharge current impulses induce voltage changes at the terminals of the induced capacitance between the copper wire and oscilloscope input impedance. In order to increase signal amplitude, the capacitive effect may be increased thanks to an increase of the surface of the counter electrode.
C. High-pass filtering
High-pass analog filter allows to remove electro-magnetical noise coming from inverter drive switches. It is necessary to detect PDs during the switching. Obviously, the shortest the rise time, the highest the cut-off frequency.
D. Samples
The experiments were performed on twisted pair of enameled wires (nominal diameter Ø = 1,31 mm). The twisted pair samples are realized according to [4].
E. Signal acquisition
Data are displayed and recorded using a Tektronix MSO 5204 Digital Oscilloscope with a 2 GHz numerical bandwidth and 5 GS/s sampling rate for each channel.
III. INTERFERENCE ANALYSIS
Since PDs’ tests are generally carried out in air, the presence of parasites in the signal of interest may not be avoided. Thus, to be recognized as DP, the detected signal should appear with sufficient recurrence and be large enough to be considered as something other than just random noise.
The main sources of noise are divided in four categories classified by the type of interferences produced:
• The periodic pulse interferences caused by power or other periodical operation of electronics,
• The spectral interference from eg broadcast radio AM, FM or communication systems,
• The stochastic pulse interference, caused by occasional events related to power electronics, lightning strokes... • Other noise involving interference of the measurement
circuit and ambient noise
Fig. 1 shows that it is impossible to distinguish the presence of discharge. The noise amplitude induced by the switching is too large compared to the possible PD magnitude. It is therefore necessary to remove this noise prior to intend to detect any PDs. The easiest solution is to filter the signal with a high-pass filter. Nevertheless, using a filter often results in a loss of signal information regarding the content of frequency components below the cutoff frequency. !
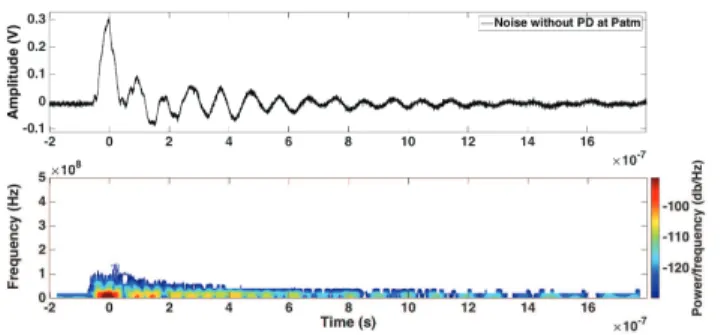
In order to analyze the frequency spectrum of the discharge for systems fed by inverter, two kinds of measurements are performed. Acquisitions of the noise existing for voltage lower than the PDIV (! PDIV – 10 V) and higher than the PDIV were performed. Note that in that case, the PDIV value was determined using a high-pass filtering.
The Short-Time Fourier transform (STFT) results reported in Fig. 2 shows that the spectral energy of the disturbance spreads up to 150 MHz, but only during the switchings “on/off” of the voltage. Thereafter, the remaining ringings, are negligible above 100 MHz. Under PDs, in Fig. 3, we can see that the spectral energy spreads up to 350 MHz. It is therefore possible to filter the noise while recovering part of the signal of the PD. However the research of this cutoff frequency may be complex and will depend of the user experience. It is therefore necessary to use an automated method that allows matching to all configurations.
!
IV. NUMERICAL PROCESSING
Wavelet Transform (WT), as the Fourier transform (FT) are signal processing mathematical tools realizing the decomposition of a signal into different basic functions. The basic functions of the FT being the sine and cosine functions precise frequency, results of this method provide information on the frequency content only of the signal. Its drawback lies in the ignorance on the time of appearance of this frequency.
Besides, the basic functions of the WT called "wavelets" allow a two-dimensional resolution in the frequency and time domains. The result of these two transforms represents the projection of a signal based on wavelets for the WT. The FT shows an extreme efficiency in the analysis of periodic phenomena, time-invariant and stationary technique whereas WT is screening all components produced by transients, variables time and non-stationary [5].
Therefore, since PDs have a non-periodic nature and very fast transient characteristics, the latter method of WT seems more suited. More particularity, this technique may be used to suppress the noise superimposed on DPs signals preventing their correct interpretation. The time-frequency performances offered by the wavelet analysis allow to divide the signal into several pieces and to analyze the contents separately. This method is therefore suitable as soon as the knowledge all the frequency components of a signal at a given time is wanted. A wavelet analysis uses a “time – window” whose dimensions are adjustable to split the signal and to observe a portion. This window may be moved along the signal and for each position, the spectrum may be calculated. This process is then repeated for other window sizes. Finally, the result is a set of time-frequency representation of the signal, where each has a different resolution. That's why wavelet transform is described
Fig. 1. Noisy signal induced by switching (black)
Fig. 2. Noisy signal induced by switching without PD (top curve) STFT of noise without PD (lower curve)
Fig. 3. Noisy signal induced by switching with PD (top curve) STFT of noise with PD (lower curve
as multi-resolution analysis because it provides information from the overview to the details.
A. Mother wawelet choice
One of the important parameters for a denoising based on the wavelet technique is the choice of the mother wavelet. Indeed this choice directly impacts the quality of the noise suppression. This choice is often realized by the correlation between the shape of the wavelet and the DP signal. Since, it is difficult to know in advance the shape of the spectrum induced by switchings, it is necessary to use an automated method, independent of the waveform characteristics of the signal under test.
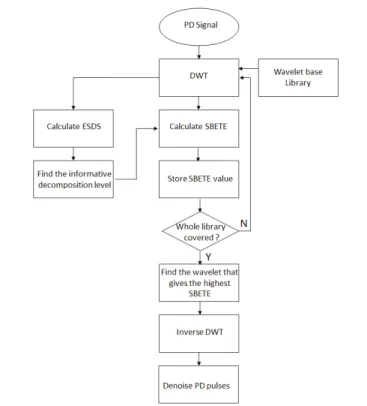
The method was proposed by [6]. The selection criterion of the mother wavelet rests on the energy and entropy of each of the levels of decomposition.
The first step of the method consists in finding the decomposition level containing the information associated to the discharge signal. For this, the energy content is considered for each level of decomposition. Using the equation (1), the decomposition level at which the signal is the least noisy as compared to other levels of decompositions is determined. The highest “energy slop for detail sub-band” (ESDS) value shows the most informative decomposition level, where L indicates the level of decomposition and EDx is the decomposition level
energy at scale x.
(1)
Once the decomposition level presenting the most useful information has been determined, the mother wavelet maximizes the energy contained in the previously determined level of decomposition. Indeed each decomposition level corresponds to a specific frequency range. If the signal has frequency components in this band, wavelet coefficients in the decomposition level will be significant. The energy at each decomposition level is given by Eq (2), where a corresponds to the decomposition level, N is the number of wavelet coefficients,
W(a,i) indicates the wavelet coefficients at decomposition level a and i is a variable changing from 1 to N.
(2) Another important point is the distribution of wavelet coefficients. Indeed PDs being fast phenomena, energy is concentrated in a very short period of time. Entropy is defined as the probability distribution of a random variable. In our case we will look for a low entropy because it corresponds to a high concentration of energy. In (3), a corresponds to the decomposition level, pi given by Eq (4) is the ratio of each decomposition level component energy to total decomposition level energy.
(3)
(4) The optimal wavelet is obtained for the one maximizing the energy in the frequency range of interest of the signal while minimizing the entropy. The sub-band energy to entropy (SBETE) is calculated for each wavelet and the SBETE presenting the largest value is considered as the optimal wavelet to denoise the signal.
(5) The flowchart of the method is shown in Fig. 4.
B. Application of the method on PD acquisitions
In order to validate the method and the quality of noise reduction, the PDs measurements were performed on twisted pair samples under PWM voltage. These tests were realized at atmospheric pressure. A conventional high-pass filter was used to ensure that the signals observed with the treatment method by wavelet, are not false positives or noise poorly filtered.
The PD noisy signal PWM is given in Fig. 5. At atmospheric pressure the inception voltage on twisted pair is around 1kV. The noise (black signal) has a larger magnitude than the PD signal measured thanks to the analog filtering (red signal).
Fig. 4. Flowchart of automated mother wavelet choice and de-noising PD pulses
According to the above method, the optimal wavelet mother for this signal is wavelet 'db5'. Fig. 6 proves that the noise is completely removed, leaving only the signals temporally corresponding to the PD signals observed after high-pass filtering.
It is observed that the magnitude of the wavelet denoised signal has a larger magnitude than the analogically filtered signal (Fig. 7). The first assumption is that the method allows a better noise suppression than analog filtering. Nevertheless attention must be paid since some errors may be induced during the reconstruction of the signal. Indeed the different levels of
decomposition for the reconstruction of the signal represent a specific frequency range. There may be a slight overlap of two consecutive levels of decomposition, thus inducing an error in the reconstruction. The signal may have a larger amplitude after reconstruction due to this overlap.
The main advantage of this method is the ability to be automatized and thus adapted to all cases whatever the noise spectra are. However, to obtain effective noise suppression, the sampling frequency must be sufficient in order to reconstruct fast phenomena such as PDs.
V. CONCLUSIONS
The aim of this study is to show that the spectrum of discharges occurring at atmospheric pressure for voltage conditions close of the inverters fed ones, source is larger than the spectrum of the noise-induced switching. Indeed the discharges spectrum extends up to 350 MHz while the noise does not exceed 150MHz. The literature shows that the discharge spectrum may vary depending on different parameters. In [1], it was shown that shorter rise times can excite PD having larger magnitudes and presenting more energy at high frequency which would have a positive impact in view of their detection. Another important parameter in aeronautics applications is the influence of the pressure; it has been shown that a decrease in pressure causes a change of the nature of the PD and on its spectral form [3]. The signal associated with a DP in low pressure appears to have slower fronts which would induce a decrease in the frequency range over which extends its spectrum. Moreover the increasing of the voltage risetimes with the changes of semiconductors devices technology will induce a noise spectrum that extends much higher frequencially. It is therefore necessary to realize further tests to see the ability of the proposed approach to detect DP in these conditions.
REFERENCES
[1] P. Wang, A. Cavallini, and G. C. Montanari, “The influence of square voltage rise time on partial discharge spectra,” in 2012 Annual Report
Conference on Electrical Insulation and Dielectric Phenomena (CEIDP),
2012, pp. 129–132.
[2] D. G. Kasten, X. Liu, S. A. Sebo, D. F. Grosjean, and D. L. Schweickart, “Partial discharge measurements in air and argon at low pressures with and without a dielectric barrier,” IEEE Trans. Dielectr. Electr. Insul., vol. 12, no. 2, pp. 362–373, Apr. 2005.
[3] D. F. Grosjean, D. L. Schweickart, D. G. Kasten, S. A. Sebo, and X. Liu, “Development of procedures for partial discharge measurements at low pressures in air, argon and helium,” IEEE Trans. Dielectr. Electr. Insul., vol. 15, no. 6, pp. 1535–1543, Dec. 2008.
[4] BSI, “IEC 60851:2008 Winding wires - Test methods.” 2008.
[5] B. Vigneshwaran, R. V. Maheswari, and P. Subburaj, “An improved threshold estimation technique for partial discharge signal denoising using Wavelet Transform,” in 2013 International Conference on Circuits,
Power and Computing Technologies (ICCPCT), 2013, pp. 300–305.
[6] O. Altay and O. Kalenderli, “Wavelet base selection for de-noising and extraction of partial discharge pulses in noisy environment,” IET Sci.
Meas. Technol., vol. 9, no. 3, pp. 276–284, 2015.
Fig. 5. PWM voltage (blue) PD noisy signal under PWM voltage (black) Signal filtered analogically with high-pass filter (150 MHz)(red)
Fig. 6. PWM voltage (blue) Signal de-noised by wavelet method (red)
Fig. 7. Zoom on voltage rise time (blue) and comparison between the signal de-noised by wavelet (red) and analogically filtered signal (black)