HAL Id: hal-00318199
https://hal.archives-ouvertes.fr/hal-00318199
Submitted on 21 Nov 2006
HAL is a multi-disciplinary open access
archive for the deposit and dissemination of
sci-entific research documents, whether they are
pub-lished or not. The documents may come from
teaching and research institutions in France or
abroad, or from public or private research centers.
L’archive ouverte pluridisciplinaire HAL, est
destinée au dépôt et à la diffusion de documents
scientifiques de niveau recherche, publiés ou non,
émanant des établissements d’enseignement et de
recherche français ou étrangers, des laboratoires
publics ou privés.
the MaCWAVE winter campaign ? Part I: Observations
with collocated radars
P. Hoffmann, A. Serafimovich, D. Peters, P. Dalin, R. Goldberg, R. Latteck
To cite this version:
P. Hoffmann, A. Serafimovich, D. Peters, P. Dalin, R. Goldberg, et al.. Inertia gravity waves in the
up-per troposphere during the MaCWAVE winter campaign ? Part I: Observations with collocated radars.
Annales Geophysicae, European Geosciences Union, 2006, 24 (11), pp.2851-2862. �hal-00318199�
www.ann-geophys.net/24/2851/2006/ © European Geosciences Union 2006
Annales
Geophysicae
Inertia gravity waves in the upper troposphere during the
MaCWAVE winter campaign – Part I: Observations with collocated
radars
P. Hoffmann1, A. Serafimovich1, D. Peters1, P. Dalin2, R. Goldberg3, and R. Latteck1
1Leibniz-Institut f¨ur Atmosph¨arenphysik, K¨uhlungsborn, Germany 2Swedish Institute of Space Physics, Kiruna, Sweden
3NASA/Goddard Space Flight Center, Greenbelt, Maryland, USA
Received: 6 March 2006 – Revised: 16 September 2006 – Accepted: 18 October 2006 – Published: 21 November 2006
Abstract. During the MaCWAVE campaign, combined
rocket, radiosonde and ground-based measurements have been performed at the Norwegian Andøya Rocket Range (ARR) near Andenes and the Swedish Rocket Range (ES-RANGE) near Kiruna in January 2003 to study gravity waves in the vicinity of the Scandinavian mountain ridge. The in-vestigations presented here are mainly based on the evalu-ation of continuous radar measurements with the ALWIN VHF radar in the upper troposphere/ lower stratosphere at Andenes (69.3◦N, 16.0◦E) and the ESRAD VHF radar near Kiruna (67.9◦N, 21.9◦E). Both radars are separated by about 260 km. Based on wavelet transformations of both data sets, the strongest activity of inertia gravity waves in the upper tro-posphere has been detected during the first period from 24– 26 January 2003 with dominant vertical wavelengths of about 4–5 km as well as with dominant observed periods of about 13–14 h for the altitude range between 5 and 8 km under the additional influence of mountain waves. The results show the appearance of dominating inertia gravity waves with charac-teristic horizontal wavelengths of∼200 km moving in the op-posite direction than the mean background wind. The results show the appearance of dominating inertia gravity waves with intrinsic periods in the order of∼5 h and with horizon-tal wavelengths of 200 km, moving in the opposite direction than the mean background wind. From the derived down-ward energy propagation it is supposed, that these waves are likely generated by a jet streak in the upper troposphere. The parameters of the jet-induced gravity waves have been esti-mated at both sites separately. The identified gravity waves are coherent at both locations and show higher amplitudes on the east-side of the Scandinavian mountain ridge, as expected by the influence of mountains.
Correspondence to: P. Hoffmann (hoffmann@iap-kborn.de)
Keywords. Meteorology and atmospheric dynamics
(Mesoscale meteorology; Middle atmosphere dynamics; Waves and tides)
1 Introduction
To understand the structure and dynamics of the atmosphere and its variability, it is important to know the coupling processes between different atmospheric regions from the troposphere up to the thermosphere. The dynamical cou-pling mainly includes the generation of different atmospheric waves (gravity waves, tides, planetary waves), their propaga-tion through the atmosphere, the interacpropaga-tion between differ-ent waves and their impact upon the mean circulation. Today it is recognized that gravity waves are an essential part of the dynamics of the upper atmosphere. The theory to describe these waves has been essentially stimulated by the pioneering work of Hines (1960). Over the last decades, a multitude of experimental observations, theoretical and modelling stud-ies have considerably improved our understanding of grav-ity waves and their role in the atmospheric circulation (e.g., Fritts, 1984, 1989; Fritts and Alexander, 2003).
To study the dynamical coupling processes, a highly coordinated rocket and ground-based program MaCWAVE (Mountain and Convective Waves Ascending VErtically) was performed at the Norwegian Andøya Rocket Range (ARR) near Andenes (69.3◦N, 16◦E) and the Swedish Rocket Range (ESRANGE) near Kiruna 67.9◦N, 21.1◦E), at first during summer conditions in July 2002 and contin-ued with a winter campaign in January 2003. The cam-paigns were designed to investigate gravity waves linked to the Scandinavian mountain ridge, to track these waves using different instruments such as radar/rocket/lidar/radiosondes
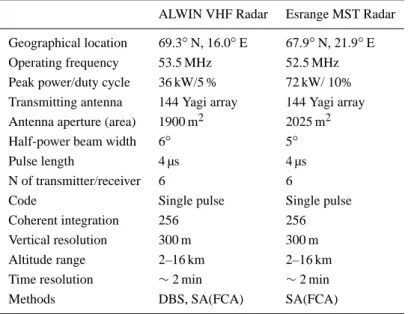
Table 1. Parameters of the VHF radar (ALWIN) at Andenes and the Esrange MST radar (ESRAD) at Kiruna.
ALWIN VHF Radar Esrange MST Radar
Geographical location 69.3◦N, 16.0◦E 67.9◦N, 21.9◦E Operating frequency 53.5 MHz 52.5 MHz Peak power/duty cycle 36 kW/5 % 72 kW/ 10% Transmitting antenna 144 Yagi array 144 Yagi array Antenna aperture (area) 1900 m2 2025 m2 Half-power beam width 6◦ 5◦ Pulse length 4 µs 4 µs N of transmitter/receiver 6 6
Code Single pulse Single pulse Coherent integration 256 256 Vertical resolution 300 m 300 m Altitude range 2–16 km 2–16 km Time resolution ∼ 2 min ∼ 2 min Methods DBS, SA(FCA) SA(FCA)
data from troposphere up to the mesosphere, and to de-tect energy dissipation in the upper atmosphere produced by wave breaking. For more details on both campaigns we re-fer the reader to Goldberg et al. (2004, 2006). During the first MaCWAVE summer campaign, investigations of gravity waves in the troposphere and stratosphere have been carried out using combined radar and lidar data (Sch¨och et al., 2004). Here we report on measurements of upper tropospheric and lower stratospheric gravity waves at two different lo-cations near the Scandinavian mountain ridge obtained with continuous VHF radar observations during the MaCWAVE winter campaign in January 2003. The use of two collocated radars allows us to identify common wave events and to dis-cuss temporal and spatial differences of the observed waves. This a continuative paper to our investigations of the proper-ties of inertia gravity waves in the upper troposphere/lower stratosphere over Northern Germany where the influence of orographically excited waves are weak and an upper tropo-spheric jet occurred in connection with a poleward Rossby wave breaking event in December 1999 (Peters et al., 2003; Serafimovich et al., 2005).
In this paper we are mainly focussing on the investiga-tion of inertia gravity waves (IGW) induced by a jet streak in the upper troposphere under the presence of strong oro-graphically induced waves. For this purpose the inertia grav-ity waves at both sides of the Scandinavian mountain ridge have been filtered out from the background winds and moun-tain waves. In a companion paper (Part II, Serafimovich et al., 2006), comparisons of inertia gravity wave properties diagnosed from observations with the ALWIN radar at An-denes and mesoscale MM5 model data are presented, result-ing in a fairly well agreement, and the capabilities of both methods for the analysis of such processes are proved.
The paper is organized as follows. After a short descrip-tion of the used radars in Sect. 2, the meteorological back-ground for the inertia gravity wave generation is discussed in Sect. 3. Section 4 is devoted to the estimation of iner-tia gravity wave characteristics for each radar location sepa-rately and by a complex cross-spectral analysis of the data of both radars during the period from 24–26 January 2003 with the strongest gravity wave activity. The main results are dis-cussed in Sect. 5 and we give concluding remarks in Sect. 6.
2 ALOMAR VHF radar (ALWIN) and Esrange MST
radar (ESRAD)
The investigations presented here are based on observations mainly made by collocated radars at high latitudes in the vicinity of the Scandinavian mountain ridge. We processed data from the ALOMAR VHF radar (ALWIN) in Andenes and Esrange MST radar (ESRAD) in Kiruna. Details of the radar parameters used are summarized in Table 1. Both radars, the ALWIN radar in Andenes and ESRAD radar in Kiruna are separated by about 260 km and have comparable characteristics. They are using the same antenna size and nearly the same operation frequency 53.5 and 52.0 MHz.
The ESRAD radar (Chilson et al., 1999) as well as the ALWIN radar (Latteck et al., 1999) are measuring wind com-ponents in the Stratospheric-Tropospheric (ST) mode at the height range of 2–16 km with a resolution in height of 300 m and in time of 2 min. The transmitter and the data acquisi-tion system were built by ATRAD (Atmospheric Radar Sys-tems Pty. Ltd, Thebarton, S.A., Australia). Wind measure-ments are carried out in the Spaced Antenna (SA) mode using the Full Correlation Analysis (FCA) method and additionally
for the ALWIN radar by the Doppler-Beam-Swinging (DBS) method. For further investigations in this work the data aver-aging over 30 min intervals is sufficient to estimate parameter of inertia gravity waves. In order to avoid missing values in the time series caused by low signal-to-noise ratios of the backscattered radar signals, only height channels up to about 14 km have been evaluated.
3 Meteorological background
The MaCWAVE winter campaign were performed at An-denes and Kiruna at two periods from 24–26 January and from 28–29 January 2003 (Goldberg et al., 2006). Figure 1 shows the zonal winds derived from ECMWF (European Center for Medium-Range Weather Forecast) analysis for the 500 hPa level corresponding to a height of about 6 km for both periods. On 24 January 2003 during the first part of the campaign (Fig. 1, upper panel), an north-eastward directed jet stream occurs across the Scandinavian mountains with a centre south of the Andøya-Esrange region in Northern Scan-dinavia. During the second part of the MaCWAVE winter campaign from 28–29 January 2003 (Fig. 1, lower panel) the centre of the jet stream is placed over Central Europe and the horizontal winds over Northern Scandinavia turned to weaker northwesterlies.
To set these meteorological situations in relation to the mean winter behaviour, Fig. 2 represents the ECMWF zonal winds at (69◦N, 16◦E) near Andenes during both periods of the MacWAVE winter campaign on 24–26 January and 28– 29 January 2003, respectively, in comparison to the clima-tologically zonal winds of the mean winter months Decem-ber, January and February from 1991–2001. The zonal wind shows two significant peaks at about 9 and 30 km during the first period (Fig. 2, left part). On 28–29 January during the second part of the winter campaign (Fig. 2, right part), the tropospheric jet in the zonal wind disappeared.
In Fig. 3 the mean winds derived for both radar locations on the east and west side of the Scandinavian mountain ridge are presented. The temporal development of the zonal wind (Fig. 3a) is characterized by an oscillation with a period of about 1–2 days with maxima (∼40 ms−1) of the zonal wind on 24 January at both locations, whereas the maxima in the meridional wind (∼30 ms−1) (Fig. 3b) occur approximately 12 h later. Note that the zonal winds are larger at Kiruna by
∼10 ms−1(Figs. 3c and d) as expected due to the amplifica-tion by mountain waves (Queney, 1948; Smith, 1979). How-ever, further investigations are required to understand these processes in more detail. During the second part of the win-ter MaCWAVE campaign on 28–29 January 2003, the wind variations occur markedly weaker at both radar locations in comparison to the period from 24–26 January 2003, consis-tent with the ECMWF results shown in Fig. 1.
-60 -50 -40 -30 -20 -10 0 10 20 30 40 50 60 Longitude [°E] 30 40 50 60 70 80 L a ti tu d e [° N ] -15 -10 -5 0 5 10 15 20 25 30 35 40 45 50 Z ona lw in d [m/ s ] Wind vectors [m/s] 65 -60 -50 -40 -30 -20 -10 0 10 20 30 40 50 60 Longitude [°E] 30 40 50 60 70 80 L a ti tu d e [° N ] -15 -10 -5 0 5 10 15 20 25 30 35 40 45 50 Z ona lw in d [m/ s ] Wind vectors [m/s] 65 Andenes Kiruna Andenes Kiruna
Fig. 1. Zonal wind and wind vectors derived from ECMWF analy-sis for the 500 hPa level at 24 January 2003, 12:00 UT (upper panel) and 28 January 2003, 12:00 UT (lower panel).
4 Data analyses
4.1 Detection of gravity waves
The calculation of gravity wave parameters is based on wind perturbations, which have been estimated from the wind measurements after linear interpolations to substitute miss-ing values followmiss-ing by an appropriate broad band-pass fil-tering in height and time to remove the background winds. Suppose, that the perturbations are described by variations of amplitudes a(x, y, z, t ) of the wind components
a(x, y, z, t )= a0· exp(i(kx + ly + mz − ωobt )), (1)
where a can be perturbations of zonal u′ or meridional v′ winds, temperature T′ or pressure p′ with a time t. The zonal, meridional and vertical wave numbers are denoted by
k, l and m in x-, y-, z-directions, respectively, and ωob is
the wave frequency observed at a fixed location. With the Doppler relation
Fig. 2. Mean climatologic zonal winds derived from ECMWF data (red) at (69◦N, 16◦E) near Andenes in comparison to the winds during both periods of the MaCWAVE winter campaign (blue) on 24–26 January 2003 (left) and 28–29 January 2003 (right). The variances are represented by the dashed lines.
Fig. 3. Mean zonal and meridional winds measured at Andenes (a, b) and Kiruna (c, d) from 23–29 January 2003. The data are smoothed using a low-pass filter with cut-off frequencies corresponding to 4 h in time and 600 m in altitude.
ωob depends on the intrinsic frequency ˆω, the horizontal
wave number kh= √
k2+l2 and the mean background
hori-zontal wind component u given in the same direction as the horizontal wave number kh. Corresponding to Zink and
Vin-cent (2001), we adopt here the convention of a positive intrin-sic frequency ˆω and define a negative vertical wave number
m for waves propagating energy upwards.
The perturbations are characterized by a superposition of atmospheric waves with different frequencies. In order to estimate inertia gravity wave parameters, individual waves have to be separated or isolated by the application of reason-able band-pass filtering methods. To detect the presence of a wave in the data and to avoid arbitrary choices of
inappro-priate filter parameters, a wavelet transform has been applied (Torrence and Compo, 1998; Zink and Vincent, 2001). This technique is becoming a common tool for analysing local-ized variations due to their possibilities to resolve the waves in frequency domain as well as in the time or height. Details of the methods used here are presented in Serafimovich et al. (2005).
In order to examine the height-time distribution of the wind perturbations over the whole period of the MaCWAVE winter campaign, the background winds have been removed with a band-pass filtering with bandwidths of 2–40 h in time and 0.8–6 km in height. Then we used the summarized scaled-averaged wavelet power as proposed by Torrence and
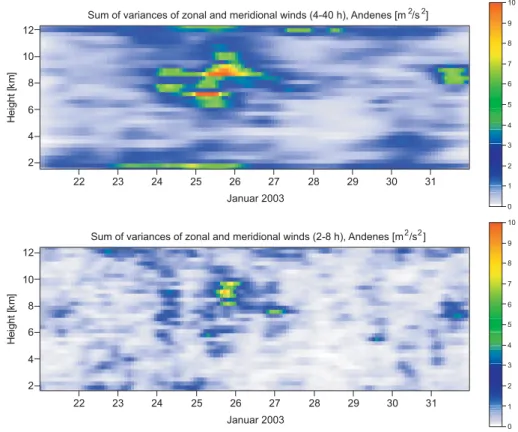
Fig. 4. Sum of variances of zonal and meridional winds for periods 4–40 h (upper part) and 2–8 h (lower part), derived from ALWIN VHF radar measurements at Andenes.
Compo (1998). This method is very efficient and comparable to the variances estimated after a classical Butterworth band-pass filtering. Here the variances have been estimated from the zonal and zonal and meridional winds at different heights at Andenes and Kiruna for periods between 4–40 h and tween 2–8 h, respectively (Figs. 4 and 5). For periods be-tween 4–40 h at Andenes (Fig. 4, upper panel), the strongest values of the summarized variances of zonal and meridional winds occur at heights between 6–10 km during the first part of the winter MaCWAVE campaign on 24–26 January. The variances for periods between 4–40 h at Kiruna from 24– 26 January (Fig. 5, upper panel) are stronger than the cor-responding Andenes values, also at heights above 10 km as expected due to additional orographic effects. Considering the variances between 2–8 h with weaker values on 25–26 January at Andenes (Fig. 4, lower panel) and from 24–26 January at Kiruna (Fig. 5, lower panel) we conclude, that the largest part of the observed variances results from the gravity waves with periods larger than 8 h. During the second part of the campaign from 28–29 January 2003 no strong wave ac-tivity has been observed in the upper troposphere at Andenes (Fig. 4) and Kiruna (Fig. 5).
Note that mountain waves generated by a steady back-ground flow are regarded as stationary relative to the back-ground (Vosper and Worthington, 2002). Therefore the presence of mountain waves cannot be detected with the method used
in Figs. 4 and 5. An appropriate method to check the pres-ence of waves in the atmosphere consists in the evaluation of the rotary spectra (Thompson, 1978). The calculation of the rotary spectrum by the Fourier transform of the complex velocity vector u′(z)+iv′(z) leads to an asymmetrical
func-tion. The dominance of clockwise (counterclockwise) rotat-ing waves are associated with negative (positive) frequencies in the rotary power spectrum and allows directly to estimate the vertical direction of energy propagation (Guest et al., 2000). This method has been used by Peters et al. (2003) and Serafimovich et al. (2005) to diagnose an inertia gravity wave generated by a tropospheric jet during a Rossby wave breaking event.
Figure 6 shows the rotary spectra for Andenes and for Kiruna derived from wind perturbations from 1.5–12.4 km only filtered in time for periods between 8–18 h, but here without any filtering in the vertical direction in order to de-scribe the vertical structure. At Andenes (Fig. 6a) the pres-ence of two waves is clearly indicated: one dominating wave with a vertical wavelength of about ∼10 km and a second wave with a vertical wavelength of about 4–5 km. At Kiruna on the lee side of the Scandinavian mountain ridge (Fig. 6b), the amplitudes of a dominating wave with a vertical wave-length of about 7–8 km are larger in comparison to the An-denes results.
Fig. 5. As Fig. 4, but derived from ESRAD VHF radar measurements at Kiruna.
Fig. 6. Results of rotary spectra averaged for 12 h starting on 24 January 2003, 00:00 UT applied on Radar measurements at Andenes (a) and at Kiruna (b) after band-pass filtering only in the time domain for periods from 8–18 h.
From the dominance of the negative parts of the spectra of the wave with the vertical wavelength of about 10 km at Andenes and about 7–8 km at Kiruna, we conclude that these waves show upward directed energy propagations. Follow-ing Queney (1948) and takFollow-ing into account, that the mean flow is directed perpendicular to the Scandinavian mountain ridge, we suppose, that these waves represent orographically generated mountain waves. This is also supported by the ver-tical velocities measured with the ALWIN VHF radar in DBS mode (Fig. 7). The method to use vertical winds measured by VHF radars as indications of mountain waves has been pro-posed, e.g., by Ecklund et al. (1981), or Balsley and Carter
(1989) and has been compared with models by Vosper and Worthington (2002). As indicated in the mean profile of the vertical winds (Fig. 7, left) and by the horizontal lines in the right part of Fig. 7, we detect a vertical distance of about 5 km between maxima and minima of the vertical winds on 24–25 January 2003, consistent with the estimated vertical wave-length of ∼10 km derived from the rotary spectra (Fig. 6). Note that the height-time plot of the vertical velocity shows a phase change during 24 and 25 January, in correspondence to the changing mean horizontal winds (Fig. 3). Such a be-haviour is characteristic for transient mountain waves as de-scribed by Vosper and Worthington (2002). From Figs. 6 and
7 we conclude that at Andenes an unsteady mountain wave with a vertical wavelength of about 10 km appeared which has a shorter wavelength on the easterly side of the Scandi-navian mountains.
In the following we are focussing on the investigation of the inertia gravity waves with vertical wavelengths of about 5 km and their relation to the observed jet in the up-per troposphere, however under the influence of the moun-tain waves. To separate and identify these waves and con-sider their height and time dependence at both radar loca-tions, wavelet transforms have been applied on time series of the zonal and meridional winds for constant height ranges as well as on wind profiles versus height for fixed time inter-vals. Figure 8 (upper panel) shows the wavelet transform of the time series averaged over the altitude ranges 6–7 km for Andenes (Fig. 8a) and for Kiruna (Fig. 8c). Enhanced wave activity has been observed on 24–26 January 2003 in the up-per troposphere with dominant up-periods of about 12–14 h, the amplitudes and their significance are higher at Kiruna. Fig-ure 8 (lower panel) represents the wavelet transforms of ver-tical profiles of horizontal winds averaged over 2 h during pe-riods with enhanced wave activity for Andenes (Fig. 8b) and for Kiruna (Fig. 8d) showing dominant vertical wavelengths of ∼4–5 km, again with larger amplitudes at Kiruna. The significance levels and values influenced by boundary effects are indicated. For details we refer the reader to Torrence and Compo (1998) and Serafimovich et al. (2005).
4.2 Estimation of gravity wave parameter
To investigate the characteristics of these gravity waves in de-tail, we used the information of the wavelet spectra (Fig. 8), and applied a band-pass filtering with bandwidths 8–18 h and 2–6 km to estimate and separate wind perturbations from the mean winds.
With the derived zonal and meridional wind perturbations, we use the hodograph technique and the rotary spectra to es-timate the parameter of the inertia gravity waves and their relation to the observed jet in the upper troposphere. Both methods have been described in detail by Serafimovich et al. (2005). The rotary spectrum has already been applied on the wind perturbations without any height filtering (Fig. 6) indi-cating the presence of two waves.
Figure 9 represents the rotary spectra applied on wind per-turbations after a band-pass filtering with bandwidths for waves with periods of 8–18 h and vertical wavelengths be-tween 2 and 6 km. The differences bebe-tween the positive and negative parts of the spectra are significant by more than 95% as labeled by the circles, triangles and diamonds. This result clearly indicates the presence of inertia gravity waves with a vertical wavelength of about 5 km at Andenes and Kiruna. From the dominance of the positive parts of the spectra at both locations, we conclude that these waves show down-ward directed energy propagations in the troposphere, so that
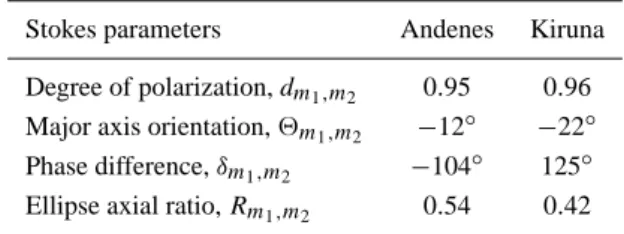
Table 2. Stokes parameters derived from radar measurements on 25 January 2003 for 1 h starting from 09:00 UT and averaged in wavelengths from 3.8 km to 6.4 km.
Stokes parameters Andenes Kiruna
Degree of polarization, dm1,m2 0.95 0.96
Major axis orientation, 2m1,m2 −12◦ −22◦
Phase difference, δm1,m2 −104◦ 125◦
Ellipse axial ratio, Rm1,m2 0.54 0.42
we assume that these waves are generated by the jet in the upper troposphere.
The hodograph analysis has been introduced by Gill (1982) in connection with a rotating fluid and applied first to IGWs by Cot and Barat (1986). The application of the hodo-graph analysis on the radar measurements at Andenes and Kiruna is shown in Fig. 10 for upper tropospheric heights. In both cases, the ellipses have an anticlockwise rotational sense which in the northern hemisphere is related to a down-ward energy propagation. The ratios of the major to the mi-nor axes of the ellipses, correspond without any wind shear effect to an intrinsic period of 5.2 h at Andenes and 6.4 h at Kiruna, respectively. The horizontal propagation of these in-ertia gravity waves can be derived from the orientation of the ellipses with an uncertainty of 180◦without additional knowledge of temperature or vertical wind perturbations, re-sulting here to−12◦at Andenes and−42◦at Kiruna. This difference may be appear as too large, however, we have to consider that the hodograph is only a snapshot and applicable for monochromatic waves.
In addition, Vincent and Fritts (1987) and Eckermann and Vincent (1989) presented a Stokes-parameter method which results in a set of gravity wave parameters comparable to those of the hodograph analysis, but with the possibility to average over the duration of the wave and selected verti-cal wave number bands m ǫ [m1, m2]. We applied here
this method on both radar measurements at Andenes and Kiruna during the period with strongest wave activity for vertical wave numbers m1, m2corresponding to wavelengths
between 3.8–6.4 km, respectively. Mean results using the Stokes-parameter analysis are presented in Table 2. Note that again the derived parameters as the degree of polariza-tion, dm1,m2, the major axis orientation, describing the wave
propagation direction 2m1,m2 for Andenes and Kiruna with
values of−12◦and−22◦, respectively, as well as the ellipse axial ratio Rm1,m2are comparable at both locations and to the
independent hodograph analyses.
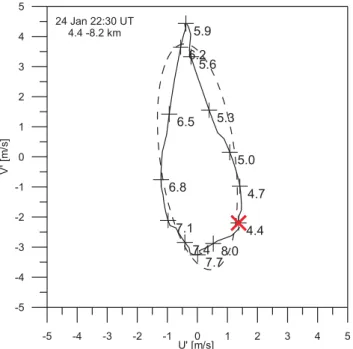
These results are in a sufficient agreement with the hodo-graph of the wind fluctuations derived from a high-resolution balloon sounding (Fig. 11) launched at Andenes in the frame of the MaC-WAVE campaign. Following Guest et al. (2000) and Peters et al. (2003), the wind fluctuations were
23 24 25
January 2003
ALWIN radar Andenes - vertical wind (m/s)
2 4 6 8 10 12 altitud e (km) -1.4 -1.2 -1 -0.8 -0.6 -0.4 -0.2 0 0.2 0.4 0.6 0.8 1 1.2 1.4 -0.4 0 0.4 w (m/s) 2 4 6 8 10 12 altitude (km) 25 Jan 2003 06 UT +/- 1h
Fig. 7. Vertical winds derived from DBS measurements with the ALWIN VHF radar at Andenes. Left part: Mean profile averaged over 2 h on 25 January 2003. Right part: Variations of the vertical winds during the period from 23–25 January 2003. The horizontal lines indicate the distance between maxima and minima of the vertical winds.
Fig. 8. Sum of the wavelet spectra applied to the zonal and meridional winds. The upper panel (a, c) shows the Morlet wavelet transform of the time series averaged over the altitude ranges 6–7 km. The lower panel (b, d) shows the averaged in time Paul wavelet transforms of vertical profiles of horizontal winds. Wind measurements at Andenes (a, b) and Kiruna (c, d) have been used. Bold green lines indicate regions with 95 % significance level, shaded areas mark zones where boundary effects appear.
determined by the differences between the measured values and a polynomial fit of 4th order for each component applied on tropospheric heights. From the ratio of the major to the minor axis of the ellipse, we estimate an intrinsic period of 4.2 h. The ellipse with an orientation of about−83◦shows an anticlockwise rotational sense corresponding to a downward directed energy propagation.
To estimate the intrinsic frequency ˆω and the horizontal wave number kh of a gravity wave, we use the polarization,
dispersion and Doppler equations. The polarization relation is defined as R= fc ˆω − kh mˆω ∂v ∂z . (3)
Here the vertical wind shear effect in the background wind, as introduced by Hines (1989), is included by the term
∂¯v/∂z, where v denotes the mean horizontal wind
compo-nent perpendicular to the wave propagation. The dispersion relationship is given by ˆω2= fc2+ N2k2h m2 − 2f kh m ∂v ∂z. (4)
-20 -10 0 10 20 Vertical wavelength [km] 0 0.01 0.02 0.03 0.04 0.05 0.06 E n er gy S p ec tr um [J /k g /m ] Andenes 12:00-24:00 UT 24 Jan 2003 3.0 - 9.0 km -20 -10 0 10 20 Vertical wavelength [km] 0 0.01 0.02 0.03 0.04 0.05 0.06 E n er gy S p ec tr um [J /k g /m ] Kiruna 16:00-04:00 UT 24-25 Jan 2003 3.1 - 9.1 km ?- 95 % ?- 99% ?- 99.9% ?- 95 % ?- 99% ?- 99.9%
Fig. 9. Results of rotary spectra (◦, △, ⋄ – significance levels) applied to radar wind perturbations after a band-pass filtering with bandwidths of 8–18 h in time and 2–6 km in height. The spectra are averaged for 12 h starting on 24 January 2003, 12:00 UT at Andenes (a) and on 24 January 2003, 16:00 UT at Kiruna (b).
Fig. 10. Results of hodograph analysis (solid line – measured profiles, dashed line – fitted ellipse, X – starting point of the hodograph) applied to radar measurements at Andenes (a) on 24 January 2003, 15:00 UT and at Kiruna (b) on 24 January 2003, 17:00 UT.
The Doppler relationship is given by Eq. (2). The Coriolis frequency fc depends on the geographical latitude and has
been calculated for both radar locations. The Brunt-V¨ais¨al¨a frequency N (z) can be estimated from radiosonde or lidar temperature soundings. In the absence of temperature in-formation in the case of pure radar investigation, the mean Brunt-V¨ais¨al¨a frequency is selected here with a typical value of 0.013 s−1for the troposphere.
Using the results of the Stokes-parameter analysis applied to the case study presented here (Table 2), the solution of Eqs. (3) and (4) leads to the final gravity parameter given in Table 3, where the Doppler relation (2) is used to solve the sign ambiguity of the horizontal wave number kh. Note, that
due to the high variability of the background winds during the MaCWAVE winter campaign, a direct evaluation of the Doppler relation between observed and intrinsic frequency is unreasonable. Characteristic parameters like the horizon-tal wavelengths, the phase and group velocities as well as the orientation of the horizontal propagation show reason-able agreements for the wave events with observed periods of about 13 h, identified and filtered out at both locations be-fore and behind the Scandinavian mountain ridge.
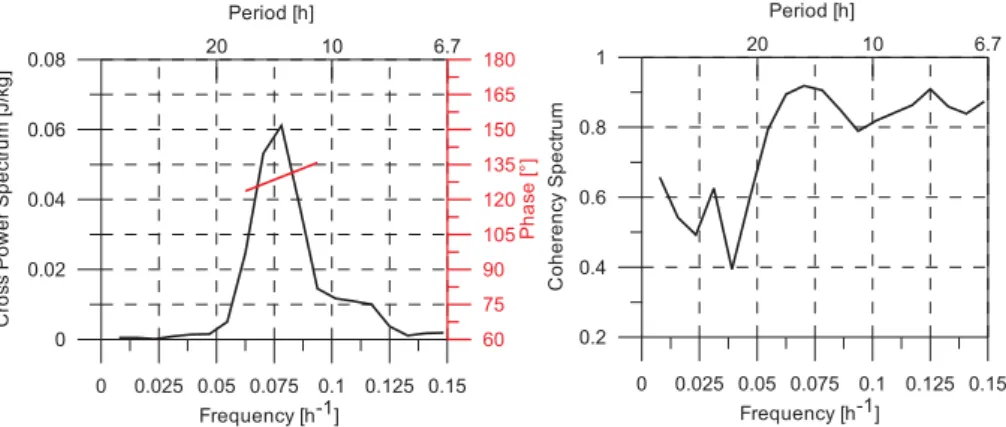
Based on the wavelet transform of the radar measurements at Andenes and Kiruna (Fig. 8a, c) we found a common wave at both locations on 24 January with a period of about 13 h. Note that the high variability of the background winds shows nearly no impact on the obtained wavelet spectra. Further-more, the direction of the wave propagation at Andenes is nearly the same as at Kiruna (Table 2). It gives us a good ability to apply the cross-spectral analysis as detailed de-scribed in Serafimovich et al. (2005). The cross spectrum of the zonal winds measured at Andenes and Kiruna is shown in Fig. 12.
In this case study over Northern Scandinavia we obtained a peak in the cross power spectrum at a period Tobof∼13 h
(Fig. 12a). This peak is significant as shown by the coherency spectrum (Fig. 12b). Thus we conclude, that the presented results for both locations are linked to the same wave.
5 Discussion
In the frame of the MaCWAVE winter campaign in January 2003 we show that collocated VHF radar measurements can
Table 3. Gravity waves parameters derived from the results of the Stokes-parameter analysis as shown in Table 2 for the radar measurements at Andenes and Kiruna.
IGW parameters Andenes Kiruna
Intrinsic period, 2π/ˆω,h 5.6 4.3 Observed period, 2π/ωob,h 12.8 12.8 Vertical wavenumber, m,m−1 1.37×10⁻³ 1.31×10⁻³ Vertical wavelength, 2π/|m|,km 4.6 4.8 Horizontal wavenumber, kh,m−1 −2.72×10⁻⁵ −3.61×10⁻⁵ Horizontal wavelength, 2π/|kh|,km 231 174
Horizontal phase velocity, υph,ms−1 −11.5 −11.2
Vertical phase velocity, υpz,ms−1 0.23 0.31
Horizontal group velocity, cgh,ms−1 −8.8 −9.6
Vertical group velocity, cgz,ms−1 −0.175 −0.265
Wind shear component, ∂v/∂z,s−1 1.7×10⁻³ 1.2×10⁻³
Fig. 11. Hodograph of tropospheric wind fluctuations derived from high-resolution balloon sounding launched near Andenes at
∼22:30 UT on 24 January 2003 at Andenes. The data are averaged
over 300 m. The dashed line shows the fitted ellipse, the red cross marks the starting point.
be used to identify and to investigate inertia gravity waves in the troposphere/lower stratosphere. During the first part of the campaign, we detected an enhanced activity of different gravity waves with observed periods larger than 8 h (Figs. 4 and 5) in connection with an eastward directed jet stream towards the Scandinavian mountains (Fig. 1).
The evaluation of the rotary spectra (Figs. 6 and 9) results in the detection of an inertia gravity wave packet with
down-ward directed energy propagation having a vertical wave-length of ∼5 km. Furthermore, a mountain wave with an upward directed energy propagation was found which shows a vertical wavelength of∼10 km at Andenes, but larger am-plitudes with a shorter vertical wavelength (∼7 km) on the lee side of the Scandinavian mountain ridge at Kiruna. Pos-sible explanations for these observed shorter vertical wave-lengths at Kiruna could be related to differences of the back-ground winds at both locations and to stronger lee waves at Kiruna leading to changed superpositions of all waves. How-ever, such studies remain a topic for future mesoscale model simulations. Additionally, the height-time plot of the verti-cal winds at Andenes (Fig. 7) indicates transient mountain waves as shown by the phase changes during periods with changing horizontal winds (Fig. 3). Such an evolution due to a varying mean flow towards the mountains has been dis-cussed by Vosper and Worthington (2002) in more details. However, the influence of the mountain waves on the inertia gravity waves as well as possible interactions remain a topic of a future study.
Focussing on the inertia gravity waves with shorter ver-tical wavelengths, a wavelet transform has been applied to separate these waves from the mountain waves and to inves-tigate the height and time dependencies of the inertia gravity waves at both radar locations. Figure 8 shows dominant ver-tical wavelengths of about 4–5 km and dominant observed periods of about 13–14 h in the altitude range between 5 and 8 km with higher amplitudes on the lee side of the Scan-dinavian mountain ridge at Kiruna, probably caused by an amplification due to the mountain waves. From the identi-fied downward energy propagation (Figs. 9, 10, and 11) we found that the waves are likely generated by the jet streak in the upper troposphere. This assumption is supported by investigations of Z¨ulicke and Peters (2006) using model sim-ulations of inertia gravity waves mainly generated through
0 0.025 0.05 0.075 0.1 0.125 0.15 Frequency [h-1] 0 0.02 0.04 0.06 0.08 Cr o s s P owe r S pec tr um [J /k g] 20 10 6.7 Period [h] 60 75 90 105 120 135 150 165 180 P has e [° ] 0 0.025 0.05 0.075 0.1 0.125 0.15 Frequency [h-1] 0.2 0.4 0.6 0.8 1 Co he re n c y S pec tr um 20 10 6.7 Period [h]
Fig. 12. Cross-power spectrum between radar measurements at Andenes and Kiruna for the time from 24 January 2003, 00:00 UT to 26 January 2003, 24:00 UT, averaged over the height range from 4 km to 8 km. Left part: Amplitude (black) and phase difference (red). Right part: Coherency spectra.
spontaneous radiation in the exit region of the upper tropo-spheric jet.
The parameter of these inertia gravity waves were esti-mated by the Stokes analysis of the radar measurements at Andenes and Kiruna separately (Table 3), and are in a qual-itatively good agreement, what we expect if the radars de-tect the same wave packet. The results show the appear-ance of coherent dominating inertia gravity waves with ver-tical wavelengths of∼5 km and intrinsic periods in the order of∼5 h. These waves with characteristic horizontal wave-lengths of 200 km are moving in the opposite direction than the mean background wind.
Furthermore, the data during the first part of the winter MaCWAVE campaign have been used in a companion pa-per (Part II, Serafimovich et al., 2006) for estimations of the gravity wave induced vertical fluxes of horizontal momentum and for comparisons between observations and mesoscale MM5 model simulations of inertia gravity waves.
During the second part of the campaign on 28–29 January 2003 nearly no wave activity has been observed in the up-per troposphere at Andenes (Fig. 4) and Kiruna (Fig. 5) as expected by the weaker stream directed more parallel to the Scandinavian mountains.
6 Conclusion
We presented here an experimental study of inertia grav-ity waves in the upper troposphere near the Scandinavian mountain Ridge in the frame of the MaCWAVE winter cam-paign. Using continuous radar measurements with the AL-WIN radar at Andenes and the ESRAD radar near Kiruna, we found, that the strongest gravity wave activity in the tropo-sphere occurred during the first part of the winter MaCWAVE campaign on 24–26 January, whereas during the second part of the campaign on 28–29 January 2003 nearly no wave ac-tivity has been observed.
Gravity wave parameters estimated by the analysis of radar measurements at Andenes and Kiruna separately are in qual-itatively good agreement. During the first period, wavelet transformations reflect similar wave structures in the upper troposphere at both locations. Under the influence of a tran-sient mountain wave, the results show the appearance of co-herent dominating inertia gravity waves moving in the oppo-site direction than the mean background wind. Both meth-ods, the rotary spectra and the hodograph technique, yield to downward energy propagations, so that the identified gravity wave packet is likely generated by the jet streak in the upper troposphere. On the east-side of the Scandinavian mountain ridge the inertia gravity waves show higher amplitudes as an indication of the influence of mountain waves.
In a companion paper (Part II, Serafimovich et al., 2006), gravity wave induced vertical fluxes of horizontal momentum are estimated and comparisons are presented between obser-vations and mesoscale MM5 model results. The model data agree with the experimentally obtained results fairly well and the capabilities of both methods, the VHF radar observa-tions with their high temporal and vertical resoluobserva-tions and the model analyses to get more insight in the atmospheric processes, have been proved.
Further analyses of unsteady mountain waves generated in that region and investigations of their interactions with the identified jet induced inertia gravity waves are necessary. Combined model analysis in connection with observations will contribute to understand such processes.
Acknowledgements. The authors thank their colleagues for the
sup-port to operate the VHF radars, additionally supsup-ported by an “Ac-cess to the ALOMAR research infrastructure” project CT-2003-506208 of the European Community. The data supply from ECMWF via the German Meteorological Service “Deutscher Wet-terdienst” (DWD) is acknowledged.
Topical Editor U.-P. Hoppe thanks P. Chilson and another ref-eree for their help in evaluating this paper.
References
Balsley, B. B. and Carter, D. A.: Mountain waves in the tropical pacific atmosphere – a comparison of vertical wind fluctuations over Pohnpei and Christmas Island using VHF wind profilers, J. Atmos. Sci., 46, 2698–2715, 1989.
Chilson, P. C., Kirkwood, S., and Nilsson, A.: The Esrange MST radar: A brief introduction and procedure for range validation using balloons, Radio Sci., 34, 427–436, 1999.
Cot, C. and Barat, J.: Wave-turbulence interaction in the strato-sphere: A case study, J. Geophys. Res., 91, 2749–2756, 1986. Eckermann, S. and Vincent, R.: Falling sphere observations
grav-ity waves motions in the upper stratosphere over Australia, Pure Appl. Geophys., 130, 509–532, 1989.
Ecklund, W. L., Gage, K. S., and Riddle, A. C.: Gravity wave ac-tivity in vertical winds observed by the Poker Flat MST radar, Geophys. Res. Lett., 8, 285–288, 1981.
Fritts, D. C.: Gravity wave saturation in the middle atmosphere: A review of theory and observations, Rev. Geophys. Space Phys., 22, 275–308, 1984.
Fritts, D. C.: A review of gravity wave saturation processes, effects, and variability in the middle atmosphere, Pure Appl. Geophys., 130, 343–317, 1989.
Fritts, D. C. and Alexander, M. J.: Gravity wave dynamics and effects in the middle atmosphere, Rev. Geophys., 41(1), 1003, doi:10.1029/2001RG000106, 2003.
Gill, A. E.: Atmosphere-Ocean Dynamics, Academic Press, New York, 1982.
Goldberg, R., Fritts, D., Williams, B., L¨ubken, F.-J., Rapp, M., Singer, W., Latteck, R., Hoffmann, P., M¨ullemann, A., Baum-garten, G., Schmidlin, F., She, C.-Y., and Krueger, D.: The MaCWAVE/MIDAS rocket and ground-based measurements of polar summer dynamics: Overview and mean state structure, Geophys. Res. Lett., 31, L24S02, doi:10.1029/2004GL019411, 2004.
Goldberg, R., Fritts, D., Schmidlin, F., Williams, B., Croskey, C., Mitchell, J., Friedrich III, M., J. R., Blum, U., and Fricke, K.: The MaCWAVE program to study gravity wave influences on the polar mesosphere, Ann. Geophys., 24, 1159–1173, 2006, http://www.ann-geophys.net/24/1159/2006/.
Guest, F. M., Reeder, M. J., Marks, C. J., and Karoly, D. J.: Inertia-gravity waves observed in the lower stratosphere over Macquarie Island, J. Atmos. Sci., 57, 737–752, 2000.
Hines, C. O.: Internal atmospheric gravity waves at ionospheric heights, Can. J. Phys., 38, 1441–1481, 1960.
Hines, C. O.: Tropopausal mountain waves over Arecibo: A case study, J. Atmos. Sci., 46, 476–488, 1989.
Latteck, R., Singer, W., and Bardey, H.: The Alwin MST radar -technical design and performance, in: Proceedings of the 14th ESA Symposium on European Rocket and Balloon Programmes and Related Research, Potsdam, Germany (ESA SP-437), edited by: Kaldeich-Sch¨urmann, B., pp. 179–184, ESA Publications Division, 1999.
Peters, D., Hoffmann, P., and Alpers, M.: On the appearance of inertia gravity waves on the north-easterly side of an anticyclone, Meteor. Z., 12, 25–35, 2003.
Queney, P.: The problem of air flow over mountains: A summary of theoretical studies, Bull. Amer. Meteor. Soc., 29, 16–26, 1948. Sch¨och, A., Baumgarten, G., Fritts, D. C., Hoffmann, P.,
Serafi-movich, A., Wang, L., Dalin, P., M¨ullemann, A., and Schmidlin, F. J.: Gravity waves in the troposphere and stratosphere during the MaC/MIDAS summer rocket program, Geophys. Res. Lett., 31, L24S04, doi:10.1029/2004GL019837, 2004.
Serafimovich, A., Hoffmann, P., Peters, D., and Lehmann, V.: In-vestigation of inertia-gravity waves in the upper troposphere / lower stratosphere over Northern Germany observed with collo-cated VHF/UHF radars, Atmos. Chem. Phys., 5, 295–310, 2005, http://www.atmos-chem-phys.net/5/295/2005/.
Serafimovich, A., Z¨ulicke, C., Hoffmann, P., Peters, D., Dalin, P., and Singer, W.: Inertia Gravity waves in the upper troposphere during the MaCWAVE winter campaign, Part II: Radar investi-gations and modelling studies, Ann. Geophys., 24, 2863–2875, 2006,
http://www.ann-geophys.net/24/2863/2006/.
Smith, R. B.: The influence of mountains on the atmosphere, Adv. Geophys., 21, 87–230, 1979.
Thompson, R. O. R. Y.: Observation of inertial waves in the strato-sphere, Quart. J. Roy. Meteorol. Soc., 104, 691–698, 1978. Torrence, C. and Compo, G. P.: A practical guide to wavelet
analy-sis, Bull. Amer. Meteor. Soc., 79, 61–78, 1998.
Vincent, R. A. and Fritts, D. C.: A climatology of gravity wave mo-tions in the mesopause region at Adelaide, Australia, J. Atmos. Sci., 44, 748–760, 1987.
Vosper, S. B. and Worthington, R. M.: VHF radar measurements and model simulations of mountain waves over Wales, Quart. J. Roy. Meteorol. Soc., 128, 185–204, 2002.
Zink, F. and Vincent, R.: Wavelet analysis of stratospheric grav-ity wave packets over Macquarie Island, J. Geophys. Res., 106, 10 275–10 288, 2001.
Z¨ulicke, C. and Peters, D.: Inertia-gravity waves driven by a pole-ward breaking Rossby wave, J. Atmos. Sci., in press, 2006.