HAL Id: hal-02877560
https://hal.archives-ouvertes.fr/hal-02877560
Submitted on 2 Oct 2020
HAL is a multi-disciplinary open access
archive for the deposit and dissemination of
sci-entific research documents, whether they are
pub-lished or not. The documents may come from
teaching and research institutions in France or
abroad, or from public or private research centers.
L’archive ouverte pluridisciplinaire HAL, est
destinée au dépôt et à la diffusion de documents
scientifiques de niveau recherche, publiés ou non,
émanant des établissements d’enseignement et de
recherche français ou étrangers, des laboratoires
publics ou privés.
Achieving visible light-driven hydrogen evolution at
positive bias with a hybrid copper-iron
oxide|TiO2-cobaloxime photocathode
C. Tapia, E. Bellet-Amalric, D. Aldakov, F. Boudoire, K. Sivula, Laurent
Cagnon, V. Artero
To cite this version:
C. Tapia, E. Bellet-Amalric, D. Aldakov, F. Boudoire, K. Sivula, et al.. Achieving visible light-driven
hydrogen evolution at positive bias with a hybrid copper-iron oxide|TiO2-cobaloxime photocathode.
Green Chemistry, Royal Society of Chemistry, 2020, 22 (10), pp.3141-3149. �10.1039/d0gc00979b�.
�hal-02877560�
Green Chemistry
PAPER
Cite this: DOI: 10.1039/d0gc00979b
Received 19th March 2020, Accepted 21st April 2020 DOI: 10.1039/d0gc00979b rsc.li/greenchem
Achieving visible light-driven hydrogen evolution
at positive bias with a hybrid copper
–iron oxide|
TiO
2
-cobaloxime photocathode
†
C. Tapia
Q2
,
aE. Bellet-Amalric,
bD. Aldakov,
cF. Boudoire,
dK. Sivula,
dL. Cagnon
eand V. Artero
*
aH2is an environmentally-friendly fuel that would allow for a circular economy but its sustainable pro-duction, e.g. from solar energy and water, remains a challenge. A hybrid CuFexOy|TiO2-CoHEC (CoHEC = chloro([4,4’-bipyridine]-2,6-dicarboxylic acid)bis(dimethylglyoximato)cobalt(III)) photocathode for hydro-gen evolution reaction (HER), with faradaic efficiencies of 54–88%, is described, the preparation of which uses only non-toxic and Earth-abundant elements, avoids etching treatments and limits the use of organic solvents. The semi-conducting CuFexOylight absorber is obtained by sol–gel synthesis followed by calcination at moderate temperature. Grafting the CoHEC cobaloxime catalyst at its surface results in H2evolution with an onset photocurrent potential of +860 mV; this process being stabilized by the pres-ence of a thin layer of amorphous TiO2deposited onto CuFexOy.
Introduction
Hydrogen production via the water splitting reaction is a prom-ising solution to store massive amounts of renewable energy and allow the essential ecological transition.1However, direct sunlight-driven, i.e. photoelectrochemical, H2 evolution must overcome significant challenges in terms of performance, stability and scalability in order to be considered as a credible alternative to current technologies,2 which rely on photovol-taics coupled to water electrolyser. Water-splitting photoelec-trochemical cells (water-splitting PECs) hold promise to exceed current technology since they are based on photoelectrode(s) that combine solar energy absorption, energy conversion and catalysis for hydrogen evolution or water oxidation.3,4 The choice of the photoelectrode material(s) determines the efficiency of the PEC. Light absorption is generally achieved by a semiconductor material that should combine (i) suitable bandgap energy and band positions to allow catalysis to proceed, (ii) efficient charge carrier separation and
transpor-tation and (iii) good stability in contact with aqueous electro-lytes. Here, we focus on the design of an efficient photo-cathode for hydrogen evolution, for which fewer solutions exist. Indeed, the large majority of studies have focused on Cu2O5–8and p-doped Si9,10as photocathode candidates due to their narrow band-gaps, adequate band positions, and Earth abundancy. However, the flat-band potential of p-Si combined with the low photovoltage associated to its low band-gap directly affects the onset photocurrent potential, which is not positive enough for standalone photoelectrochemical water-splitting. In addition, both p-Si and Cu2O suffer from the lack of photostability and require ultra-efficient protective coating to avoid oxidation and photo reduction, respectively. Other solutions exploit critical elements such as indium and gallium.11,12Silicon and III–V semiconductors exhibit limited stability in aqueous solutions and must be thoroughly passi-vated after HF etching of native oxide layer.9,10,13–15 Metal oxides hold promises in that prospect.5,16 Unfortunately, copper oxides suffer from photocorrosion if they are not efficiently protected. To overcome this limitation, the interest has shifted to ABOxternary metal oxides, in which the inser-tion of a B cainser-tion (such Fe, V, Bi, Cr) can perturb the electronic band structure enough to stabilize copper oxides against photocorrosion.17In particular CuFeO2delafossite, exclusively based on Earth-abundant elements, has a 1.5–1.6 eV bandgap suitable for absorption of visible light and a conduction band positioned negative enough to allow for hydrogen evolution.18–21 Only few studies were reported so far toward the use of this material in a photocathode for H2 evolution, †Electronic supplementary information (ESI) available. See DOI: 10.1039/
d0gc00979b
aUniv. Grenoble Alpes, CNRS, CEA IRIG, Laboratoire de Chimie et Biologie des
Métaux, F-38000 Grenoble, France. E-mail: [email protected]
bUniv. Grenoble Alpes, CNRS, CEA IRIG, PHELIQS, F-38000 Grenoble, France cUniv. Grenoble Alpes, CNRS, CEA IRIG-SyMMES, F-38000 Grenoble, France dLaboratory for Molecular Engineering of Optoelectronic Nanomaterials,
École Polytechnique Fédérale de Lausanne (EPFL), Station 6, 1015 Lausanne, Switzerland
eUniv. Grenoble Alpes– CNRS UPR 2940, Institut NEEL, F-38000 Grenoble, France
1 5 10 15 20 25 30 35 40 45 50 55 1 5 10 15 20 25 30 35 40 45 50 55
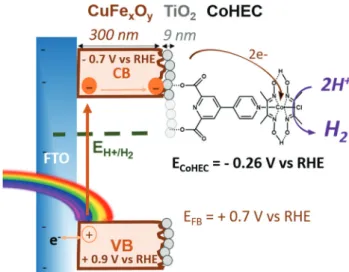
and combining this photoactive material with a surface cata-lyst to enhance its photochemical properties has not been explored so far. Recently, we and others have demonstrated that cobalt diimine-dioxime22–25 or cobaloximes,25–29 with proper anchoring groups can be used as molecular electrocata-lysts for H2 evolution in metal oxide-based photocathodes. Therefore, we decided to exploit the CoHEC cobaloxime cata-lyst (Fig. 1) to decorate photoactive copper–iron oxide materials towards the elaboration of a H2-evolving photo-cathode and found that good performance could be reached with the deposition of a thin layer of amorphous TiO2as a pro-tective coating.23,26Fig. 1 displays the structure and electronics of such a hybrid architecture. The protection of the Cu–Fe oxide layer with a thin layer of amorphous TiO2 allows to photoproduce H2 with faradaic efficiencies of 54–88% and with onset potential as high as 0.4 V vs. RHE in neutral aqueous electrolyte under pure visible light irradiation. Such a hybrid approach30 thus proves a competitive and greener alternative to dye-sensitized photoelectrodes25,31,32 with the advantage of avoiding the dye preparation and sensitizing steps.
Experimental section
Materials
Fluorine-doped tin oxide (FTO) coated glass substrates were purchased from Solems (Palaiseau, France). Acetone, absolute ethanol, copper nitrate trihydrate, iron nitrate nonahydrate, ethylene glycol, methanol, poly(ethylene glycol)-block-poly( pro-pylene glycol)-block-poly(ethylene glycol) (F-108) and potass-ium phosphate were purchased from Sigma-Aldrich. Chloro ([4,4′-bipyridine]-2,6-dicarboxylic acid)bis(dimethylglyoximato) cobalt(III) (CoHEC) was purchased from Dyenamo (Sweden).
Titanium(IV) isopropoxide (TTIP) was purchased from Strem
Chemicals Inc. All the reagents were used as received without further purification.
Photocathode preparation
Cu–Fe oxide (CuFexOy) deposition on FTO glass substrates. The procedure was adapted from previously reported studies.18,33Glass|FTO substrates (20 × 40 mm2) were cleaned first with soap and water, then with ethanol and finally with acetone, each step during 15 minutes in an ultrasonic bath. Then, they were treated in an UV-ozone cleaner during 15 minutes. A mixture of 0.2 M Cu(NO3)2·3H2O, 0.2 M Fe (NO3)3·9H2O and 0.45 M ethylene glycol in ethanol was spin coated on glass|FTO substrates at 3300 rpm during 1 minute followed for 600 rpm during 30 seconds, following a protocol previously reported.21The substrates were placed in a flat tita-nium furnace and heated up to 200 °C in the air during 30 minutes to stabilize the film. The spin coating and the heating processes were repeated 5 times for each glass|FTO substrate. A last annealing step at 450 °C for 30 minutes and then at 600 °C for 2 hours in a tubular furnace under argon flow was performed to eliminate all organic residues, reduce Cu(II) to Cu(I) and crystalize the Cu–Fe oxide films
(CuFexOyFLAT).18,33In some cases, the sixth layer was structured in order to increase the surface area of the CuFexOyelectrode. Here, F-108 polymer (120 mg mL−1) was added to the solution used for fabricate the sixth layer.25We will refer to these layers as CuFexOySTRUCT.
Deposition of amorphous TiO2 by atomic layer deposition (ALD). TiO2 was deposited on CuFexOyFLATelectrodes by ALD (Savannah 100 ALD system, Cambridge Nano Tech Inc.) with precursor temperature at 95 °C, pump line temperature at 150 °C and sample chamber temperature at 255 °C in continu-ous mode under 5 sccm nitrogen flow. TTIP was used as Ti source and water as O source. 355 cycles were applied, each cycle being composed of 1 s pulse of TTIP, 5 s pause, 0.015 s pulse of water and 5 s pause. The resulting electrodes are referred to as CuFexOy|TiO2.
CoHEC grafting on CuFexOySTRUCT and CuFexOy|TiO2. CuFexOySTRUCTand CuFexOy|TiO2electrodes were immersed in 0.7 mM CoHEC methanol solution overnight, then rinsed with methanol and dried in air before use.
Characterization techniques
UV-visible absorption spectra of CuFexOy and CuFexOy|TiO2 (before and after CoHEC grafting) were recorded with an Agilent Technologies Cary 60 UV-Vis spectrometer. The base-line corresponding to the glass|FTO support was recorded and automatically subtracted from the spectrum of the electrode.
Scanning electron microscopy (SEM) images showing the electrode morphology were recorded with a scanning electron microscope Zeiss Ultra 55 operating at 4 kV.
XRD measurement where performed on a Smartlab Rigaku diffractometer in glancing incidence: the incident beam was fixed at low angle (1 degree) to maximize the signal of the thin layer. The measurements correspond to a 2θ scan.
Fig. 1 Scheme of electron pathway on CuFexOy|TiO2-CoHEC photo-cathode and energy potentials.
1 5 10 15 20 25 30 35 40 45 50 55 1 5 10 15 20 25 30 35 40 45 50 55
Film-thickness measurements were performed with a laser scanning microscope VK-X120 (Keyence), using VK Viewer and VK Analyser softwares.
An ellipsometer (M 2000 model) from J. A. Woollam Co., In. was used to measure the thickness of the ALD-TiO2substrate, using the CompleteEASE software (V4.72). It was used in the “off-sample” configuration with an incident angle of attack of 75° with respect to the film plane normal, and the light wave-length was scanned between 200 nm and 1700 nm. The obtained data were fitted with the CompleteEASE software (V4.72).
X-ray photoelectron spectroscopy (XPS) analyses were carried out with a Versa Probe II spectrometer (ULVAC-PHI) equipped with a monochromated Al Kα source (hν = 1486.6 eV). The core level peaks were recorded with constant pass energy of 23.3 eV. The XPS spectra were fitted with CasaXPS 2.3 software using Shirley background. Binding energies are referenced with respect to the adventitious carbon (C 1s BE = 284.6 eV).
Inductively coupled plasma atomic emission spectroscopy (ICP-AES) was performed using a Shimadzu ICPE-9000 instru-ment with a mini plasma torch in axial reading mode. The sample preparation involves the digestion overnight of the samples CuFexOy, CuFexOy-CoHEC, CuFexOy|TiO2-CoHEC and CuFexOy-CoHEC before and after chronoamperometry treat-ment in 1 mL of HNO3(64%).
Photoelectrochemical and hydrogen production measurements
Electrochemical data were acquired with a Biologic VSP 300 (Linear scan voltammetry), an IVIUM compact potentiostat (chronoamperometry) and Autolab potentiostast with FRA module (electrochemical impedance spectroscopy – EIS). All measurements were carried out in a three electrode ( photo) electrochemical cell, filled with pH 6.7 0.2 M phosphate buffer as electrolyte. A titanium wire was used as counter electrode (CE) and a Ag/AgCl (3 M KCl) electrode as reference electrode (RE). Potentials are referred to RHE by using the equation (E = 0.200 V + 0.059 × pH). Calibration of the reference electrode was realized with [K4Fe(CN)6] in 0.1 M potassium phosphate buffer at pH 7.34Argon or nitrogen was bubbled to the lyte for 20 minutes to remove the oxygen before any electro-chemical measurement. The geometrical active surface area was 0.5 cm2. The electrical contact in the working electrode was from the FTO part. EIS measurements were conducted in 0.2 M phosphate pH 6.7 at 10 kHz and 0.4–0.7 V vs. RHE potential range.
For photoelectrochemical measurements, a 280 W Xe lamp was used to irradiate the electrodes with 1 sun filtered so that only the visible part of the spectrum reaches the photoelec-trode (400–780 nm, 65 mW cm−2). UV irradiation was filtered with a Spectra-Physics 59472 (λ < 400 nm) cut off filter and IR irradiation was filtered by a Spectra-Physics 6123NS circulating water filter kept at 25 °C. Chronoamperometric measurements were performed in a previously described cell with 4 mL elec-trolyte volume and 2.5 cm2geometrical active surface area.35
The working electrode was connected with conductive silver paste to a wire, and the cell was completely isolated from air. Hydrogen production was determined by a hydrogen probe from Unisense, polarized at 1 V vs. Ag/AgCl, and calibrated fol-lowing the procedure described in our previous publication.35 It was placed inside the photo-electrochemical cell before and after the chronoamperometry to measure the amount of hydro-gen in solution.35
Results and discussion
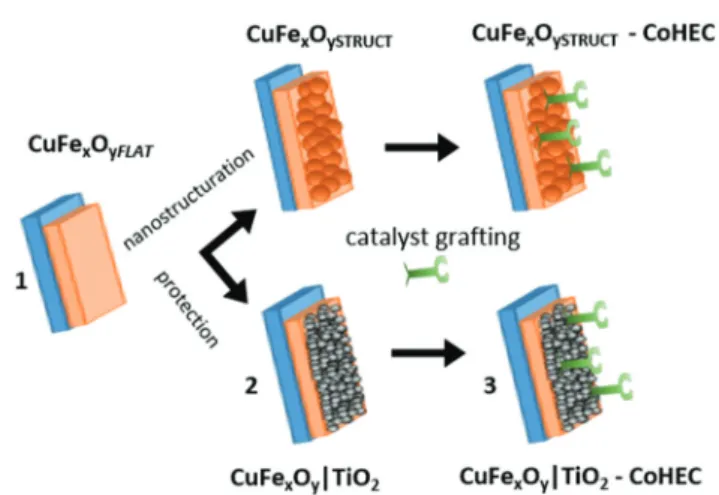
Different photocathodes for the hydrogen evolution reaction (HER) were prepared following the three-step strategy displayed in Fig. 2. First, the copper–iron oxide (CuFexOy) thin layers were prepared by sol–gel method from a mixture of copper and iron salts and spin-coated on glass|FTO substrates, following previous reports18,33as described in the Experimental section. Then, amorphous TiO2 was deposited on CuFexOy layers by ALD. Afterwards, the CoHEC cobaloxime catalyst was grafted on the top of CuFexOy|TiO2samples by overnight soaking into methanolic solution. On another batch of samples, CuFexOy layer was nanostructured (CuFexOySTRUCT) using the F108 tri-block co-polymer template and the catalyst is grafted at the surface of CuFexOySTRUCTwithout amorphous TiO2deposition.
Characterization of the Cu–Fe oxide (CuFexOy) layers
Brown colored CuFexOyFLATsix-layered samples were obtained after several spin-coating deposition and annealing cycles as described in the Experimental section. Observation by SEM revealed a single thin film of 221 ± 30 nm thickness (Fig. 3A) without nanostructuration (Fig. 3Ac). The low active surface area of the electrode could result in poor catalyst loading in further steps.
Fig. 2 Three-step preparation of the CuFexOySTRUCT-CoHEC and CuFexOy|TiO2-CoHEC photocathodes: (1) synthesis of multi-layered CuFexOylight-harvesting semiconductor samples; (2) protection of the semiconductor with TiO2or CuFexOynanostructuration, and (3) grafting of the CoHEC molecular catalyst.
Green Chemistry Paper
1 5 10 15 20 25 30 35 40 45 50 55 1 5 10 15 20 25 30 35 40 45 50 55
The addition of a triblock polymer known as F-108 in the sol–gel used for the sixth and last cycle resulted in higher nanostructuration (CuFexOySTRUCT, Fig. 2 and 3Ad). This top layer with a thickness of 137 ± 9 nm (Fig. S1†) displayed a grain size around 100–200 nm in diameter (Fig. 3Ad). The total thickness of CuFexOySTRUCTwas estimated to 320 ± 40 nm.
The Cu : Fe atomic ratio measured by EDX on CuFexOyFLAT thin film was 1 : 1.3 (Fig. S2†), indicating a copper-deficient delafossite CuFeO2 structure. XRD revealed that CuFexOyFLAT electrodes contain a rhombohedral delafossite CuFeO2(JCPDS 04-015-2087) phase together with cubic spinel CuFe2O4(JCPDS 01-074-8585) and Fe2O3 (JCPDS 04-003-2900) parasitic phase (Fig. 3B). These results were confirmed by Raman spectroscopy performed in CuFexOyFLAT and CuFexOySTRUCT (Fig. S3†). CuFe2O4 is first formed from CuO and Fe2O3, which are formed from the same sol–gel precursor solution before reach-ing 180 °C and around 300 °C, respectively.33,36 Afterwards, the spinel CuFe2O4 phase can be converted with CuO during the last annealing step and form CuFeO2delafossite with no need of additional reductant agent.37The presence of CuFe2O4 in our films suggests this last step is not fully achieved. The
XRD spectrum of CuFexOySTRUCT samples revealed a higher ratio between CuFe2O4 and CuFeO2 phases. Nevertheless, CuFe2O4has been also reported as a good candidate for HER under visible light, with a similar bandgap and band position as CuFeO2delafossite.38,39
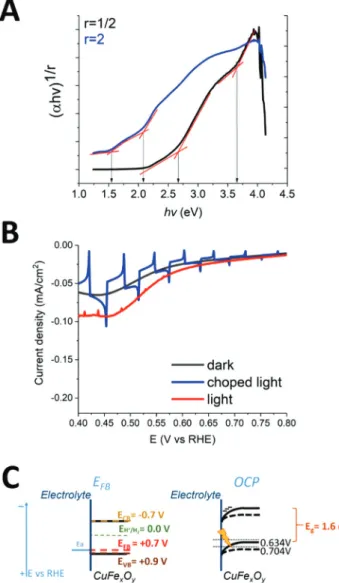
Bandgap energy values (Eg) for direct and indirect allowed transitions were determined by UV-visible absorbance spec-trum. Tauc plots were measured based on the UV-visible absor-bance data of CuFexOyFLAT corrected for FTO absorption and taking into account the thickness of the layers. As shown in Fig. 4A, CuFexOyFLAT thin film exhibited an indirect bandgap
Fig. 3 (A) SEM sectional images from (a) clean FTO and (b) CuFexOyFLAT layer synthetized on FTO (same scale). SEM front images from (c) CuFexOyFLAT, (d) CuFexOySTRUCTand (e) CuFexOy|TiO2(same scale). (B) XRD pattern of CuFexOyFLATin blue, CuFexOySTRUCTin red and FTO in dark blue. All peaks are referenced to delafossite CuFeO2(JCPDS 04-015-2087) (brown); spinel CuFe2O4 (JCPDS 01-074-8585) (black) and Fe2O3(JCPDS 04-003-2900) (orange).
Fig. 4 (A) Tauc plots from CuFexOyFLATUV-visible spectrum for direct (r =1
2) and indirect (r = 2) bandgap calculation. (B) Linear sweep voltammo-gram (LSV) of CuFexOySTRUCTfilms under chopped light irradiation (blue), constant irradiation (red) and in the dark (black) in 0.2 M phosphate buffer pH 6.7 at 10 mV s−1scan rate, under argon; irradiation with 1 sun visible light (400–780 nm). (C) Scheme of the energy bands of CuFexOyFLATfilms, where EFB, EVBand ECB are the flat-band, valence band and conduction band potentials, respectively, whileEH+/H2is the redox potential corresponding to the proton reduction: left, the elec-trode is poised at theflat-band potential; right: the electrode is in equili-brium with the solution at the open circuit potential (OCP).
1 5 10 15 20 25 30 35 40 45 50 55 1 5 10 15 20 25 30 35 40 45 50 55
of 1.6 eV and two direct bandgaps of 2.65 eV and 3.6 eV, in accordance to the literature for delafossite CuFeO220,21,33and spinel ferrite CuFe2O439 confirming that this material is capable of absorbing visible light. However, an indirect bandgap at 2.0 eV was also observed, confirming the presence of Fe2O3parasitic phase (which bandgap is 2.0–2.2 eV) already observed by XRD.40
High resolution XPS analysis of CuFexOystructrevealed Cu(I)
and Cu(II) oxidation states which suggests a mixture of
delafos-site CuFeO2 and ferrite CuFe2O4 phases, shown in Fig. S4.† The presence of Cu(II) is easily identified by intense peaks
around 933 eV together with satellite shake-up signals above 940 eV, while Cu(I) is evidenced by a single peak at 932 eV.
The flat band potential (EFB) was determined through Mott–Schottky plot by performing EIS measurements. The p-type nature of the CuFexOylayers on FTO was confirmed by the negative slope of the Mott–Schottky plot. EFBwas estimated at 0.72 V vs. RHE in 0.2 M phosphate buffer (pH 6.7) and 10 kHz (Fig. S5†).41This value is more negative than the already reported value of 1 V vs. RHE for delafossite CuFeO218which again suggested the presence of impurities. The flat-band potential also corresponds to the potential at which the semi-conductor starts to show photocurrents (onset potential)3and a similar value of EFB0.70–0.75 V vs. RHE is determined from LSV measurements on CuFexOySTRUCTback illuminated with 1 sun visible light (65 mW cm−2, 400–780 nm) in the same elec-trolyte (Fig. 4B). This elecelec-trolyte was selected based on pre-vious studies on Cu-based oxides conducted in neutral pH.42,43 The open circuit potential (OCP) of the CuFexOy layers when illuminating the sample was 0.70 V vs. RHE, and a shift in the photopotential towards less positive potential was recorded in dark (0.63 V vs. RHE), shown in Fig. S6.† When illuminating, the bands tended to flatten and the OCP became more posi-tive.3 This behaviour also confirms the p-type nature of the semiconductor and its flat band potential measured by EIS. We acknowledge that OCP should be monitored for increasing light intensities until saturation is reached. Indeed if the light intensity is not high enough to flatten the bands, the flat band potential value may be underestimated.44 We note however that the OCP value measured under 1 sun illumination matches both onset photocurrent potential and EFB value determined using Mott–Schottky analysis.
When potentials more negative than the onset potential are applied to the CuFexOySTRUCTelectrodes, the energy bands at the surface of the semiconductor in contact with the electro-lyte bend towards more negative potential allowing electrons to travel to the electrolyte. According to the reported data,18 the diffusion length of the charge carriers of CuFeO2 delafos-site is≈300 nm. Therefore, the thickness of the CuFexOylayers was convenient to allow both the electrons from the hole–elec-tron pair created near the interface with the FTO and the holes created at the surface with the electrolyte to reach the electro-lyte and the FTO back contact, respectively, before they recom-bine. Indeed, LSV measured for CuFexOySTRUCTelectrodes dis-played cathodic photocurrents (Fig. 4B) under visible light irradiation. At 0.4 V vs. RHE photocurrent density reached
85 µA cm−2 (Fig. 4B) which is close to the performances reported for similar delafossite CuFeO2 samples in the absence of other electron acceptor apart from protons.45
The energy bands position of the CuFexOy layers and its behaviour in equilibrium with the electrolyte are represented in Fig. 4C. Assuming that the valence band is located 0.1–0.2 V below the flatband potential (EFB= +0.7 V vs. RHE),46we deter-mined EVB = +0.8 to +0.9 V vs. RHE. Considering the indirect band gap (Eg) of 1.6 eV, the conduction band is therefore placed at−0.7 to −0.8 V vs. RHE (ECB= EVB− Eg). Therefore, the conduction band is negative enough for protons reduction, as illustrated in the scheme in Fig. 4C.
Catalyst grafting and photoelectrochemical performance for HER
The CoHEC catalyst is a cobaloxime bearing an axial 4,4 ′-pyri-dine ligand functionalized with two carboxylic acid anchoring groups. Following its use in dye-sensitized photoelectrodes,25,28it was selected as a candidate to enhance the efficiency of the photoelectrocatalytic proton reduction at the surface of the CuFexOyelectrodes. The grafting of CoHEC on CuFexOySTRUCT electrode was achieved by soaking CuFexOySTRUCT electrodes in a methanolic CoHEC (0.7 mM) solution overnight. The presence of CoHEC grafted on CuFexOy was evidenced by the increase in the absorbance around 450–350 nm in the UV-visible absorption spectrum (Fig. S7†), as previously reported.47The presence of cobalt in the CuFexOySTRUCT-CoHEC samples was confirmed by ICP with Co emission observed at 228.616 eV (Fig. S8†). The ICP signal is within the detection limit of this technique, indicating a surface concentration of 0.085 nmol cm−2. XPS analysis of CuFexOySTRUCT-CoHEC showed characteristic peaks of Co(II)
2p3/2with a multiplet splitting due to the coupling with the unpaired electrons and plasmon losses (779.9, 782.3, and 787.7 eV) likely corresponding to a single Co complex,48and two nitrogen atoms (N 1s at 399.0 eV for pyridinic N and 401.1 eV for oxime N), confirming the presence of the cobalt center of the CoHEC as well as nitrogen present in CoHEC ligands (Fig. S9†). Co : N ratio obtained from the XPS studies is 6.3, which is very close to 6 expected from the stoichiometry of the complex.
Catalytic onset potential for hydrogen evolution mediated by CoHEC at a bare FTO electrode in the dark was measured at −0.26 V vs. RHE in 0.2 M phosphate buffer (pH 6.7) (Fig. 5 and S10†), in accordance to the values reported in neutral pH.25 Sensitization with CuFexOySTRUCTshifts this onset potential to +0.7 V vs. RHE, in accordance to the EFBvalue previously deter-mined for CuFexOyfilms. In other words, the CuFexOySTRUCT material provides a photovoltage of ∼960 mV to the H2 evol-ution reaction, which is definitely much higher than that pro-vided by p-Si or Cu2O. Indeed, the onset potentials reported for p-Si,23,49Cu2O6or WSe250photocathodes are 0.4–0.6 V vs. RHE. As shown in Fig. 5 and Fig. S11,† photocurrents measured at CuFexOySTRUCT-CoHEC are twice higher than those measured at unfunctionalized CuFexOySTRUCT photo-cathodes in the absence of CoHEC, showing the benefit of
Green Chemistry Paper
1 5 10 15 20 25 30 35 40 45 50 55 1 5 10 15 20 25 30 35 40 45 50 55
surface functionalization to enhance charge extraction and catalysis.
Such an improvement was confirmed during chronoam-perometric measurements performed at 0.4 V vs. RHE under irradiation (Fig. 6A). The photocurrent for CuFexOySTRUCT photocathode reached just −14 µA cm−2. However, when CoHEC was grafted on the surface of CuFexOySTRUCT, photocur-rents were up to 4 times higher, varying from−60 to −20 µA cm−2during the first minute and remaining higher than those measured at CuFexOySTRUCT photocathode during the first 8 min.
The amount of hydrogen produced in solution was measured with an hydrogen probe, calibrated following the procedure described in previous publication.35The calculated faradaic yields (FY) for both CuFexOySTRUCT and CuFexOySTRUCT-CoHEC after 20 min were 2% and 6%,
respecti-vetely (Table 1). Based on the estimated Co surface concen-tration, the turnover number (TON) was 57 ± 30 for CuFexOy -CoHEC, corresponding to an average turnover frequency (TOF) of 0.05 s−1. However, longer chronoamperometries did not result in higher amount of hydrogen produced. These results clearly show that the efficiency of catalytic hydrogen pro-duction is enhanced with CoHEC grafted on the surface of CuFexOy. However, desorption of the catalyst occurred within minutes of operation as shown in Fig. 6A. The photocurrent decreased along time in the case of CuFexOy-CoHEC, reaching the values similar to CuFexOySTRUCTafter 8 minutes, and even lower photocurrents afterwards, indicating some degradation of the photocathode materials. Partial loss of cobalt from the surface is confirmed by ICP (Fig. S8†) and XPS (Fig. S9†) measurements after 20 min chronoamperometric measure-ment. For example, the Co : Cu surface atomic ratio drops from initial 3.7 to 0.14. It is also consistent with a former obser-vation made for similar cobaloxime catalysts immobilized onto surfaces through axial pyridine ligand27,51 for cathodes operated in the dark and for CoHEC grafted onto dye-sensi-tized NiO.25The CoHEC grafting did not affect apparently the CuFexOystructcomposition, since the observed Cu 2p and Fe 2p XPS peaks are similar for both samples (Fig. S4†). However, after applying bias potential to the sample in presence of grafted CoHEC, the Cu visible by XPS was almost completely
Fig. 5 LSV for bare FTO substrate (dashed line in black), bare FTO sub-strate with 0.7 mM CoHEC in solution (straight red line), CuFexOySTRUCT modified FTO substrate (straight blue line) and CuFexOySTRUCTdecorated with CoHEC (straight brown line). Irradiation of 1 sun visible light (400–780 nm) in 0.2 M phosphate buffer (pH 6.7) at 10 mV s−1scan rate under nitrogen.
Fig. 6 (A) Chronoamperometries at +0.4 Vvs. RHE on CuFexOySTRUCT(black) and CuFexOySTRUCT-CoHEC (red) photoelectrodes, irradiated by 1 sun visible light (400–780 nm) under nitrogen. (B) Chronoamperometries at 0.4 V vs. RHE on CuFexOy|TiO2-CoHEC under dark (brown) and light (green) conditions. Measurements in 0.2 M phosphate buffer (pH 6.7).
Table 1 Hydrogen production, FY, TON and TOF values for CuFexOySTRUCT, CuFexOySTRUCT-CoHEC, CuFexOy|TiO2 and CuFexOy| TiO2-CoHEC photocathodes. 0.2 M phosphate buffer (pH 6.7), 1 sun irradiation (65 mW cm−2, 400–700 nm), at 0.4 V vs. RHE applied bias for 20 min Electrode Q (mC cm−2) H2 (nmol cm−2) FY (%) TONCo Average TOF (s−1) CuFexOySTRUCT 70 ± 30 4.8 ± 2 2
CuFexOySTRUCT-CoHEC 16 ± 7 4.8 ± 2 6 57 ± 30 0.05 CuFexOy|TiO2 4 ± 1 4.3 ± 1 22
CuFexOy|TiO2-CoHEC 3 ± 1 7.6 ± 2 54 90 ± 30 0.08
1 5 10 15 20 25 30 35 40 45 50 55 1 5 10 15 20 25 30 35 40 45 50 55
reduced to Cu(I), which can explain the limited faradaic
efficiency for H2 evolution. This reduction phenomenon does not occur in the absence of CoHEC grafting but we observed a significant modification of the CuFexOy material upon turn-over. Indeed, the Cu : Fe atomic ratio measured by EDX changed from 1 : 1.3 before electrochemical treatment to 1 : 5 after treatment, indicating a significant loss of copper during operation (Fig. S12†). The degradation of the surface of the CuFexOySTRUCT electrode was confirmed by SEM (Fig. S13†). XRD performed on CuFexOySTRUCT electrodes after treatment revealed new unknown peaks which correspond neither to CuFe2O4, CuFeO2, Cu2O nor to Fe2O3(Fig. S14†).To overcome such a degradation, we decided to protect the CuFexOy material by depositing a thin TiO2layer on top.
Optimisation through atomic layer deposition of TiO2
The instability of semiconductors under photoelectrochemical conditions is a general problem that can be solved by depo-sition of metal oxides protecting23,52,53or passivating layers.54 A classical protection strategy is the deposition of a few nm of thin amorphous TiO2 layer by atomic layer deposition (ALD),23,26,49,55,56 allowing to control the thickness and improve the homogeneity of the surface layer.
We therefore deposited an amorphous TiO2 layer, with a 8.3 nm thickness measured by ellipsometry (Fig. S15†), onto a flat CuFexOy film by ALD following the procedure reported elsewhere.23 Fig. 3Ae shows the top view of amorphous TiO2 deposited on CuFexOyFLATelectrode, revealing nanostructured TiO2. It has been previously shown that a ∼10 nm layer of amorphous TiO2 is thick enough to passivate a semi-conductor.56 Since the resistance increases and the photo-electrochemical response drops with the thickness of the TiO2 layer,56 we limited the ALD process on CuFexOyFLAT to 355 cycles, corresponding to a thickness of 8.3 nm measured by ellipsometry.
XRD was performed on CuFexOy|TiO2electrodes. The main phase was CuFe2O4(Fig. S16†), indicating a structural change of the bulk materials during ALD deposition. No peaks corres-ponding to any crystalline phase of TiO2were observed in the CuFexOy|TiO2 electrodes diffractogram (Fig. S16†) confirming the amorphous character of the TiO2layer, while the presence of Ti was confirmed by EDX (Fig. S17†) and XPS (Fig. S9B†). LSV under choped light of CuFexOy|TiO2-CoHEC is shown in Fig. S18,† revealing lower photocurrent values and a shift of the onset photocurrent potential to∼0.6 V vs. RHE. This catho-dic shift can be explained by the full oxidation of the CuFexOy material into CuFe2O4during the ALD process. Although only approximate bandgap values can be determined for composite films,57Tauc plots indicate higher (2 eV) indirect bandgap for CuFexOy|TiO2layers compared to CuFexOyfilms (Fig. S19†), in line with the shift of the onset photocurrent potential.
CoHEC catalyst was grafted by immersing CuFexOy|TiO2 electrodes in a methanolic solution of 0.7 M CoHEC overnight. The presence of CoHEC grafted on CuFexOyand CuFexOy|TiO2 was confirmed by UV-visible spectroscopy (Fig. S7†). XPS ana-lysis of the latter reveals a Co species manifested as three 2p3/2
peaks at 781.8, 786.3, and 789.9 eV, while nitrogen 1 s appears poorly resolved at 400.3 eV (Fig. S9†). Here again, the amount of cobalt catalyst was estimated by ICP at the detection limit of the technique, i.e. close to 0.085 nmol cm−2. EDX analysis con-firmed the presence of Ti on the photoelectrode surface both before and after the photoelectrochemical experiment.
Photocurrents recorded for CuFexOy|TiO2-CoHEC photo-cathodes proved to be more stable over time since no decrease in the photocurrent was observed after 20 minutes (Fig. 6B). Within 20 min, CuFexOy|TiO2-CoHEC photocathodes produced 7.6 ± 2 nmol H2per cm2with 54% FY. A control experiment of CuFexOy|TiO2 in the absence of the CoHEC catalyst was launched recording 4.3 ± 1 nmol H2per cm2and 22% FY. The TON based on estimated Co surface concentration was 90 ± 30 for CuFexOy|TiO2-CoHEC. The TOFs for CuFexOy|TiO2-CoHEC were estimated to 0.08 s−1. All these values are summarized in Table 1.
Additional measurements were carried out under the same conditions but with slightly higher visible-light intensity (up to 100 mW cm−2; 1.3 sun). CuFexOySTRUCT and CuFexOySTRUCT -CoHEC displayed 3% and 6% FY respectively, with similar behaviour regarding the desorption of catalyst and poor stabi-lity (Fig. S20†). However, under these conditions, the protected CuFexOy|TiO2-CoHEC photocathode showed 88% FY and 90 TON achieved within 20 min.
The hybrid photocathodes were evaluated up to two hours without increase in the amount of hydrogen detected, suggesting the photocathodes lost their activity following de-sorption of the catalyst which was already confirmed by the absence of peaks in the ICP and XPS measurements after 20 min CA (Fig. S8 and S9†).
Clearly, the presence of TiO2 significantly and positively affects the FY for H2 evolution. Although the photocurrent values are significantly lower for TiO2-protected photoelec-trodes, the amount of hydrogen produced remains similar (4.8 nmol cm−2for CuFexOyand 4.3 nmol cm−2for CuFexOy| TiO2) or largely enhanced (4.8 nmol cm−2for CuFexOySTRUCT -CoHEC and 7.6 nmol cm−2 for CuFexOy|TiO2-CoHEC). This indicates that TiO2has no significant effect in the catalysis for hydrogen evolution but that it prevents at least partially the photocorrosion of the semiconductor. The protected photo-cathodes showed an average Cu : Fe ratio of 1 : 1.8, unchanged after photoelectrochemical measurement. Any modification in the phase of the material was not observed by XRD after chron-oamperometry (Fig. S11†). Additionally, the presence of TiO2 significantly limits the decrease in the photocurrent intensity over time, indicating a better stability of the anchoring of the carboxylate functions of CoHEC onto TiO2 compared to CuFexOy.
When compared with other hybrid photocathodes from the literature, i.e. the p-GaInP2/TiO2-cobaloxime architecture described by Turner et al. (100% FY, TON = 1 400 000),26p-Si/ mesoTiO2-NiP system described by Reisner (80% FY, TON = 646)49 and the p-Si/mesoTiO2-CoC11P photocathode reported recently by us (>80% FY, TON > 200),23the performance of the hybrid CuFexOy|TiO2-CoHEC (54–88% FY, TON = 90) may
Green Chemistry Paper
1 5 10 15 20 25 30 35 40 45 50 55 1 5 10 15 20 25 30 35 40 45 50 55
appear limited. However, previous litterature data were measured at an applied potential of 0–0.1 V vs. RHE, i.e. with a much larger driving force compared to data reported here, which were measured at 0.4 V vs. RHE. Besides stability and selectivity, important metrics for the photocathode perform-ances are indeed its onset photopotential and the maximum photocurrent density. While p-Si and Cu2O-based photo-cathodes display limited onset photocurrent potentials (<0.4 V vs. RHE), the CuFexOy-based ones reported here perform better with 0.7 V vs. RHE onset photocurrent potential. Although not as efficient as those displayed by WSe258 or (CuGa1−yIny)1−xZn2xS259photocathodes, such a positive value vs. RHE compares well with the onset photocurent potentials of dye-sensitized NiO35,60–62 and CuCrO263 or CuGaO225 photocathodes. However, the maximum photocurrent reported here is already one order of magnitude higher compared to dye-sensitized molecular photocathodes and there is still room for improvement through the composition optimization and nanostructuration. The cost and scalability of CuFexOy materials are similar to those of the above mentioned trans-parent semiconducting oxides, while there is no need to sensi-tize them as they naturally absorb in the visible region. Compared with expensive III–V semiconductors such as InP, GaP or GaInP2, such ternary oxide-based semiconductors therefore prove promising for implementation in photoelectro-chemical cells.7,25,27,64
Conclusion
We successfully designed a hybrid photocathode for H2 evol-ution exclusively based on Earth-abundant elements. 300 nm thick CuFexOyfilms indeed behave as a visible light absorber, perform charge separation and transport electron to the inter-face with the electrolyte where molecular catalyst can be posi-tioned, for H2evolution to occur at a potential 860 mV more positive compared to the dark conditions. Atomic layer depo-sition of amorphous TiO2 layer on top of the CuFexOy film enhances the efficiency and improves the stability of the photo-electrode. Nevertheless, the stability of CuFexOy material remains challenging and must be further improved for PEC applications, calling for a better understanding of the modifi-cations of CuFexOy films upon heat, irradiation or electro-chemical treatment.
Con
flicts of interest
■■■■
Q4
Acknowledgements
This work is supported by the CEA DRF Impulsion 2018 and the Make Our Planet Great Again (MOPGA) programs, as well as the Agence Nationale de la Recherche (Labex ARCANE, CBH-EUR-GS, ANR-17-EURE-0003). We acknowledge Adina
Morozan for her help regarding the characterization of the CuFexOyfilms.
References
1 O. Kraan, G. J. Kramer, M. Haigh and C. Laurens, Joule, 2019, 3, 2286–2290.
2 S. Ardo, D. F. Rivas, M. A. Modestino, V. S. Greiving, F. F. Abdi, E. A. Llado, V. Artero, K. Ayers, C. Battaglia, J.-P. Becker, D. Bederak, A. Berger, F. Buda, E. Chinello, B. Dam, V. D. Palma, T. Edvinsson, K. Fujii, H. Gardeniers, H. Geerlings, S. M. H. Hashemi, S. Haussener, F. Houle, J. Huskens, B. D. James, K. Konrad, A. Kudo, P. Patil Kunturu, D. Lohse, B. Mei, E. L. Miller, G. F. Moore, J. Muller, K. L. Orchard, T. E. Rosser, F. H. Saadi, J.-W. Schüttauf, B. Seger, S. W. Sheehan, W. A. Smith, J. Spurgeon, M. H. Tang, R. van de Krol, P. C. K. Vesborg and P. Westerik, Energy Environ. Sci., 2018, 11, 2768–2783. Q5
3 R. van de Krol and M. Gratzel, Photoelectrochemical Hydrogen Production, Springer US, 2012, vol. 102.
4 L. Pan, N. Vlachopoulos and A. Hagfeldt, ChemSusChem, 2019, 12, 4337–4352.
5 X. Li, B. Liu, Y. Chen, X. Fan, Y. Li, F. Zhang, G. Zhang and W. Peng, Nanotechnology, 2018, 29, 505603.
6 H. Qi, J. Wolfe, D. Fichou and Z. Chen, Sci. Rep., 2016, 6, 30882.
7 A. Paracchino, V. Laporte, K. Sivula, M. Grätzel and E. Thimsen, Nat. Mater., 2011, 10, 456.
8 L. Pan, Y. Liu, L. Yao, D. Ren, K. Sivula, M. Grätzel and A. Hagfeldt, Nat. Commun., 2020, 11, 318.
9 Y.-H. Lai, H. S. Park, J. Z. Zhang, P. D. Matthews, D. S. Wright and E. Reisner, Chem.– Eur. J., 2015, 21, 3919– 3923.
10 J. D. Benck, S. C. Lee, K. D. Fong, J. Kibsgaard, R. Sinclair and T. F. Jaramillo, Adv. Energy Mater., 2014, 4, 1400739. 11 M. Lancaster, R. Mow, J. Liu, Q. Cheek, M. M. MacInnes,
M. M. Al-Jassim, T. G. Deutsch, J. L. Young and S. Maldonado, ACS Appl. Mater. Interfaces, 2019, 11, 25115– 25122.
12 B. Kim, G.-S. Park, S. Y. Chae, M. K. Kim, H.-S. Oh, Y. J. Hwang, W. Kim and B. K. Min, Sci. Rep., 2018, 8, 1–10.
13 R. Fan, J. Mao, Z. Yin, J. Jie, W. Dong, L. Fang, F. Zheng and M. Shen, ACS Appl. Mater. Interfaces, 2017, 9, 6123– 6129.
14 D. Cedeno, A. Krawicz, P. Doak, M. Yu, J. B. Neaton and G. F. Moore, J. Phys. Chem. Lett., 2014, 5, 3222–3226. 15 A. Krawicz, D. Cedeno and G. F. Moore, Phys. Chem. Chem.
Phys., 2014, 16, 15818–15824.
16 K. Sekizawa, K. Oh-ishi, K. Kataoka, T. Arai, T. M. Suzuki and T. Morikawa, J. Mater. Chem. A, 2017, 5, 6483–6493. 17 K. Rajeshwar, M. K. Hossain, R. T. Macaluso, C. Janáky,
A. Varga and P. J. Kulesza, J. Electrochem. Soc., 2018, 165, H3192–H3206. 1 5 10 15 20 25 30 35 40 45 50 55 1 5 10 15 20 25 30 35 40 45 50 55
18 M. S. Prévot, X. A. Jeanbourquin, W. S. Bourée, F. Abdi, D. Friedrich, R. van de Krol, N. Guijarro, F. Le Formal and K. Sivula, Chem. Mater., 2017, 29, 4952–4962.
19 H.-Y. Chen and J.-H. Wu, Appl. Surf. Sci., 2012, 258, 4844– 4847.
20 C. G. Read, Y. Park and K.-S. Choi, J. Phys. Chem. Lett., 2012, 3, 1872–1876.
21 Y. J. Jang, Y. B. Park, H. E. Kim, Y. H. Choi, S. H. Choi and J. S. Lee, Chem. Mater., 2016, 28, 6054–6061.
22 N. Kaeffer, M. Chavarot-Kerlidou and V. Artero, Acc. Chem. Res., 2015, 48, 1286–1295.
23 S. Chandrasekaran, N. Kaeffer, L. Cagnon, D. Aldakov, J. Fize, G. Nonglaton, F. Baleras, P. Mailley and V. Artero, Chem. Sci., 2019, 10, 4469–4475.
24 N. M. Muresan, J. Willkomm, D. Mersch, Y. Vaynzof and E. Reisner, Angew. Chem., Int. Ed., 2012, 51, 12749–12753. 25 C. D. Windle, H. Kumagai, M. Higashi, R. Brisse, S. Bold,
B. Jousselme, M. Chavarot-Kerlidou, K. Maeda, R. Abe, O. Ishitani and V. Artero, J. Am. Chem. Soc., 2019, 141, 9593–9602.
26 J. Gu, Y. Yan, J. L. Young, K. X. Steirer, N. R. Neale and J. A. Turner, Nat. Mater., 2015, 15, 456.
27 S. Donck, J. Fize, E. Gravel, E. Doris and V. Artero, Chem. Commun., 2016, 52, 11783–11786.
28 K. Fan, F. Li, L. Wang, Q. Daniel, E. Gabrielsson and L. Sun, Phys. Chem. Chem. Phys., 2014, 16, 25234–25240. 29 F. Li, K. Fan, B. Xu, E. Gabrielsson, Q. Daniel, L. Li and
L. Sun, J. Am. Chem. Soc., 2015, 137, 9153–9159.
30 M. Wang, Y. Yang, J. Shen, J. Jiang and L. Sun, Sustainable Energy Fuels, 2017, 1, 1641–1663.
31 E. A. Gibson, Chem. Soc. Rev., 2017, 46, 6194–6209.
32 P. Xu, N. S. McCool and T. E. Mallouk, Nano Today, 2017, 14, 42–58.
33 H.-Y. Chen and G.-W. Fu, Appl. Surf. Sci., 2014, 288, 258– 264.
34 J. E. O’Reilly, Biochim. Biophys. Acta, Bioenerg., 1973, 292, 509–515.
35 C. D. Windle, J. Massin, M. Chavarot-Kerlidou and V. Artero, Dalton Trans., 2018, 47, 10509–10516.
36 B. Li, M. Li, C. Yao, Y. Shi, D. Ye, J. Wu and D. Zhao, J. Mater. Chem. A, 2013, 1, 6742–6749.
37 M. J. Han, Z. H. Duan, J. Z. Zhang, S. Zhang, Y. W. Li, Z. G. Hu and J. H. Chu, J. Appl. Phys., 2013, 114, 163526
Q6 .
38 H. Yang, J. Yan, Z. Lu, X. Cheng and Y. Tang, J. Alloys Compd., 2009, 476, 715–719.
39 S. Park, J. H. Baek, L. Zhang, J. M. Lee, K. H. Stone, I. S. Cho, J. Guo, H. S. Jung and X. Zheng, ACS Sustainable Chem. Eng., 2019, 7, 5867–5874.
40 R. L. Spray and K.-S. Choi, Chem. Mater., 2009, 21, 3701– 3709.
41 W. P. Gomes and D. Vanmaekelbergh, Electrochim. Acta, 1996, 41, 967–973.
42 F. Wang, W. Septina, A. Chemseddine, F. F. Abdi, D. Friedrich, P. Bogdanoff, R. van de Krol, S. D. Tilley and S. P. Berglund, J. Am. Chem. Soc., 2017, 139, 15094–15103.
43 S. P. Berglund, F. F. Abdi, P. Bogdanoff, A. Chemseddine, D. Friedrich and R. van de Krol, Chem. Mater., 2016, 28, 4231–4242.
44 Z. Chen, Photoelectrochemical Water Splitting - Standards, Experimental Methods, and Protocols, Springer. Q7
45 M. S. Prévot, N. Guijarro and K. Sivula, ChemSusChem, 2015, 8, 1359–1367.
46 S. R. Morrison, Electrochemistry at Semiconductor and Oxidized Metal Electrodes, Springer, 1980.
47 J. Huang, Y. Tang, K. L. Mulfort and X. Zhang, Phys. Chem. Chem. Phys., 2016, 18, 4300–4303.
48 M. C. Biesinger, B. P. Payne, A. P. Grosvenor, L. W. M. Lau, A. R. Gerson and R. St. C. Smart, Appl. Surf. Sci., 2011, 257, 2717–2730.
49 J. J. Leung, J. Warnan, D. H. Nam, J. Z. Zhang, J. Willkomm and E. Reisner, Chem. Sci., 2017, 8, 5172–5180.
50 J. R. McKone, A. P. Pieterick, H. B. Gray and N. S. Lewis, J. Am. Chem. Soc., 2013, 135, 223–231.
51 B. Reuillard, J. Warnan, J. J. Leung, D. W. Wakerley and E. Reisner, Angew. Chem., Int. Ed., 2016, 55, 3952–3957. 52 J. Toupin, H. Strub, S. Kressmann, M. Boudot, V. Artero
and C. Laberty-Robert, Phys. Chem. Chem. Phys., 2017, 19, 30675–30682.
53 C. G. Morales-Guio, L. Liardet, M. T. Mayer, S. D. Tilley, M. Grätzel and X. Hu, Angew. Chem., Int. Ed., 2014. Q8
54 I. V. Bagal, N. R. Chodankar, M. A. Hassan, A. Waseem, M. AliJohar, D.-H. Kim and S.-W. Ryu, Int. J. Hydrogen Energy, 2019, 44, 21351–21378.
55 S. Hu, M. R. Shaner, J. A. Beardslee, M. Lichterman, B. S. Brunschwig and N. S. Lewis, Science, 2014, 344, 1005.
56 T. Moehl, J. Suh, L. Sévery, R. Wick-Joliat and S. D. Tilley, ACS Appl. Mater. Interfaces, 2017, 9, 43614–43622.
57 P. Makuła, M. Pacia and W. Macyk, J. Phys. Chem. Lett., 2018, 9, 6814–6817.
58 X. Yu, M. S. Prévot, N. Guijarro and K. Sivula, Nat. Commun., 2015, 6, 1–8.
59 T. Hayashi, R. Niishiro, H. Ishihara, M. Yamaguchi, Q. Jia, Y. Kuang, T. Higashi, A. Iwase, T. Minegishi, T. Yamada, K. Domen and A. Kudo, Sustainable Energy Fuels, 2018, 2, 2016–2024.
60 M. A. Gross, C. E. Creissen, K. L. Orchard and E. Reisner, Chem. Sci., 2016, 7, 5537–5546.
61 N. Kaeffer, C. D. Windle, R. Brisse, C. Gablin, D. Leonard, B. Jousselme, M. Chavarot-Kerlidou and V. Artero, Chem. Sci., 2018, 9, 6721–6738.
62 N. Kaeffer, J. Massin, C. Lebrun, O. Renault, M. Chavarot-Kerlidou and V. Artero, J. Am. Chem. Soc., 2016, 138, 12308– 12311.
63 C. E. Creissen, J. Warnan and E. Reisner, Chem. Sci., 2018, 9, 1439–1447.
64 D. H. Nam, J. Z. Zhang, V. Andrei, N. Kornienko, N. Heidary, A. Wagner, K. Nakanishi, K. P. Sokol, B. Slater, I. Zebger, S. Hofmann, J. C. Fontecilla-Camps, C. B. Park and E. Reisner, Angew. Chem., Int. Ed., 2018, 57, 10595– 10599.
Green Chemistry Paper
1 5 10 15 20 25 30 35 40 45 50 55 1 5 10 15 20 25 30 35 40 45 50 55