HAL Id: hal-01806262
https://hal.archives-ouvertes.fr/hal-01806262
Submitted on 28 Aug 2018
HAL is a multi-disciplinary open access
archive for the deposit and dissemination of
sci-entific research documents, whether they are
pub-lished or not. The documents may come from
teaching and research institutions in France or
abroad, or from public or private research centers.
L’archive ouverte pluridisciplinaire HAL, est
destinée au dépôt et à la diffusion de documents
scientifiques de niveau recherche, publiés ou non,
émanant des établissements d’enseignement et de
recherche français ou étrangers, des laboratoires
publics ou privés.
protocols after temperature offset correction –
instrument diagnostics by in-depth evaluation of
operational parameters
P. Panteliadis, T. Hafkenscheid, B. Cary, E. Diapouli, A. Fischer, O. Favez, P.
Quincey, M. Viana, R. Hitzenberger, R. Vecchi, et al.
To cite this version:
P. Panteliadis, T. Hafkenscheid, B. Cary, E. Diapouli, A. Fischer, et al.. ECOC comparison
ex-ercise with identical thermal protocols after temperature offset correction – instrument diagnostics
by in-depth evaluation of operational parameters. Atmospheric Measurement Techniques, European
Geosciences Union, 2015, 8 (2), pp.779 - 792. �10.5194/amt-8-779-2015�. �hal-01806262�
www.atmos-meas-tech.net/8/779/2015/ doi:10.5194/amt-8-779-2015
© Author(s) 2015. CC Attribution 3.0 License.
ECOC comparison exercise with identical thermal protocols after
temperature offset correction – instrument diagnostics by in-depth
evaluation of operational parameters
P. Panteliadis1, T. Hafkenscheid2, B. Cary3, E. Diapouli4, A. Fischer5, O. Favez6, P. Quincey7, M. Viana8, R. Hitzenberger9, R. Vecchi10, D. Saraga11, J. Sciare12, J. L. Jaffrezo13, A. John14, J. Schwarz15, M. Giannoni16, J. Novak17, A. Karanasiou8, P. Fermo18, and W. Maenhaut19
1Municipal Health Service (GGD) Amsterdam, Department of Air Quality, Amsterdam, the Netherlands 2National Institute for Public Health and the Environment, Bilthoven, the Netherlands
3Sunset Laboratory Inc, Tigard, Oregon, USA
4National Center for Scientific Research “Demokritos”, Institute of Nuclear & Radiological Sciences &
Technology, Energy & Safety, Athens, Greece
5EMPA – Swiss Federal Laboratories for Materials Science and Technology, Duebendorf, Switzerland 6INERIS, Verneuil-en-Halatte, France
7National Physical Laboratory, Teddington, UK
8Institute for Environmental Assessment and Water Research (IDAEA-CSIC), Barcelona, Spain 9Aerosolphysics and Environmental Physics, Faculty of Physics, Vienna, Austria
10Department of Physics, Università degli Studi di Milano, Milan, Italy
11Demokritos, National Center for Scientific Research, Environmental Research Laboratory, Athens, Greece 12Laboratoire des Sciences du Climat et de l’Environnement (LSCE), CEA-CNRS-UVSQ, Gif-sur-Yvette, France 13Univ. Grenoble Alpes, CNRS, LGGE, 38000 Grenoble, France
14Institute for Energy and Environmental Technology e.V. Air Quality & Sustainable Nanotechnology
Division, Duisburg, Germany
15Institute of Chemical Process Fundamentals AS CR, Prague, Czech Republic 16Istituto Nazionale di Fisica Nucleare (INFN), Sezione di Firenze, Florence, Italy 17Czech Hydrometeorological Institute, Prague, Czech Republic
18Department of Chemistry, Università degli Studi di Milano, Milan, Italy 19Department of Analytical Chemistry, Ghent University, Gent, 9000, Belgium
Correspondence to: P. Panteliadis ([email protected])
Received: 6 June 2014 – Published in Atmos. Meas. Tech. Discuss.: 26 August 2014 Revised: 26 January 2015 – Accepted: 27 January 2015 – Published: 17 February 2015
Abstract. A comparison exercise on thermal-optical
elemen-tal carbon/organic carbon (ECOC) analysers was carried out among 17 European laboratories. Contrary to previous com-parison exercises, the 17 participants made use of an iden-tical instrument set-up, after correcting for temperature off-sets with the application of a recently developed tempera-ture calibration kit (Sunset Laboratory Inc, OR, US). Tem-perature offsets reported by participants ranged from −93 to
+100◦C per temperature step. Five filter samples and two
su-crose solutions were analysed with both the EUSAAR2 and NIOSH870 thermal protocols.
zscores were calculated for total carbon (TC); nine out-liers and three stragglers were identified. Three outout-liers and eight stragglers were found for EC. Overall, the participants provided results between the warning levels with the ex-ception of two laboratories that showed poor performance, the causes of which were identified and corrected through the course of the comparison exercise. The TC
repeatabil-ity and reproducibilrepeatabil-ity (expressed as relative standard devi-ations) were 11 and 15 % for EUSAAR2 and 9.2 and 12 % for NIOSH870; the standard deviations for EC were 15 and 20 % for EUSAAR2 and 20 and 26 % for NIOSH870.
TC was in good agreement between the two pro-tocols, TCNIOSH870=0.98 × TCEUSAAR2 (R2=1.00,
ro-bust means). Transmittance (TOT) calculated EC for NIOSH870 was found to be 20 % lower than for EU-SAAR2, ECNIOSH870=0.80 × ECEUSAAR2 (R2=0.96,
ro-bust means). The thermograms and laser signal values were compared and similar peak patterns were observed per sam-ple and protocol for most participants. Notable deviations from the typical patterns indicated either the absence or in-accurate application of the temperature calibration proce-dure and/or pre-oxidation during the inert phase of the anal-ysis. Low or zero pyrolytic organic carbon (POC), as re-ported by a few participants, is suggested as an indicator of an instrument-specific oxidation. A sample-specific pre-oxidation effect was observed for filter G, for all participants and both thermal protocols, indicating the presence of oxy-gen donors on the suspended particulate matter. POC (TOT) levels were lower for NIOSH870 than for EUSAAR2, which is related to the heating profile differences of the two thermal protocols.
1 Introduction
Carbon in suspended atmospheric particulate matter usu-ally falls into one of three wide categories, elemental car-bon (EC), organic carcar-bon (OC), and carcar-bonate carcar-bon (CC), the major fraction of inorganic carbon. Recently, more at-tention has been drawn to EC, due to its linkage to adverse health (Highwood and Kinnersley, 2006; Adar and Kauf-man, 2007; Janssen et al., 2011, 2012) and climate effects (Jacobson, 2001; IPCC, 2007; Ramanathan and Carmichael, 2008). Several studies suggest that EC is a valid indicator for traffic emissions and include its analysis during monitoring campaigns (Lena et al., 2002; Schauer, 2003; Qadir et al., 2013; Panteliadis et al., 2014). A number of EC measure-ment techniques exist (Watson et al., 2005; Hitzenberger et al., 2006) with the thermal-optical transmittance (TOT) or re-flectance (TOR) methods being broadly used in Europe and the USA. Several thermal protocols, which apply to TOT or TOR analysers, have been developed with NIOSH5040 (Birch and Cary, 1996), IMPROVE A (Chow et al., 2007) and EUSAAR2 (Cavalli et al., 2010) being the most com-monly applied.
Even though quality assurance and quality control (QA/QC) procedures are of importance for any air quality measurements, no standard has yet been established in Eu-rope for ECOC analysis (Chow et al., 2011). Following the EU Directive 2008/50/EC on ambient air and cleaner air for Europe, a technical report has been published (CEN TR
16243, 2011) and further work is currently being carried out towards method standardization within CEN-TC 264 (Eu-ropean Committee for Standardization) Working Group 35. Alongside the implementation of the technical report recom-mendations in the standard operation procedures of labora-tories, comparison exercises are an important additional step towards QA/QC optimization.
The department of Air Quality of Public Health Service Amsterdam has been organizing laboratory comparison ex-ercises for the past few years on thermal-optical ECOC anal-ysers (Panteliadis, 2009a, 2011). To our knowledge, previ-ous laboratory comparisons performed in Europe up to 2013 considered results derived from different protocols applied by each participant, usually NIOSH-like (CEN TR 16243, 2011) or EUSAAR2, on filter samples, limiting comparabil-ity of the performance of each laboratory. Numerous stud-ies have demonstrated that ECOC analysis of ambient sam-ples is sensitive to the temperature protocol selected (Sciare et al., 2003; Schauer et al., 2003; Chow et al., 2004; Cav-alli et al., 2010; Zhi et al., 2011; Piazzalunga et al., 2011; Cheng et al., 2011, 2012). As a result, the temperature proto-col selection may affect the conclusions obtained from com-parisons between thermal-optical and optical (black carbon) analysis (Schmid et al., 2001; Schauer et al., 2003; ten Brink et al., 2004). Differences also occur with regard to the op-tical method used for the charring carbon correction, trans-mittance or reflectance, with the latter usually resulting in greater EC concentrations (Chow et al., 2004; Panteliadis, 2009b; Maenhaut et al., 2011).
The scope of this 2012 comparison exercise was to eval-uate results based on an identical set-up for all participants using a lab ECOC analyser (Sunset Laboratory Inc., Tigard, OR, US). Generally in such exercises the same thermal proto-col would be applied by all participants. However, the debate over the NIOSH-like and the EUSAAR2 thermal protocols is still ongoing in Europe, and the selection of a single tem-perature protocol would have been controversial and limit-ing. Comparison exercises performed so far have let the par-ticipants decide on the protocol applied (Panteliadis, 2009a, 2011; Emblico et al., 2012; Cavalli et al., 2012). As an alter-native, we decided to stipulate the use of both NIOSH870, one of the latest versions of NIOSH-like protocols, and EU-SAAR2 by each participant, providing additional informa-tion that could point out possible differences between the two protocols.
Each thermal protocol involves several temperature steps, and instrument-specific deviations from the desired tempera-ture may alter the sample treatment and affect the analysis re-sult (Chow et al., 2005). These deviations may originate from differences in type, age or installation of the heating coils used in each instrument. Since the introduction of a temper-ature calibration kit by the analyser’s manufacturer (Sunset Laboratory Inc, OR, US) in early 2012, it has become pos-sible to minimize such deviations. All participants using the lab ECOC analyser performed the calibration procedure and
compensated for the temperature offsets before the compari-son exercise analysis.
A common practice for total carbon (TC) calibrations and routine checks is the analysis of standard sucrose solutions. Such sucrose solutions were included in the current exercise in order to provide an insight into the degree of repeatabil-ity of these procedures, as well as to evaluate the practica-bility of adding a known volume of sucrose on the filter to be analysed. Unfortunately, the standard sucrose solutions can only provide information on calibration with pure OC. A suitable reference material consisting of pure EC is still lacking (Baumgardner et al., 2012). Finally, on top of the standard statistical analysis usually performed in such com-parison exercises, a more in-depth evaluation of instrument specific parameters and characteristics, including the laser and the flame ionization detector (FID) signal as well as the peak distribution and calibration peak area, was carried out.
2 Methods
2.1 Sample preparation and distribution
A total of five 24 h PM loaded samples were collected for the exercise. Filters were selected with the intention of cov-ering a common range of characteristics that occur in sam-ples used for ECOC analysis. It is known, however, that the limited number of filters selected cannot be fully represen-tative of the wide variety of ambient samples, which can be influenced by a number of parameters such as particle com-position, pollution sources, seasonal and spatial variation.
The urban background sample from Amsterdam, The Netherlands, was collected with a PM10 high volume
sam-pler (HVS) (ESM Andersen Instruments GmbH, Germany) on a Whatman QMA rectangular filter, 20.3 × 25.4 cm. The same filter type was used for the urban background sam-ple from Athens, Greece, collected with a PM3GS2312 BL
HVS (Tisch Environmental, Ohio, US). Two PM2.5suburban
samples were collected in Duebendorf, Switzerland, with the use of a DHA80 sampler (Digitel Elektronik AG, Switzer-land) on 150 mm diameter Pallflex Tissuquartz filters, on two consecutive dates. The same type of sampler and filter was used for the urban sample collected in Berne, Switzerland. The amount of transmitted laser light compared to the blank value, per filter, was reported by the organizing laboratory. An overview of the filters characteristics and sampling de-tails is presented in Table 1.
Upon receipt at GGD Amsterdam, all filters were stored at a temperature below 5◦C till the distribution date. Four rectangular punches of 1 × 1.5 cm2per participant were cut out from different sections and increasing distance from the centre of each filter to avoid any sampling bias. For the same reason no punches were cut from the sampled area close to the edges of the filters. The punches were then stored in sep-arate, closed, Petri-slide dishes, which were sent to each
par-ticipant together with 30 mL vials of two standard sucrose so-lutions, S1 and S2, with nominal OC concentrations of 10.0 and 33.6 µg 10 µL−1, respectively. For the two participants
using a field instrument four circular punches of 2 cm2were prepared instead.
The homogeneity of PM loaded HVS filters, for the ex-act same samplers and filter media, had already been tested by GGD Amsterdam, and resulted in relative standard devia-tions of 11 % for EC, 6 % for OC and 5 % for TC, for 150 mm Pallflex Tissuquartz HVS filters, and 10 % for EC, 9 % for OC and 6 % for TC for Whatman QMA HVS filters (Table S1 in the Supplement). These values, however, represent only an indication of the expected within sample standard deviation for filter samples used in the current comparison exercise.
2.2 ECOC analysis
The EC, OC and TC concentrations in the PM samples and sucrose solutions were determined by all participants with the use either of a lab ECOC aerosol analyser (15 partici-pants), or a semi-continuous ECOC field analyser (2 partic-ipants), all manufactured by Sunset Laboratory Inc. (Tigard, OR, US).
During the analysis, OC desorbs from the quartz fibre filter through progressive heating under a pure He stream, while a fraction of OC chars and forms pyrolysed organic carbon (POC). The sample is then heated in temperature steps un-der a mixture of 98 % He – 2 % O2 (HeOx phase) and the
POC and EC are desorbed. In order to correct for the pyroly-sis effect, the analyser utilizes a 658 nm laser beam, reflected and/or transmitted through the filter media. The split point, which separates OC from EC and compensates for POC, is determined when the laser signal returns to its initial value. OC, EC and POC are catalytically converted, initially to CO2
and then to CH4, which is quantified with the use of an FID.
The time necessary for the gaseous compounds desorbed to reach the FID unit from the filter media is defined as transit time and is an instrument-specific parameter. A fixed volume of calibration gas (5 % CH4in helium) is injected in the
in-strument at the end of each analysis and the responding FID signal forms the calibration peak. The area of the calibra-tion peak together with a calibracalibra-tion constant are used for the calculation of the sample concentration. The calibration con-stant depends on the calibration gas fixed volume analysed per run, which is set by the manufacturer, and is instrument-specific.
The operating parameters of the analyser vary with the thermal protocol used during analysis. The two protocols mainly used in Europe, NIOSH870 and EUSAAR2, were applied by all participants for the analysis of the sample punches provided. Before analysis, most participants cali-brated their instruments for temperature offsets at each step, with the use of a calibration kit. The temperature calibra-tion procedure has to be applied for each thermal protocol separately, since they vary in the number of steps,
tempera-Table 1. PM loaded filters description and sampling details.
Filter Location Site PM Filter type Date Volume Sampling Instrument % Transmitted code description fraction (m3) time (h) laser intensity
(µg m−3) compared to blank A Athens Urban 3.0 (NA)2 Whatman 1 Mar 2012 1411 24 Andersen GS2312 38
QMA
background 20.3 × 25.4 cm BL HVS
B Berne Urban 2.5 (72.8) Pallflex 9 Feb 2012 720 24 Digitel DHA80 14 Tissuquartz
150 mm
D Duebendorf Suburban 2.5 (7.8) Pallflex 15 Feb 2012 720 24 Digitel DHA80 51 Tissuquartz
150 mm
G Amsterdam Urban 10 (24.4) Whatman 13 Dec 20051 1625 24 Andersen/GMW 32 QMA
background 20.3 × 25.4 cm 1200 HVS
U Duebendorf Suburban 2.5 (37.0) Pallflex 14 Feb 2012 720 24 Digitel DHA80 23 Tissuquartz
150 mm
1Stored below 5◦C till the distribution date;2not available.
Table 2. Details of the two thermal protocols applied by the participants and observed temperature offset range per step.
Carrier gas
NIOSH870 EUSAAR2
Time Temperature Range T offsets Time Temperature Range T offsets (s) (◦C) (◦C) (s) (◦C) (◦C) Purge time 10 – – 10 – – Helium 80 310 (−58–46) 120 200 (−71–100) Helium 80 475 (−51–63) 150 300 (−67–54) Helium 80 615 (−50–70) 180 450 (−60–47) Helium 110 870 (−68–81) 180 650 (−58–51) OC analysis time 360 640
Helium (Oven cool) 45 550 (−93–65) 30 – – Oxygen in helium (2 %) 45 550 (−93–65) 120 500 (−68–49) Oxygen in helium (2 %) 45 625 (−75–67) 120 550 (−59–40) Oxygen in helium (2 %) 45 700 (−65–70) 70 700 (−68–51) Oxygen in helium (2 %) 45 775 (−70–72) 80 850 (−85–64) Oxygen in helium (2 %) 45 850 (−76–73) – – – Oxygen in helium (2 %) 110 870 (−80–63) – – – EC analysis time 380 390 Calibration 120 110
Total analysis time 14 min and 20 s 19 min and 30 s
ture and duration. The differences between EUSAAR2 and NIOSH870, together with the observed offset ranges, are il-lustrated in Table 2.
Two participants performed the temperature calibration only for the EUSAAR2 protocol while one did not apply it at all. Two participants used the temperature offsets as found for the GGD instrument. The temperature calibration procedure was not applicable for the field analysers. A wide range of temperature offsets was observed between participants (−93 to +100◦C), and also between different temperature steps for the same analyser (up to 86◦C). An overview of the thermal
protocols, optical method and temperature offsets applied by each participant can be found in Table 3. The heating profile of each analyser after the temperature offset correction was also recorded for both protocols (Figs. S1–S2 in the Supple-ment).
Two of the four punches received by each participant were analysed with NIOSH870 and two with EUSAAR2, whereas triplicate analyses with both protocols were applied for the two sucrose solutions.
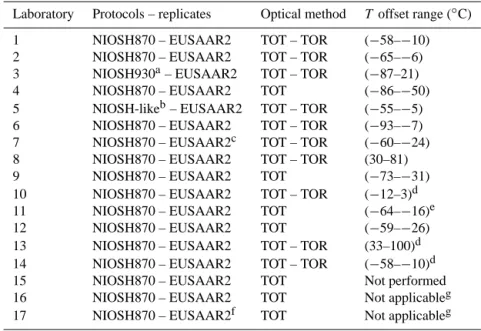
Table 3. Thermal protocols used for replicate analysis, optical method applied and temperature offset range per laboratory. Laboratory Protocols – replicates Optical method T offset range (◦C)
1 NIOSH870 – EUSAAR2 TOT – TOR (−58–−10) 2 NIOSH870 – EUSAAR2 TOT – TOR (−65–−6) 3 NIOSH930a– EUSAAR2 TOT – TOR (−87–21) 4 NIOSH870 – EUSAAR2 TOT (−86–−50) 5 NIOSH-likeb– EUSAAR2 TOT – TOR (−55–−5) 6 NIOSH870 – EUSAAR2 TOT – TOR (−93–−7) 7 NIOSH870 – EUSAAR2c TOT – TOR (−60–−24) 8 NIOSH870 – EUSAAR2 TOT – TOR (30–81) 9 NIOSH870 – EUSAAR2 TOT (−73–−31) 10 NIOSH870 – EUSAAR2 TOT – TOR (−12–3)d 11 NIOSH870 – EUSAAR2 TOT (−64–−16)e 12 NIOSH870 – EUSAAR2 TOT (−59–−26) 13 NIOSH870 – EUSAAR2 TOT – TOR (33–100)d 14 NIOSH870 – EUSAAR2 TOT – TOR (−58–−10)d 15 NIOSH870 – EUSAAR2 TOT Not performed 16 NIOSH870 – EUSAAR2 TOT Not applicableg 17 NIOSH870 – EUSAAR2f TOT Not applicableg
aNIOSH930 applies an additional heating step at the end of the HeOx phase at 930◦C for 120 s;b890◦C applied at the last heating step instead of 870◦;climited number of filters analysed in EUSAAR2;dapplied only for EUSAAR2 protocol;eno calibration performed, GGD offsets applied instead;flimited sample set analysed;gfield analyser.
2.3 Statistical analysis
2.3.1 Laboratory performance
The robust means for the filter samples, derived from the means of replicate measurements, were calculated follow-ing ISO 13528 (2005, Annex C). Due to the lack of a cer-tified reference material, the robust mean for each sample was taken as the consensus reference value. The z scores were calculated for TC and EC, and for EUSAAR2 and NIOSH870, in order to evaluate the capacity of each labo-ratory to comply with the selected fit-for-purpose standard deviation, using the equation:
z = (x − X)/σ, (1)
where x is the result of the participant (average of duplicate analyses), X is the robust mean, σ is the fit-for-purpose stan-dard deviation.
Due to the lack of certified reference methods for ECOC measurements, the fit-for-purpose standard deviations were arbitrarily selected, based on experience and the desired level for compliance purposes: 8.3 % for TC and 25 % for EC. The 8.3 % for TC roughly corresponds to a range of ±25 % into which all results should fall. z scores between the warning levels, −2 and +2, were considered as indications of satis-factory performance, while z scores between the warning and the action levels, −3 and +3, were considered questionable. All z scores outside the action levels range were considered as indications of unsatisfactory performance.
2.3.2 Method performance
The laboratory performance was initially evaluated graph-ically, by sucrose solutions plots and Mandel’s h and k statistics for TC and EC results pooled for both EU-SAAR2 and NIOSH870. The Mandel’s h statistic indicated the between-laboratory consistency while Mandel’s k indi-cated the within-laboratory consistency. Laboratory results reported above the critical value at 1 % significance level were identified as possible outliers, and between the criti-cal values of 1 and 5 % significance level as stragglers (ISO 5725-2, 1994). Grubbs’ and Cochran’s statistical outlier tests were also applied and outliers were removed from the data set for the calculations of the corrected robust means, re-peatability and reproducibility relative standard deviations (ISO 5725-2, 1994).
3 Results
3.1 Data evaluation
All results, as reported by the participating laboratories, namely TC, EC, OC and EC/TC for both TOT and TOR are given in the Supplement, Tables S2–S8. The reported TC concentrations ranged on average from 10.1 to 79.0 µg cm−2, while EC ranged from 0.9 to 11.5 µg cm−2 (TOT) and 1.8
to 17.5 µg cm−2(TOR), depending on the thermal protocol
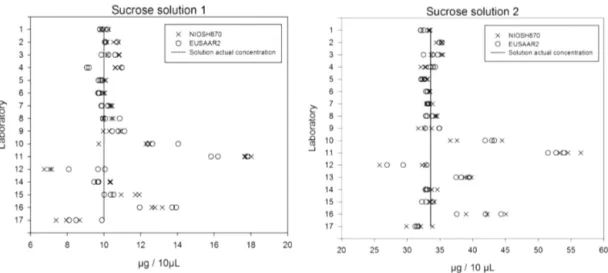
Figure 1. Triplicate sucrose solution analysis (S1 and S2) per protocol and participant. S1 and S2 concentrations of 10.0 and 33.6 µg 10 µL−1, respectively.
3.2 Laboratory performance
An initial overview of deviation in performance can be gained from Fig. 1, which presents graphically the reported results of all participants for the two sucrose solutions.
The z scores for the EC and TC results of the filter sam-ples, calculated separately for EUSAAR2 and NIOSH870, are shown in Figs. S3–S6 in the Supplement. For TC, seven outliers and three stragglers were identified for EUSAAR2, and 12 outliers for NIOSH870, all of which were reported by three participants. For EC, one outlier and four stragglers were identified for EUSAAR2 while two outliers and four stragglers were identified for NIOSH870. All outliers and stragglers were reported by three participants, two of whom were the same as those with high TC z scores.
3.3 Method performance
Figure S7, in the Supplement, presents the Mandel’s k statistic for the sucrose solutions, with the EUSAAR2 and NIOSH870 TC pooled results. Five outliers were identified, two for laboratory 10, two for 12, and one for 16. The out-liers of laboratories 10 and 12 were confirmed by Cochran’s test while the one of laboratory 16 was identified as a strag-gler. The Mandel’s h statistic values for the sucrose solutions can be found in Fig. S8 in the Supplement. Two outliers were found for laboratory 11, confirmed also by Grubbs’ test.
Figure S9, in the Supplement, presents the Mandel’s k statistic values for the loaded filters, for EUSAAR2 and NIOSH870 pooled TC results. Seven outliers were identi-fied, three for laboratory 12, two for 16, and one for each of 10 and 11. Two stragglers were also identified, one for laboratory 13, and one for 16. Two out of the three outliers of laboratory 12, both for 16 and the one for 10 were con-firmed by Cochran’s test while the one for laboratory 11 was identified as a straggler.
The Mandel’s h statistic values for the loaded filters, EU-SAAR2 and NIOSH870 pooled TC results, can be found in Fig. S10 in the Supplement. Five outliers were identified, all for laboratory 11, four of which were indicated as stragglers by Grubbs’ test. Four stragglers were observed, all for labo-ratory 10, one of which was confirmed by Grubbs’ test.
Similarly to Fig. S9, Fig. S11 presents the Mandel’s k statistic values for pooled EC (TOT) results of the loaded filters. Three outliers and two stragglers were identified; one outlier for each of laboratories 3, 4 and 16, and one strag-gler for 15 and 16. The three outliers were also confirmed by Grubbs’ test. Figure S12, in the Supplement, presents the Mandel’s h statistic values for the filters pooled EC (TOT) results. Four outliers and three stragglers were identified in total. Laboratories 10 and 11 reported two outliers and one straggler each while one straggler was reported by laboratory 3 and one by 8. The Grubbs’ test confirmed all outliers and stragglers for laboratories 10 and 11 but not the stragglers for 3 and 8.
The normalized mean values and the repeatability and re-producibility relative standard deviations for the filter sam-ples were calculated initially for the full data set and then after discarding the verified outliers. Table S9 in the Sup-plement shows the values separated by protocol for TC, while Table S10, also in the Supplement, shows the same for EC. For the corrected results, the repeatability relative stan-dard deviation for TC was 11 % for EUSAAR2 and 9 % for NIOSH870. The reproducibility standard deviation was 15 % for EUSAAR2 and 12 % for NIOSH870. For EC, the repeata-bility standard deviation was 15 % for EUSAAR2 and 20 % for NIOSH870. The reproducibility standard deviation was 20 % for EUSAAR2 and 26 % for NIOSH870. All standard deviations were higher for EC than TC. All standard devi-ation values were higher for EUSAAR2 for TC, while the opposite held for EC.
The TC robust means, repeatability and reproducibility standard deviations per filter were calculated for pooled EU-SAAR2 and NIOSH870 results (Table S11 in the Supple-ment). TC robust means ranged from 9.7 to 77.0 µg cm−2. Repeatability ranged from 9 to 12 % and reproducibility from 11 to 15 % per filter.
No significant differences were observed be-tween EUSAAR2 and NIOSH870 for TC, where TCNIOSH870=0.97 × TCEUSAAR2 (R2=0.96) for
loaded PM filters and TCNIOSH870=1.00 × TCEUSAAR2
(R2=0.98) for sucrose solution raw data (Fig. S13 in the Supplement). When the raw data for EC for the loaded filters were compared, EUSAAR2 was found to report higher values, ECNIOSH870=0.73 × ECEUSAAR2 (R2=0.72) for
TOT. For TOR, EUSAAR2 and NIOSH870 were closer, ECNIOSH870=0.85 × ECEUSAAR2 (R2=0.69) (Fig. S14
in the Supplement). For both protocols the use of TOR resulted in notably higher EC concentrations than TOT, 64 % higher (R2=0.52) for EUSAAR2 and 113 % higher (R2=0.44) for NIOSH870 (N = 89). All zero NIOSH870 EC concentrations shown in the graphs were reported by a single participant due to laser failure. Note that not all participants reported data for both TOT and TOR, as a result of instrument configuration.
When the robust means were used for the same plots TCNIOSH870=0.98 × TCEUSAAR2 (R2=1.00) for loaded
PM filters and ECNIOSH870=0.80 × ECEUSAAR2 (R2=
0.96) for TOT and ECNIOSH870=1.15 × ECEUSAAR2(R2=
0.95) for TOR were found (Fig. S15 in the Supplement).
3.4 EUSAAR2 and NIOSH870 comparison
Table 4 shows the ranges of split points reported by the par-ticipants for each filter sample, protocol and optical method used. In all cases the split points in EUSAAR2 occur later than in NIOSH870, due to the extended overall duration of EUSAAR2. The split point defined by TOR appears to oc-cur earlier than that defined by TOT. In most cases the over-all split point range among participants for the same filter is
∼100 s, except for sample A, where it extends up to 200 s, and sample G, up to 300 s. Both samples A and G were col-lected on the same filter media, Whatman QMA, while B, D and U are on Pallflex Tissuquartz, which may relate to the observed deviation. Note that Whatman QMA is thicker, 450 µm, than Pallflex Tissuquartz, 432 µm, as reported by their manufacturers.
The relative standard deviations of the calibration area of each instrument together with the calibration constant, the transit time and the atmospheric pressure are presented in Ta-ble 5. The calibration area relative standard deviations range from 1.4 to 24.6 % and the calibration constant from 17.1 to 28.7. Fluctuations of the atmospheric pressure of the labora-tory may be of influence to the gas flows and consequently to the calibration area. The fluctuations in atmospheric pres-sure, as measured by each instrument, were in most cases
Table 4. Split point ranges as reported by all participants, per sam-ple, protocol and optical method.
Sample Protocol Split point range (s) Transmittance Reflectance A EUSAAR2 (745–941) (772–862) NIOSH870 (434–531) (344–518) B EUSAAR2 (826–932) (772–886) NIOSH870 (427–518) (414–499) D EUSAAR2 (875–997) (840–982) a NIOSH870 (490–593)b (467–569) G EUSAAR2 (582–859) (736–888) NIOSH870 (302–524) (324–521) U EUSAAR2 (808–977) (809–898) c NIOSH870 (471–561) (347–534)
One participant reported clearly outlying split points:a1073 s;b819 s; c991 s.
within a range of 10 mmHg. Nevertheless, five instruments reported values significantly lower than expected, between 374 and 427 mmHg, indicating a possible malfunction or ab-sence of the pressure sensor, which results in the instrument recording an offset value.
The transit time ranges from 6 to 15 s. An incorrect transit time will result in a shift of the split point and thus incorrect concentration values for the OC and EC fractions. A check procedure for the transit time is available from the analyser’s manufacturer but its application was not included in the pre-requisites of the current comparison exercise.
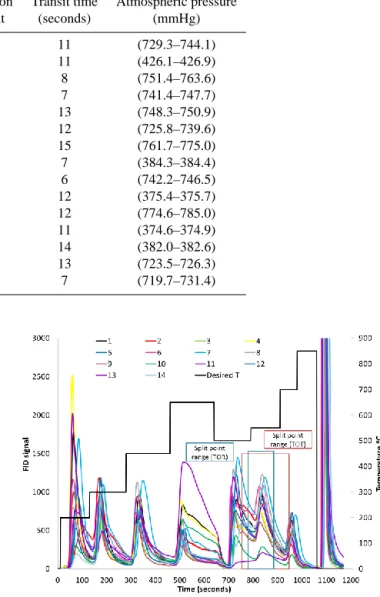
Thermograms for sample A from different participants us-ing NIOSH870 showed a similar peak distribution with a high first peak, low second, third and fourth peaks and a high fifth peak when POC and EC evolve. The split point range covers almost the whole fifth peak and no EC is measured after 600 s (Fig. 2). The EUSAAR2 thermograms for sam-ple A show more variation in the peak distribution than the NIOSH870 thermograms, but in general start with a high first peak, with the second, third, and fourth peaks gradually re-ducing in size. Then a high fifth peak is observed when the POC and EC desorb, followed by a gradual decrease in the sixth and seventh peaks. EC seems to desorb up to the very end of the analysis (Fig. 3). Similar observations can be made for filter B (Figs. S16–S17).
For the sucrose solutions, with the exception of a couple of participants, there is good agreement in the peak distribution, which is better for NIOSH870 than EUSAAR2 (Figs. 4, 5). For NIOSH870, most of the OC is evolved in the first peak, followed by low second, third and fourth peaks and a slightly higher fifth peak for the POC. Almost no carbon is measured after 600 s. For EUSAAR2, most of the participants reported a high second peak and lower third, fourth, and fifth peaks. The POC evolves in a wide time frame from 700 s until the end of the analysis in some cases. Four participants report a medium to low first peak, while for the rest of the
partici-Table 5. Relative standard deviations (% rSD) of calibration area for all analyses per participant. Instrument specific characteristics, calibra-tion constant, transit time and atmospheric pressure.
Laboratory % rSD Calibration Transit time Atmospheric pressure calibration area constant (seconds) (mmHg)
1 1.9 23.4 11 (729.3–744.1) 2 2.0 19.9 11 (426.1–426.9) 3 14.9 24.7 8 (751.4–763.6) 4 1.4 17.1 7 (741.4–747.7) 5 2.8 24.6 13 (748.3–750.9) 6 3.0 24.6 12 (725.8–739.6) 7 2.3 20.9 15 (761.7–775.0) 8 1.4 25.5 7 (384.3–384.4) 9 14.4 23.4 6 (742.2–746.5) 10 14.6 20.1 12 (375.4–375.7) 11 4.6 28.7 12 (774.6–785.0) 12 24.6 18.6 11 (374.6–374.9) 13 8.9 22.0 14 (382.0–382.6) 14 10.2 22.3 13 (723.5–726.3) 15 3.8 22.5 7 (719.7–731.4)
Figure 2. Thermograms of ECOC analysis on PM loaded quartz fibre filter (A sample), by NIOSH870 for all participants.
pants it is not present. This first peak may be an indication of contamination due to handling during the sucrose analysis procedure. Such contamination would not be visible with the NIOSH870 protocol as it would be masked by the already high first peak.
Figures 6 and 7 show the concentrations for each tempera-ture step and protocol for samples A and B. In most cases POC and EC are lower for NIOSH870 compared to EU-SAAR2. Some participants reported limited or no POC for sample A, suggesting that oxygen may have been present in the system during the inert phase. This became less visible for sample B, where concentrations were higher. For sucrose, most participants report the greatest fraction of OC at the first temperature step (OC1) for NIOSH870 and the second
Figure 3. Thermograms of ECOC analysis on PM loaded quartz fibre filter (A sample), by EUSAAR2 for all participants.
(OC2) for EUSAAR2 (Fig. 8). Similarly to filter A, some participants report low or no POC for the sucrose solutions, indicating instrument specific pre-oxidation.
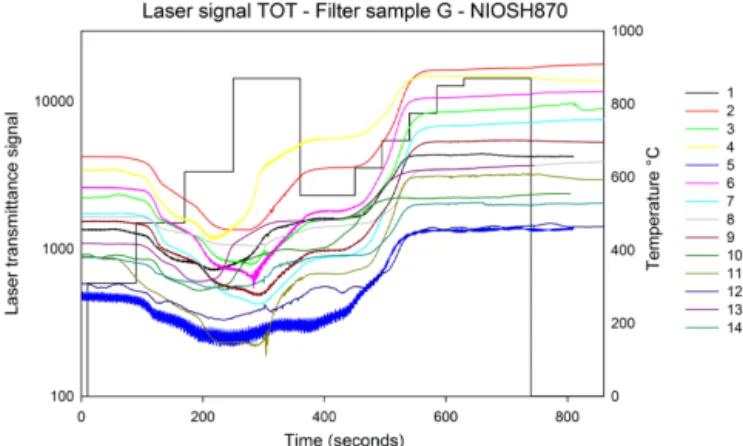
Figures 9–12 show the laser transmittance signal plots for each participant for the analysis of samples A and G for both EUSAAR2 and NIOSH870. A high frequency noise to the laser signal can be observed in all cases for laboratory 5, and non-systematic deviating behaviour for laboratories 4 and 11. Laboratory 12 shows a low frequency noise for all samples. A ramping up of the laser signal before the HeOx phase, indi-cating pre-oxidation, is seen occasionally for several labora-tories, but mostly for 1, 3 and 4. The same ramping effect in the He phase, seen by almost all participants for filter G, indi-cates that in this case the pre-oxidation is not instrument
spe-Figure 4. Thermograms of ECOC analysis on standard sucrose so-lution (S2), by NIOSH870 for all participants.
Figure 5. Thermograms of ECOC analysis on standard sucrose so-lution (S2), by EUSAAR2 for all participants.
cific but sample related. A possible explanation may be the presence of metals and/or metal oxides (Wang et al., 2010). The laser transmittance signal for a blank filter, as derived from the values at the end of each analysis, covers a wide range among the participants, from ∼ 1000 to ∼ 20 000. The respective figures for the laser reflectance signal plots can be found in the Supplement, Figs. S18–S21. However, no ob-servations similar to those for the transmittance signal can be drawn.
A limited number of participants reported data from instru-ment blank analysis. Suppleinstru-ment Figs. S22 and S23 show the laser signal, TOT and TOR results, for EUSAAR2 and NIOSH870 for the blank filters. The laser signal is stable throughout each analysis with the exception of laboratory 3, showing no dependence on the oven temperature.
Figure 6. OC, POC and EC (TOT) concentrations (µg cm−2) per temperature step and protocol for PM loaded quartz fibre filter (sam-ple A).
Figure 7. OC, POC and EC (TOT) concentrations (µg cm−2) per temperature step and protocol for PM loaded quartz fibre filter (sam-ple B).
4 Discussion
Based on z scores for TC, two laboratories showed poor per-formance, reporting results with a significant positive sys-tematic error; seven outliers and two stragglers for labora-tory 10 and ten outliers for laboralabora-tory 11 (Figs. S3, S4). In the course of this work the causes of the observed deviations were identified and corrected. Laboratory 16, which used a semi-automated field analyser, reported two outliers and one straggler, while the rest of participants were within the warning levels. Similar observations can be made for the EC
zscores, with laboratory 10 reporting one outlier and three stragglers, laboratory 11 one outlier and four stragglers, and laboratory 3 one outlier and one straggler. It should be noted that different fit-for-purpose deviations were selected as lev-els of satisfactory performance for TC (8.3 %), which is ther-mally defined, and EC (25 %) which is both therther-mally and optically defined.
Figure 8. OC, POC and EC (TOT) concentrations (µg 10 µL−1) per temperature step and protocol for sucrose solution (S2).
Figure 9. Laser transmittance signal during filter sample A analysis with the use of EUSAAR2 thermal protocol for all laboratories.
As seen in Fig. 1, the analyses of sucrose solutions in com-parison exercises can serve as an indicator of poorly con-ducted TC calibration or unsatisfactory performance. Fur-thermore, it is clear that the repeatability derived from the analysis of a known volume of sucrose solution is depen-dent on the laboratory while independepen-dent of the thermal protocol used. When performed properly, analysis of stan-dard sucrose solutions can provide a reliable TC calibration procedure. Only three participants showed problems in the within-laboratory consistency, and only one in the between-laboratory consistency (Figs. S7, S8).
No clear differences were noticeable between the z scores for EUSAAR2 and NIOSH870, suggesting that poor labora-tory performance or deviating results are not protocol spe-cific. The TC repeatability and reproducibility relative stan-dard deviations, 12 and 15 % for EUSAAR2 and 9 and 12 % for NIOSH870, respectively, were at satisfactory levels, tak-ing into account the homogeneity of similar PM sampled HVS filters that ranged from 6 to 10 %. All TC standard de-viations were found lower for NIOSH870, which may be
ex-Figure 10. Laser transmittance signal during filter sample A analy-sis with the use of NIOSH870 thermal protocol for all laboratories.
Figure 11. Laser transmittance signal during filter sample G analy-sis with the use of EUSAAR2 thermal protocol for all laboratories.
plained by the fact that all TC evolved relatively early dur-ing analysis while a larger fraction remained present in later steps for EUSAAR2. It may have been the case that a small fraction of TC did not evolve with EUSAAR2 for some sam-ples, possibly those more highly loaded, resulting in greater standard deviations. Nevertheless, the findings of the current exercise showed that after the temperature calibration, almost identical concentrations of TC were measured by both pro-tocols, TCNIOSH870=0.98 × TCEUSAAR2(R2=1.00) for
ro-bust means.
The EC repeatability and reproducibility relative standard deviations, 15 and 20 % for EUSAAR2 and 20 and 26 % for NIOSH870, respectively, were greater than the TC ones, in-dicating the additional uncertainties associated with the opti-cal determination of EC. This is supported by the wide range of split points that varied by more than 200 s for the same sample among different participants. The EC standard devi-ations were higher for NIOSH870, probably due to the fact that the split point was located on high sections of FID peaks so deviations of a few seconds would have resulted in rel-atively large changes in the EC amount reported. For
EU-Figure 12. Laser transmittance signal during filter sample G analy-sis with the use of NIOSH870 thermal protocol for all laboratories.
SAAR2, the split point usually fell in less high sections of FID peaks. Furthermore, the wide range of the laser transmit-tance signal value for a blank filter, from ∼ 1000 to ∼ 20 000, may also have affected the capacity of specific instruments to determine the split point accurately. Pre-oxidation resulting in early desorption of POC and EC could also have altered the split point’s position.
Based on robust means, TOT EC reported by NIOSH870 is 20 % lower than by EUSAAR2, ECNIOSH870,TOT=0.80 × ECEUSAAR2,TOT (R2=0.96).
Similar results were found in a comparison performed by GGD Amsterdam, prior to temperature calibration, with ECNIOSH870,TOT=0.83 × ECEUSAAR2,TOT (R2=0.94)
(Fig. S24 in the Supplement). The above suggests that the temperature offset corrections resulted in no particular improvement in the agreement between thermal protocols. However, the selection of a thermal protocol clearly has an influence on EC analysis and should therefore be stated whenever results are reported, for clarity and comparability.
An additional parameter influencing the EC results is the optical method used. As expected, TOR results were higher than TOT for EC, 64 % higher for EUSAAR2 (R2=0.52) and 113 % higher for NIOSH870 (R2=0.44). However, the above values are based on raw data ob-tained by a limited number of participants that reported both TOR and TOT results, 10 out of a total of 17. The EC data from the different protocols also varied when applying TOR but in the opposite sense to TOT. More specifically, TOR EC measured with NIOSH870 re-sulted in higher values by 15 % compared to EUSAAR2, ECNIOSH870,TOR=1.15 × ECEUSAAR2,TOR(R2=0.95).
The stability of the calibration area throughout sequen-tial analysis could serve as an additional indicator of robust-ness of the instrument, since observed deviations are usually caused by gas flow fluctuations, leakages or oven failures. A typical relative standard deviation (% rSD) of the calibration areas reported throughout an analysis run would be below 5 %. Nevertheless, in some cases it was reported to be much
higher, mostly due to the fact that analysis was performed on different analysis days (Table 5). In that case, gas flows were shut down at the end of one day and re-adjusted on the fol-lowing one. It should be noted that gas flows are not strictly defined but have to lie within a suggested range, set manually by the user. The calibration area can also be affected when the calibration gas cylinder is replaced. While the nominal concentration of CH4 in helium is 5 %, deviations are
pos-sible. A verification of the concentration of the calibration gas is recommended using an independent standard such as a sucrose solution, every time a cylinder is replaced.
When the thermograms were compared across partici-pants, patterns in peak distribution were seen for each sam-ple and protocol used. Overlapping peaks were observed for both protocols but these were not investigated in detail since the focus was mainly given to the EC and OC fractions and not the separate temperature step fractions. Peaks evolving systematically earlier or later may relate to an error in the determination of the transit time of the instrument (Figs. 2– 5). Variations in peak distribution may be the result of absent or inaccurate application of the temperature calibration pro-cedure, or even an indication of possible contamination.
Pre-oxidation is another potential cause of peak distribu-tion differences, which can be verified by the POC concentra-tions. Low or zero reported POC during analysis may be an indication of oxygen entering the main oven during analysis in the helium phase (Figs. 6–8). Pre-oxidation was identified more clearly during sucrose solution analysis, when peaks evolving in the oxygen phase were small or non-existent and no or low POC was measured (Figs. 4, 5, 8). A possible cause of pre-oxidation may be traces of oxygen present in the he-lium stream. These can be eliminated by using an in-line oxy-gen trap.
Leakages, loose connections and oxygen in the helium stream are potential causes of pre-oxidation that may result in a constant presence of oxygen in the instrument during the inert phase of analysis and consequently lead to instrument-specific systematic deviations. The same effects may also result from sample and/or filter specific properties such as the presence of metals, metal oxides, oxygen donors or other substances that can catalytically affect pyrolytical processes. An example can be seen for the laser transmittance signal values of filter G, where all participants showed signs of pre-oxidation, which was not the case for the rest of the filters analysed (Figs. 11, 12). The current study gave no indica-tion that the pre-oxidaindica-tion effect is thermal protocol specific. While such comparison exercises can point out instrument specific pre-oxidation, individual users can also identify it through examination of the laser signal during sucrose solu-tions analysis. In this case, the laser signal will systematically ramp up during the He phase, caused by the early desorption of POC from the filter.
When the laser transmittance signal was compared among the participants a wide range in the intensity for a blank filter was noted, varying from ∼ 1000 to ∼ 20 000. However, no
systematic differences were observed in the determination of the split point after comparing weak signals with stronger ones. High or low frequency noise in the laser signal was identified for a few participants, which can cause a shift in the split point definition.
The NIOSH870 heating profile ramps up to 870◦C in 360 s during the helium phase, which appears short and ag-gressive when compared to EUSAAR2, which ramps up to 650◦C in 640 s (Table 2). The POC (TOT) levels were ex-pected to be higher for NIOSH870 after the temperature offset corrections, as observed by Phuah et al. (2009) and Pavlovic et al. (2014). Nevertheless, when POC was com-pared between the two thermal protocols, NIOSH870 re-ported generally lower concentrations than EUSAAR2, even for sucrose solutions (Figs. 6–8). A possible explanation could be that lower temperature steps in the inert phase re-sult in more OC exposed during the highest temperature step of the inert phase, and thus more POC formation (Phuah et al., 2009; Pavlovic et al., 2014). Furthermore, the longer res-idence time of EUSAAR2 on lower temperatures during the inert phase may increase the formation of additional POC compared to NIOSH870.
When the TOT laser signal between the two thermal proto-cols was compared, no clear difference on the lowest (dark-est) point was observed, which is related to POC. This may suggest that not all of the OC was evolved or transformed to POC during the inert phase of EUSAAR2 and some was er-roneously measured as POC and EC in the oxygen phase. For the most part, the observations associated with heating pro-file differences between the two thermal protocols are lim-ited by the number of filters included in the comparison ex-ercise, and further insight would require additional analysis on a wider selection of filters.
EC (TOT) levels were found to be lower for NIOSH870 than for EUSAAR2, explained by the differences in the heat-ing profiles. Considerheat-ing the fact that almost all analysers in this exercise had to correct their higher temperatures af-ter calibration by significant amounts, it would be expected that different EC values would be reported after the tempera-ture offset corrections than before, for the same analyser and sample. The magnitude of this effect would be instrument-specific and can only be evaluated by each user indepen-dently.
5 Conclusions
An ECOC comparison exercise was organized by GGD Am-sterdam involving 17 laboratories. Unlike earlier compari-son exercises, the participants had to perform a temperature calibration and adjust for offsets prior to analysis, for both EUSAAR2 and NIOSH870 thermal protocols. The offsets ranged from −90 to +100◦C, varying for each temperature step and instrument, pointing out the necessity of the temper-ature calibration. The analysis of known volumes of sucrose
solutions as well as PM loaded punches of filters functioned as an efficient indicator of erroneous TC calibration and/or laboratory poor performance. Overall, outliers and deviating results were not related to the thermal protocol used.
Reported TC differed on average by only 2 % be-tween EUSAAR2 and NIOSH870 after the implementa-tion of the temperature calibraimplementa-tion. EC concentraimplementa-tions dif-fered by a similar ratio to ones observed previously, with ECNIOSH870,TOT=0.80 × ECEUSAAR2,TOT(R2=0.96). The
TC repeatability and reproducibility (expressed as relative standard deviations) were found to be higher for EUSAAR2 (11 and 15 %) than for NIOSH870 (9.2 and 12 %). Repeata-bility and reproduciRepeata-bility for EC was found to be lower for EUSAAR2 (15 and 20 %) than for NIOSH870 (20 and 26 %). The formation of POC was found to be higher for EUSAAR2 than for NIOSH870.
Pre-oxidation was identified by low or no POC, or by an increase of the laser signal during the inert phase. Pre-oxidation was either instrument specific, originating from oxygen present in the system during the inert phase, or sample specific, due to metal oxides and/or oxygen donors present on the sample. Thermograms and laser signal plots obtained within the comparison exercise helped to clearly categorize any pre-oxidation event.
Overall, the current comparison exercise findings are two-fold. Firstly, comparison exercises that focus on laboratory performance should be implemented in laboratories’ QA/QC procedures in order to reduce the likelihood of system-atic errors and/or inaccuracies during ECOC analysis. And secondly, additional operational parameters and protocols should be considered for standardization or reporting, in the same way as temperature offset corrections and standardized thermal protocols have been used in the current study. A list of such parameters would include the initial laser value, POC concentration, calibration area stability, FID and laser signal plots. Actions of that kind can improve the consistency of reported EC and TC results, as well as comparability to sur-rogates of EC, such as black carbon and black smoke.
The Supplement related to this article is available online at doi:10.5194/amt-8-779-2015-supplement.
Acknowledgements. The authors would like to thank all lab-oratories who participated in the current comparison exercise for their kind collaboration. They are particularly grateful to the providers of the HVS samples, Christoph Hüglin (EMPA, Switzerland), Kostas Eleftheriadis (Demokritos, Greece), and the department the Air Quality Monitoring Network of Amsterdam. Finally, they would like to thank Sunset Laboratory for provid-ing the temperature calibration kits and supportprovid-ing their application. Edited by: P. Herckes
References
Adar, S. D. and Kaufman, J. D.: Cardiovascular disease and air pol-lutants: Evaluating and improving epidemiological data implicat-ing traffic exposure, Inhal. Toxicol., 19, 135–149, 2007. Baumgardner, D., Popovicheva, O., Allan, J., Bernardoni, V., Cao,
J., Cavalli, F., Cozic, J., Diapouli, E., Eleftheriadis, K., Gen-berg, P. J., Gonzalez, C., Gysel, M., John, A., Kirchstetter, T. W., Kuhlbusch, T. A. J., Laborde, M., Lack, D., Müller, T., Niessner, R., Petzold, A., Piazzalunga, A., Putaud, J. P., Schwarz, J., Sheri-dan, P., Subramanian, R., Swietlicki, E., Valli, G., Vecchi, R., and Viana, M.: Soot reference materials for instrument calibration and intercomparisons: a workshop summary with recommenda-tions, Atmos. Meas. Tech., 5, 1869–1887, doi:10.5194/amt-5-1869-2012, 2012.
Birch, M. E. and Cary, R. A.: Elemental carbon-based method for monitoring occupational exposures to particulate diesel exhaust, Aerosol Sci. Technol., 25, 221–241, 1996.
Cavalli, F., Viana, M., Yttri, K. E., Genberg, J., and Putaud, J.-P.: Toward a standardised thermal-optical protocol for measuring atmospheric organic and elemental carbon: the EUSAAR proto-col, Atmos. Meas. Tech., 3, 79–89, doi:10.5194/amt-3-79-2010, 2010.
Cavalli, F., Douglas, K., and Borowiak, A.: Results of the 2nd com-parison exercise for EU National Quality Reference Laboratories (AQUILA) for TC, OC and EC measurements, Ispra: Joint Re-search Center, 2012.
CEN TR 16243: Guide for the measurement of Elemental Carbon (EC) and Organic Carbon (OC) deposit on filters, Brussels: Eu-ropean Committee for Standardization, 2011.
Cheng, Y., Duan, F. K., He, K. B., Zheng, M., Du, Z. Y., Ma, Y. L., and Tan, J. H.: Intercomparison of thermal–optical methods for the determination of organic and elemental carbon: influences of aerosol composition and implications, Environ. Sci. Technol., 45, 10117–10123, 2011.
Cheng, Y., Duan, F. K., He, K. B., Du, Z. Y., Zheng, M., and Ma, Y., L.: Intercomparison of thermal-optical method with differ-ent temperature protocols: Implications from source samples and solvent extraction, Atmos. Environ., 61, 453–462, 2012. Chow, J. C., Watson, J. G., Chen, L. W. A., Arnott, W. P.,
Moos-müller, H., and Fung, K.: Equivalence of elemental carbon by thermal/optical reflectance and transmittance with different tem-perature protocols, Environ. Sci. Technol., 38, 4414–4422, 2004. Chow, J. C., Watson, J. G., Chen, L.-W. A., Paredes-Miranda, G., Chang, M.-C. O., Trimble, D., Fung, K. K., Zhang, H., and Zhen Yu, J.: Refining temperature measures in thermal/optical carbon analysis, Atmos. Chem. Phys., 5, 2961–2972, doi:10.5194/acp-5-2961-2005, 2005.
Chow, J. C., Watson, J. G., Chen, L. W. A., Chang, M. C. O., Robin-son, N. F., Trimble, D. L., and Kohl, S. D.: The Improve-A tem-perature protocol for thermal/optical carbon analysis: maintain-ing consistency with a long-term database, J. Air Waste Manage. Assoc., 57, 1014–1023, 2007.
Chow, J. C., Watson, J. G., Robles, J., Wang, X. L., Cheng, L. W. A., Trimble, D. L., Kohl, S. D., Tropp, R. J., and Fung, K. K.: Quality assurance and quality control for thermal/optical analy-sis of aerosol samples for organic and elemental carbon, Anal. Bioanal. Chem., 401, 3141–3152, 2011.
Emblico, L., Cavalli, F., Hafkenscheid, T., and Borowiak, A.: Re-sults of the first E/OC comparison exercise for EU National
Air Quality Reference Laboratories (AQUILA), Ispra: Joint Re-search Center, 2012.
Highwood, E. J. and Kinnersley, R. P.: When smoke gets in our eyes: The multiple impacts of atmospheric black carbon on cli-mate, air quality and health, Environ. Int., 32, 560–566, 2006. Hitzenberger, R., Petzold, A., Bauer, H., Ctyroky, P., Pouresmaeil,
P., Laskus, L., and Puxbaum, H.: Intercomparison of thermal and optical measurement methods for elemental carbon and black carbon at an urban location, Environ. Sci. Technol., 40, 6377– 6383, 2006.
IPCC: Climate Change 2007: Impacts, Adaptation and Vulnerabil-ity. Contribution of Working Group II to the Fourth Assessment Report of the Intergovernmental Panel on Climate Change, edited by: Parry, M. L., Canziani, O. F., Palutikof, J. P., van der Linden, P. J., and Hanson, C. E., Cambridge University Press, Cambridge, UK, 976 pp., 2007.
ISO 13528: Statistical methods for use in proficiency testing by inter-laboratory comparisons, ISO, Geneva, 2005.
ISO 5725-2: Accuracy (trueness and precision) of measurement methods and results – Part 2: Basic method for the determination of repeatability and reproducibility of a standard measurement method, ISO, Geneva, 1994.
Jacobson, M. Z.: Strong radiative heating due to the mixing state of black carbon in atmospheric aerosols, Nature, 409, 695–697, 2001.
Janssen, N., Hoek, G., Simic-Lawson, M., Fischer, P., van Bree, L., ten Brink, H., Keuken, M., Atkinson, R., Anderson, H. R., Brunekreef, B., and Cassee, F. R.: Black carbon as an additional indicator of the adverse health effects of airborne particles com-pared with PM10 and PM2.5, Environ. Health Perspect., 119,
1691–1699, 2011.
Janssen, N., Gerlofs-Nijland, M., Lanki, T., Salonen, R., Cassee, F., Hoek, G., Fischer, P., Brunekreef, B., and Krzyzanowski, M.: Health effects of black carbon, Copenhagen, Denmark: WHO, Regional Office for Europe, 2012.
Lena, S. T., Carter, M., Holguin-Veras, J., and Kinney, P. L.: Ele-mental carbon and PM2.5 levels in an urban community heavily impacted by truck traffic, Environ. Health Perspect., 110, 1009– 1015, 2002.
Maenhaut, W., Claeys, M., Vercauteren, J., and Roekens, E.: Com-parison of reflectance and transmission in EC/OC measurements of filter samples from Flanders, Belgium. Abstract Book of the 10th International Conference on Carbonaceous Particles in the Atmosphere (ICCPA), 26–29 June 2011, Vienna, Austria, Ab-stract F-6, 2011.
Panteliadis, P.: EC/OC Interlaboratory comparison measurements. 2009 Report, GGD/LO 09-117, Public Health Service Amster-dam, Department of Air Quality, 2009a.
Panteliadis, P.: EC-OC Measurements: Comparison of reflectance and transmittance techniques, GGD/LO 09-1135, Public Health Service Amsterdam, Department of Air Quality, 2009b. Panteliadis, P.: EC/OC Interlaboratory comparison. 2010 Report,
GGD/LO11-1112, Public Health Service Amsterdam, Depart-ment of Air Quality, 2011.
Panteliadis, P., Strak, M., Hoek, G., Weijers, E., van der Zee, S., and Dijkema, M.: Implementation of a low emission zone and eval-uation of effects on air quality by long-term monitoring, Atmos. Environ., 86, 113–119, 2014.
Pavlovic, J., Kinsey, J. S., and Hays, M. D.: The influence of temper-ature calibration on the OC-EC results from a dual optics thermal carbon analyzer, Atmos. Meas. Tech. Discuss., 7, 3321–3348, doi:10.5194/amtd-7-3321-2014, 2014.
Phuah, C. H., Peterson, M. R., Richards, M. R., Turner, J. H., and Dillner, A. M.: A temperature calibration procedure for the Sun-set Laboratory carbon aerosol analysis lab instrument, Aerosol Sci. Technol., 43, 1013–1021, 2009.
Piazzalunga, A., Bernardoni, V., Fermo, P., Valli, G., and Vec-chi, R.: Technical Note: On the effect of water-soluble com-pounds removal on EC quantification by TOT analysis in ur-ban aerosol samples, Atmos. Chem. Phys., 11, 10193–10203, doi:10.5194/acp-11-10193-2011, 2011.
Qadir, R. M., Abbaszade, G., Schnelle-Kreis, J., Chow, J. C., and Zimmermann, R.: Concentrations and source contributions of particulate organic matter before and after implementation of a low emission zone in Munich, Germany, Environ. Pollut., 175, 158–167, 2013.
Ramanathan, V. and Carmichael, G.: Global and regional climate changes due to black carbon, Nature Geosci., 1, 221–227, 2008. Schauer, J.: Evaluation of elemental carbon as a marker for diesel particulate matter, J. Expo. Sci. Environ. Epidemiol., 13, 443– 453, 2003.
Schauer, J., Mader, B., Deminter, J., Heidemann, G., Bae, M., Se-infeld, H., Flagan, R. C., Cary, R. A., Smith, D., Huebert, B. J., Bertram, T., Howell, S., Kline, J. T., Quinn, P., Bates, T., Turpin, B., Lim, H. J., Yu, J. Z., Yang, H., and Keywood, M.: ACE-Asia intercomparison of a thermal-optical method for the determina-tion of particle-phase organic and elemental carbon, Eviron. Sci. Technol., 37, 993–1001, 2003.
Schmid, H., Laskus, L., Abraham, H. J., Baltensperger, U., La-vanchy, V., Bizjak, M., Burba, P., Cachier, H., Crow, D., Chow, J., Gnauk, T., Even, A., ten Brink, H. M., Giesen, K. P., Hitzen-berger, R., Hueglin, C., Maenhaut, W., Pio, C., Carvalho, A., Putaud, J. P., Toom-Sauntry, D., and Puxbaum, H.: Results of the “carbon conference” international aerosol carbon round robin test stage I, Atmos. Environ., 35, 2111–2121, 2001.
Sciare, J., Cachier, H., Oikonomou, K., Ausset, P., Sarda-Estève, R., and Mihalopoulos, N.: Characterization of carbonaceous aerosols during the MINOS campaign in Crete, July–August 2001: a multi-analytical approach, Atmos. Chem. Phys., 3, 1743– 1757, doi:10.5194/acp-3-1743-2003, 2003.
ten Brink, H., Maenhaut, W., Hitzenberger, R., Gnauk, T., Spindler, G., Even, A., Chi, X., Bauer, H., Puxbaum, H., Putaud J.-P., Tur-sic, J., and Berner, A.: INTERCOMP2000: the comparability of methods in use in Europe for measuring the carbon content of aerosol, Atmos. Environ., 38, 6507–6519, 2004.
Wang, Y., Chung, A., and Paulson, S. E.: The effect of metal salts on quantification of elemental and organic carbon in diesel exhaust particles using thermal-optical evolved gas analysis, Atmos. Chem. Phys., 10, 11447–11457, doi:10.5194/acp-10-11447-2010, 2010.
Watson, J. G., Chow, J. C., and Chen, L. W. A.: Summary of or-ganic and elemental carbon/black carbon analysis methods and intercomparisons, Aerosol Air Qual. Res., 5, 65–102, 2005. Zhi, G. R., Chen, Y. J., Sun, J. Y., Chen, L. G., Tian, W. J., Duan, J.
C., Zhang, G., Chai, F. H., Sheng, G. Y., and Fu, J. M.: Harmoniz-ing aerosol carbon measurements between two conventional ther-mal/optical analysis methods, Environ. Sci. Technol., 7, 2902– 2908, 2011.