HAL Id: hal-02380653
https://hal.archives-ouvertes.fr/hal-02380653
Submitted on 26 Nov 2019
HAL is a multi-disciplinary open access
archive for the deposit and dissemination of
sci-entific research documents, whether they are
pub-lished or not. The documents may come from
teaching and research institutions in France or
abroad, or from public or private research centers.
L’archive ouverte pluridisciplinaire HAL, est
destinée au dépôt et à la diffusion de documents
scientifiques de niveau recherche, publiés ou non,
émanant des établissements d’enseignement et de
recherche français ou étrangers, des laboratoires
publics ou privés.
MAARS: a novel high-content acquisition software for
the analysis of mitotic defects in fission yeast
Tong Li, Hadrien Mary, Marie Grosjean, Jonathan Fouchard, Simon Cabello,
Céline Reyes, Sylvie Tournier, Yannick Gachet
To cite this version:
Tong Li, Hadrien Mary, Marie Grosjean, Jonathan Fouchard, Simon Cabello, et al.. MAARS: a novel
high-content acquisition software for the analysis of mitotic defects in fission yeast. Molecular Biology
of the Cell, American Society for Cell Biology, 2017, �10.1091/mbc.E16-10-0723�. �hal-02380653�
MBoC |
ARTICLE
MAARS: a novel high-content acquisition
software for the analysis of mitotic defects in
fission yeast
ABSTRACT Faithful segregation of chromosomes during cell division relies on multiple processes such as chromosome attachment and correct spindle positioning. Yet mitotic pro-gression is defined by multiple parameters, which need to be quantitatively evaluated. To study the spatiotemporal control of mitotic progression, we developed a high-content analysis (HCA) approach that combines automated fluorescence microscopy with real-time quantitative image analysis and allows the unbiased acquisition of multiparametric data at the single-cell level for hundreds of cells simultaneously. The Mitotic Analysis and Recording System (MAARS) provides automatic and quantitative single-cell analysis of mitotic progres-sion on an open-source platform. It can be used to analyze specific characteristics such as cell shape, cell size, metaphase/anaphase delays, and mitotic abnormalities including spindle mis-positioning, spindle elongation defects, and chromosome segregation defects. Using this HCA approach, we were able to visualize rare and unexpected events of error correction during anaphase in wild-type or mutant cells. Our study illustrates that such an expert system of mitotic progression is able to highlight the complexity of the mechanisms required to prevent chromosome loss during cell division.
INTRODUCTION
The correct partitioning of replicated chromosomes between two daughter cells at each division is essential to prevent genome insta-bility. When this process is perturbed, aneuploid daughter cells (i.e., cells possessing an incorrect chromosome number) are generated. Aneuploidy is a well-known cause of severe genetic diseases, such as Down’s syndrome, and is an almost ubiquitous feature of human cancers (Holland and Cleveland, 2009; Compton, 2011). The two
best-known mechanisms leading to aneuploidy involve chromosome segregation and spindle-positioning defects. Abnormal chromo-some segregation is caused by defects in surveillance mechanisms (spindle assembly checkpoint or Aurora B kinase) or linked to increased centrosome copy number, kinetochore–microtubule attachment errors, or cell-cycle regulation defects (Vitre and Cleve-land, 2012). On the other hand, the control of spindle positioning requires extranuclear players because many cell types orient their spindles according to preexisting polarity cues and use an astral microtubule contact with the cell cortex to position or align the mitotic apparatus (Carminati and Stearns, 1997; Shaw et al., 1997; Adames and Cooper, 2000; Yeh et al., 2000; Gachet et al., 2004; Kozlowski et al., 2007; Kotak and Gonczy, 2013). In addition, chro-mosome segregation, spindle positioning, and cytokinesis must be coordinated to prevent chromosome loss. Thus multiple mitotic pa-rameters contribute to the spatiotemporal control of chromosome partitioning.
Studies in yeast have contributed to our present understanding of the general principles underlying the regulation of chromosome segregation and spindle positioning in dividing cells (Nurse and Thuriaux, 1980; Page and Snyder, 1993; Yanagida, 1998; Segal and
Monitoring Editor Kerry S. Bloom
University of North Carolina Received: Oct 19, 2016 Revised: Mar 14, 2017 Accepted: Apr 20, 2017
This article was published online ahead of print in MBoC in Press (http://www .molbiolcell.org/cgi/doi/10.1091/mbc.E16-10-0723) on April 27, 2017. The authors declare no competing interests.
*Address correspondence to: Sylvie Tournier (sylvie.tournier-gachet@univ-tlse3 .fr), Yannick Gachet (yannick.gachet@univ-tlse3.fr).
© 2017 Li et al. This article is distributed by The American Society for Cell Biology under license from the author(s). Two months after publication it is available to the public under an Attribution–Noncommercial–Share Alike 3.0 Unported Cre-ative Commons License (http://creCre-ativecommons.org/licenses/by-nc-sa/3.0). “ASCB®,” “The American Society for Cell Biology®,” and “Molecular Biology of
the Cell®” are registered trademarks of The American Society for Cell Biology.
Abbreviations used: CFP, cyan fluorescent protein; DAPI, 4’,6-diamidino-2-phe-nylindole; GFP, green fluorescent protein; HCA, high-content analysis; LoG, Laplacian of Gaussian; M phase, mitotic phase; NA, numerical aperture; PBS, phosphate-buffered saline; RFP, red fluorescent protein; ROI, region of interest; SAC, spindle assembly checkpoint; SPB, spindle pole body; W/L, width to length.
Tong Li, Hadrien Mary, Marie Grosjean, Jonathan Fouchard, Simon Cabello, Céline Reyes, Sylvie Tournier*, and Yannick Gachet*
Laboratoire de Biologie Cellulaire et Moléculaire du Controle de la Prolifération, Centre de Biologie Intégrative, Université de Toulouse, CNRS, UPS, 31062 Toulouse Cedex, France
were commercially available (e.g., Operetta High-Content imaging system), as well as open-source tools such as Micropilot (Conrad et al., 2011), the existing software did not meet our requirement in term of flexibility (use of ImageJ collection of plug-ins) or analysis specificity (measurement of chromosome segregation errors). On the concept of basic machine learning method (i.e., decision tree), we developed automated open-source software called the Mitotic Analysis and Recording System (MAARS). MAARS provides auto-matic, multiparametric, and quantitative single-cell analysis of mitotic progression. We tested the robustness of this method on several S. pombe mutants and were able to identify unexpected phenotypes in wild-type and mutant cells. Our study illustrates the impressive benefits of using MAARS to analyze quantitatively mitotic fidelity in eukaryotic cells.
RESULTS
MAARS: an automated, robust, and open-source software for high-content analysis of mitosis
To analyze quantitatively the mechanisms controlling mitotic fidelity, we developed an automated open-source image acquisition and on-the-fly analysis pipeline named MAARS. We first built the con-nection between the computer and the microscope using open-source software called Micro-Manager (Edelstein et al., 2010). In contrast to all available commercial software, Micro-Manager supports multiple microscopy platforms and is compatible with the image-processing package ImageJ. Thus MAARS can also be in-stalled on a variety of wide-field microscopes. MAARS delivers a graphic interface and controls image acquisitions via Micro-Man-ager. With its user-friendly window, it is possible to adjust microscope parameters such as exposure time, frequency of image acquisition, type of color channel, and so on. In addition, specific parameters for mitotic analysis (i.e., size of the spots, type of fluorescent markers) are also selected at this step.
We next implemented an accurate segmentation method to de-tect fission yeast or budding yeast cells (Figure 1 and Supplemental Figures S1 and S2). This segmentation technique is based on a mathematic algorithm (Julou et al., 2013) that requires only bright field with multiple z-section acquisition (∼34 frames) to compute the correlation between cell edges (Supplemental Figure S1B, blue dots) and theoretical cell edges (Supplemental Figure S1B, green curve). Alternative methods consist of marking cell edges (Schmitter et al., 2013) or increasing the contrast between the cell and the background using fluorescent agents (Peng et al., 2013). However, our segmentation technique can be used on nonfluorescent native cell lines with no risk of phototoxicity (Supplemental Figure S1). The cell edges are drawn at the point of high correlation score using Otsu thresholding, as available in ImageJ (Supplemental Figure S1, A–C). Owing to the optimized parallelization described in Materials and Methods, MAARS can perform fast segmentation. The acquisi-tion and segmentaacquisi-tion of a single field of cells with multiple z-sections takes ∼15 s (1100 cells/field; see Materials and Methods).
To prevent the segmentation of false-positive cells, we imple-mented two types of filters—solidity and gray-level filters. The solidity value (area of an object divided by its convex area; Figure 1, bottom) can be adjusted to fit with several cell shapes (round, bent, or long cells). For example, the solidity parameter is 0.84 for S. pombe and 0.5 for Saccharomyces cerevisiae, as shown in Sup-plemental Figure S1E. In addition to this cell shape parameter, we implemented a second filter, called gray intensity filter, based on the pixel intensity of the inner cell on correlation image (see Materials and Methods. The pixel intensity of the cell is compared directly with the intercell space background; Supplemental Figure S1C). In Bloom, 2001). The fission yeast Schizosaccharomyces pombe is a
rod-shaped, symmetrically dividing eukaryote that splits by medial fission. S. pombe possesses three chromosomes (Kohli et al., 1977), which can be tracked by live imaging during mitotic progression (Tournier et al., 2004). In this organism, mitosis is divided into three phases (Nabeshima et al., 1998; Tatebe et al., 2001), and spindle formation begins in M phase, as in higher eukaryotic cells (Russell et al., 1989). During phase 1 (prophase), a short spindle of <2.0 μm is formed, and chromosomes are captured by microtubules at kineto-chores, large protein complexes assembled at the centromeres of each chromosome. Kinetochores begin to align at the spindle cen-ter in phase 1 (Mary et al., 2015). In phase 2 (prometaphase/meta-phase/anaphase A), the spindle maintains roughly the same length, and the kinetochores oscillate between the two spindle pole bodies (SPBs; Mary et al., 2015). At the end of phase 2, sister chromatids separate through the activity of an enzyme called separase, which degrades the cohesin link between sister chromatids, allowing their movement toward the SPBs (anaphase A; Yanagida, 2000). At this stage, it is generally accepted that the abrupt change in the rate of spindle elongation signals the beginning of anaphase B (phase 3; Nabeshima et al., 1998). Finally, during cytokinesis, the actomyosin ring contraction initiates the separation of the two daughter cells (Chang and Nurse, 1993).
Chromosome attachment to the mitotic spindle results from a stochastic search-and-capture process that is intrinsically prone to errors (Kirschner and Mitchison, 1986). In S. pombe, chromosome capture and biorientation successfully occur within minutes before sister chromatid separation (Grishchuk and McIntosh, 2006; Gachet et al., 2008). This process is particularly efficient due to the presence of surveillance mechanisms that prevent chromosome loss (less than one chromosome is lost in 104 divisions). This control is ensured by an error detection and correction system, which involves the Aurora B kinase, a master regulator of cell division (Petersen et al., 2001; Petersen and Hagan, 2003; Sampath et al., 2004; Kotwaliwale et al., 2007; Mora-Bermudez et al., 2007; Steigemann et al., 2009; Tada et al., 2011) and the spindle assembly checkpoint (SAC), which delays anaphase onset in the presence of unattached chromosomes (Rieder et al., 1995; Rudner and Murray, 1996; Cleveland et al., 2003). Aurora B and SAC components operate at the level of kineto-chores, where they promote the stabilization of proper attachment and the destabilization of erroneous ones. Of note, in metaphase, Aurora B destabilizes faulty kinetochore-to-microtubule attach-ments such as merotely (one chromosome attached to both poles) through the phosphorylation of key kinetochore substrates (Tanaka et al., 2002; Cimini et al., 2006). Merotelic attachment is also corrected after anaphase onset through spindle elongation forces (Courtheoux et al., 2009; Gay et al., 2012). Further work also sug-gests that metaphase spindle forces are also important to prevent the appearance of lagging chromosomes in anaphase (Choi and McCollum, 2012).
Quantitative analysis of mitotic fidelity in fission yeast is usually addressed using minichromosome-loss experiments (Niwa, 2016). However, this technique cannot be used to determine the precise cause of chromosome loss, and because the rate of chromosome loss is generally very low, the direct cytological examination of chro-mosome segregation errors using live-cell imaging is not feasible. Thus, to understand fully the mechanisms ensuring the accuracy of mitotic progression, we developed a high-content analysis ap-proach, which combines automated fluorescence microscopy with quantitative image analysis of mitosis. This methodology allows the acquisition of unbiased multiparametric data at the single-cell level for hundreds of cells simultaneously. Although a number of tools
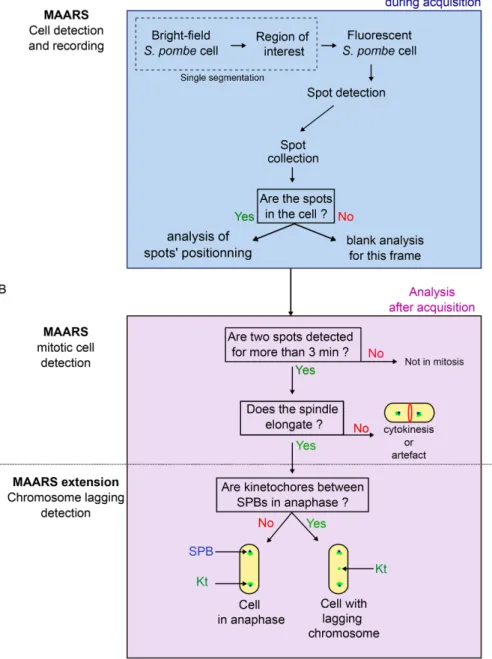
3 min (spindle elongation). In contrast, when the distance between spindle poles remains constant, the cell is judged to be in telo-phase/cytokinesis. MAARS classifies cells in metaphase or anaphase as judged by the spindle elongation rates (Figure 2B and Supplemental Figures S3 and S4). Finally, MAARS identifies whether kinetochores (GFP signals) are detected using a line-scan function drawn between the two poles. If a kinetochore is located between the poles after anaphase onset, it is classified as a lagging kinetochore.
MAARS is very efficient because it can detect ∼100 mitotic cells per field contain-ing ∼1000 unsynchronized cells, and it enables easy retrieval of the films and anal-yses of interest. To test the performance of MAARS software, we performed high- content acquisition of spindle elongation (spindle pole–spindle pole distance), cell shape, spindle orientation/positioning, rate of spindle elongation, and presence of lagging chromosomes in different genetic backgrounds.
Quantitative analysis of spindle elongation and cell shape distribution to identify cell cycle delays
To evaluate MAARS pipeline, we analyzed several S. pombe strains with established cell cycle deficiencies and compared them with wild-type cells. We hypothesized that the distribution of spindle length and cell shape in a population of cells could reveal abnormal cell cycle progression, such as G2 delays or mitotic delays. We chose to measure pole-to-pole distance as an ap-proximation for spindle length because in most situations, spindles are not curved before telophase. S. pombe growth occurs during G2, and the integrity of the genome is controlled at this stage before mitotic entry. In the presence of DNA damage or unreplicated DNA, cells are delayed in G2 and become elongated compared with wild type. Thus cell shape measurement can serve as a good marker to investigate cell cycle defects such as G2 delays. We de-cided to determine the ratio of width to length (W/L) as a charac-teristic of cell shape. Long cells (cells delayed in G2: W/L small) are characterized with a very low ratio of vertical axis to longitudinal axis (Figure 3A). In contrast, short cells (short G2 cells: W/L high) are characterized by a high ratio (Figure 3A). For example, in S. pombe, cell cycle–deficient cells, also known as cdc mutants (Nurse and Thuriaux, 1980), display a G2 cell cycle delay and be-come elongated before entering mitosis compared with wild-type cells (Figure 3A). We also compared spindle size in cdc25-22 mu-tants (Figure 3B, red) versus wild type (Figure 3B, black). MAARS detected two main populations of spindle sizes corresponding to metaphase (maximum peak ∼2–3 mm) and anaphase (maximum peak ∼6–9 mm; Figure 3B). As expected, the size of metaphase spindles in the cdc25-22 mutant was comparable to that in the the absence of filters, MAARS can detect ∼85% of cells per field
(Supplemental Figure S1D). The rejected 15% of cells includes cells located on the edge of the image or overlapping cells. Using proper gray filter intensity and solidity, only 1% of the cells (n = 7434) were false positives (Supplemental Figure S1D).
After segmentation, fluorescent images are automatically ana-lyzed on the fly with MAARS (Figure 2A and Supplemental Figure S3). Cells are illuminated with the appropriate channel, and fluores-cent spots (e.g., spindle poles in cyan fluoresfluores-cent protein [CFP] or kinetochores in green fluorescent protein [GFP]) are detected using TrackMate (Tinevez et al., 2017). MAARS (Kernel in Java) first deter-mines whether the fluorescent spots are within the cell (Figure 2A and Supplemental Figure S3) before analyzing their position (Figure 2B and Supplemental Figure S3). The recognition of mitotic cells is achieved in several postanalysis steps (extension in Python). MAARS detects cells with two spindle poles that move apart for at least
FIGURE 1: The MAARS cell segmentation pipeline. MAARS is a Micro-Manager plug-in that controls the microscope in real time. After acquisition, S. pombe segmentation is performed using a correlation imaging technique based on bright-field images taken at various focal positions. Solidity filters (shape and gray filters) are applied to reduce the detection of false positives during segmentation.
blue and green). Thus alterations in cell shape or spindle size can be easily quanti-fied using MAARS.
Quantitative analysis of spindle orientation and positioning during mitotic progression
The control of spindle positioning according to the cell center during mitosis is important to prevent anucleated cells. During G2, in-terphasic microtubules are required to maintain the nucleus at the cell center (Tran et al., 2001), ensuring correct spindle posi-tioning at the beginning of mitosis. To con-firm the robustness of MAARS pipeline, we analyzed spindle orientation and position-ing durposition-ing mitotic progression in a popula-tion of synchronized cells. A cdc25-22 thermosensitive mutant expressing SPB markers was blocked for 4 h at 36°C (G2 block) and released synchronously into mi-tosis at the permissive temperature of 25°C. Mitotic progression was recorded in fixed cells by following the presence of anaphase cells (4′,6-diamidino-2-phenylindole [DAPI] staining) or septated cells, characteristic of cytokinesis (calcofluor staining; Figure 4A). In parallel, live-cell analysis using MAARS was conducted every 20 min to analyze the distance between SPBs during mitotic progression (Figure 4B). As expected, we observed an increase in spindle length cor-responding to anaphase and telophase cells (Figure 4, B and C). A virtual cell representa-tion shows the average posirepresenta-tion and length of the spindle (pole-to-pole distance) in this synchronized population of cells (Figure 4D). Combining histograms of pole-to-pole dis-tance, orientation, and positioning as a vir-tual cell representation proves once again that our analysis pipeline is powerful. We next performed a similar type of experiment to analyze spindle orientation as a function of spindle length (pole-to-pole distance; Figure 4E). In exponentially growing wild-type or cdc25-22 cells, changes in spindle angle are observed from metaphase to ana-phase onset (from 2 to 5 μm). The angle remains low throughout anaphase B. In contrast and as previously reported, an increased number of cells with misoriented spindles is observed in mal3∆ or mod20∆ cells from the onset to the end of mitosis (Figure 4E). Our data suggest that the MAARS pipeline is sufficiently sensitive and robust to investigate the mechanisms con-trolling spindle positioning in a single- or whole-cell population. Quantitative analysis of spindle elongation during mitotic progression
At the metaphase-to-anaphase transition, an abrupt change in the rate of spindle elongation is observed in fission yeast cells. This change in the slope of the curve can be used as a tool to automati-cally predict the timing of anaphase and analyze the distribution in spindle elongation rates in single-cell analysis (see Materials and wild type, whereas the size of anaphase spindles was larger than
that in the wild type (Figure 3B).
We performed a similar analysis in a mutant deficient in kineto-chore–microtubule attachment (mal3∆; homologue of EB1 in human; Beinhauer et al., 1997) and in a mutant deficient for the nucleation of cytoplasmic microtubules (mod20∆; Sawin et al., 2004). In the absence of Mal3 and Mod20, we expected a metaphase delay (Zimmerman and Chang, 2005; Asakawa et al., 2006). To test this hypothesis, we analyzed the distribution of spindle size in these mutants and found an accumulation of cells with short spindles (∼2–3 μm; Figure 3B, green and blue), suggesting that these proteins were indeed required for normal mitotic progression. In addition, we found that cell shape was modified in these mutants as previously suggested (Beinhauer et al., 1997; Venkatram et al., 2005; Figure 3A,
FIGURE 2: The MAARS pipeline for the multiparametric analysis of mitosis. (A) MAARS pipeline procedure for cell detection and recording. Cell segmentation is performed only once, and fluorescence signal acquisition is repeated over time. (B) MAARS pipeline procedure for the postacquisition analysis of mitosis (spindle elongation, presence of lagging kinetochores).
mutant rad21-K1 (Figure 5B, from −27 to 0 min) as opposed to wild type (Figure 5A, from −15 to 0 min). Our automated analysis also shows some heterogeneity in spindle elongation rates at anaphase, especially in the case of rad21-K1 mutant (Figure 5B, bottom), pos-sibly due to the presence of merotelic attachment, as previously reported (Courtheoux et al., 2009).
Thus MAARS provides an efficient tool to analyze spindle elon-gation and to highlight metaphase delays in individual cells within a population.
Quantitative detection and phenotypic analysis of lagging chromosomes in anaphase
The fidelity of chromosome attachment is ensured by an error de-tection and correction system that operates in metaphase. However, merotelic attachment can also be corrected at anaphase through spindle elongation forces, and the presence of merotelic attach-ment in anaphase antagonizes spindle elongation rate (Courtheoux et al., 2009). Thus simultaneous detection of lagging chromosomes with the analysis of spindle elongation in single cells may provide a valuable tool to predict merotelic attachment and follow its correc-tion in live cells.
A frequency analysis of spindle elongation rate in various mutants revealed the presence of two distinct peaks, one corresponding to prophase/metaphase (Figure 6A) and the second to anaphase cells (Figure 6B). From prophase to metaphase, the average rate of spin-dle elongation was similar between mutants and wild-type cells (∼0.1815 μm/min in wild type; n = 75). In contrast, in anaphase, mod20∆ and rad21-K1 mutants exhibited shifted or non-Gaussian distributions of spindle elongation rates compared with wild type (either lower or higher than wild type), although the average elonga-tion rate was similar to wild type (0.7936 μm/min in wild type, n = 75; 0.7950 μm/min in mod20∆, n = 33; and 0.8241 μm/min in rad21-K1, n = 88). To test whether some of these defects could be attributed to merotelic attachment, we upgraded the MAARS pipeline with a Python extension to automatically detect the presence of lagging kinetochores at anaphase in cells expressing spindle poles and ki-netochore markers (see Materials and Methods and Supplemental Figure S3). The analysis of the films revealed several types of pheno-types. The cohesin mutant rad21-K1 displayed a large number of single, stretched kinetochores during anaphase (Figure 6, C and D; 14.45% ± 4.67; three independent experiments performed for a total number of mitoses of 254; Supplemental Movie S1), coinciding with changes in the rate of spindle elongation (Figure 6E, yellow) com-pared with rad21-K1 cells without lagging kinetochores (Figure 6E, pink). These stretched lagging kinetochores were not observed in wild type (Figure 6F, yellow; n = 187) or mal3∆ cells (Figure 6F, yellow; n = 203) and only occasionally detected in mod20∆ cells (Figure 6F, yellow; 2.02% ± 1.58; three independent experiments performed for a total number of mitoses of 148). In wild-type and mutant cells, we also recorded the presence of unstretched lagging kinetochores (Figure 6F, red; defined as a lagging kinetochore that regain the poles 40 s to 1 min later than other kinetochores). This type of lag-ging kinetochore did not affect the rate of spindle elongation (un-published data). These results prompted us to perform a quantitative analysis of kinetochore segregation in wild-type cells to evaluate the efficiency of correction mechanisms in wild-type background. We ex-tensively filmed wild-type cells (n > 8000) expressing spindle pole and kinetochore markers and identified the presence of two addi-tional types of error correction. In the first type, a pair of kinetochores (as opposed to a single chromatid) separated later than the other pairs but regained the poles soon after (Supplemental Figure S5, a single event in >8000 mitotic cells; and Supplemental Movie S2),
FIGURE 3: Automated analysis of cell shape and pole-to-pole distance distribution in several genetic backgrounds. (A) Normalized density profiles of cell shape in wild-type (black), cdc25-22 (red), mal3∆ (green), and mod20∆ (blue) cells. (B) Normalized density profiles of distance between SPBs in wild-type (black), cdc25-22 (red), mal3∆ (green), and mod20∆ (blue) cells.
Methods and Supplemental Figure S4). With this method, we ana-lyzed quantitatively the rate of spindle elongation in wild-type (Figure 5A) and mutant cells (Figure 5, B–D) expressing Cdc11-cfp (poles) and Ndc80-GFP (kinetochores; Figure 5, top). To automati-cally detect anaphase onset, we initially considered looking at colo-calization of kinetochores and SPB fluorescence. However, this could not accurately detect anaphase onset in cells defective for the poleward movement of kinetochores at anaphase, as previously ob-served in the absence of Dam1 (Gao et al., 2010). We thus chose to use the slope-change method, which requires acquisition of a single fluorescent channel, allowing higher-frequency imaging and less photobleaching. Based on spindle elongation slope changes, the MAARS pipeline automatically detected anaphase onset in single cells (time zero in Figure 5, bottom, corresponds to the onset of anaphase, and all the curves are aligned according to time zero). We checked the robustness of this automatic detection of anaphase by directly visualizing kinetochore dynamics in each film (ndc80-GFP signal in green). We accurately detected anaphase B onset in 81% (n = 75) of analyzed cells. The incorrect detection can be explained by low sample quality (i.e., one SPB moves out of focus during ac-quisition or either metaphase or anaphase length is too short). This quantitative analysis reveals some heterogeneity in metaphase length in mal3∆ (Figure 5C, from −20 to 0 min) and in the cohesin
(https://github.com/bnoi/MAARS/tree/ master/doc/demos), our software is able to record cell division, specifically find mitotic cells, and extract on-the-fly multiple mitotic parameters. Our results demonstrate that MAARS is practical, time-efficient, and robust software for the multiparametric analysis of mitosis. This software provides statistical analysis at the cell population or single-cell level. Within the entire cell popu-lation, MAARS determines the percentage of cells in metaphase, anaphase, or cytoki-nesis and identifies cell size, spindle pole position, and so on. The results are dis-played as a spots distribution, but it is pos-sible to return to the cell image to confirm unexpected results. MAARS can adapt to different cell types (including the budding yeast by adjusting the solidity parameter) and different fluorescent markers (GFP, red fluorescent protein [RFP], or CFP). By simply adjusting the solidity parameter, it is possi-ble to use MAARS for the analysis of cells displaying abnormal cell shapes, such as a pear or T shape. We tested MAARS with long cells (cdc25-22) and short cells (wee1-50; Nurse, 1975) and obtained very similar data qualities, suggesting that our software is insensitive to cell shape variations (un-published data).
In this study, we specifically used MAARS to detect spindle poles and kinetochores, but other types of organelles could be de-tected by simply adjusting MAARS parame-ters such as number, size, or shape of spots. Of importance, MAARS is delivered with the software Micro-Manager and is freely avail-able (Edelstein et al., 2010). By characteriz-ing a population of 10,000 cells within 5 min, MAARS provides statistical significance comparable to flow cytometry combined with a spatiotemporal analysis of mitotic events. MAARS can extract several parame-ters from single cells, such as spindle size, orientation, positioning, and elongation, as well as mitotic phase duration. MAARS was tested in various conditions and challenged with established genetic mutants. Our quantitative single-cell analysis revealed an unexpected heteroge-neity in cell size, spindle elongation rate, and spindle positioning in mal3∆ or mod20∆ mutants, which are defective for cytoplasmic mi-crotubule dynamics. Of importance, most of these differences were not detected when average values were measured. These observa-tions illustrate the strength of using MAARS for quantitative analysis of mitosis as opposed to a classic manual phenotypic analysis.
In addition to these mitotic parameters, MAARS can also detect automatically the presence of unattached kinetochores (kineto-chores that are not present on a line drawn between the two SPBs; unpublished data). This may be extremely useful for studying the mechanisms of kinetochore retrieval in fission yeast (Grishchuk and McIntosh, 2006; Franco et al., 2007; Gachet et al., 2008; Kalinina et al., 2013). Another important defect occurring in mitosis is the suggesting that in some circumstances, cohesin is not degraded
uni-formly on all chromosomes. In the second type, we observed the correction of a missegregated chromatid after anaphase B onset (i.e., the missegregated chromatid eventually moved from the wrong pole to the correct one; Figure 7, A and B, one event for >8000 mitotic cells; Supplemental Movie S3), suggesting that correction of misattachment does not occur only during metaphase.
In conclusion, our study illustrates the power of MAARS software to identify new and rare events of chromosome segregation defects in wild-type or mutant conditions.
DISCUSSION
In this study, we developed an expert system to automatically analyze mitotic progression. As illustrated in the video tutorial
FIGURE 4: Automated analysis of spindle positioning in several genetic backgrounds. (A) Percentage of binucleated cells (blue) and septated cells (red) during cdc25-22 block and release at 25°C. (B) Violin plots of the pole-to-pole distances during cdc25-22 block and release at 25°C. Error bars corresponds to SDs. (C) Representative images of cdc25-22 cells after release at 25°C. The SPBs are in green (Cdc11-GFP), and the nucleus is in red (DAPI). (D) Virtual cell representation showing SPB position in the synchronized population of cdc25-22 cells in A and B. (E) Analysis of spindle angle according to the distance between SPBs in exponentially growing wild-type (black), cdc25-22 (red), mal3∆ (green), and mod20∆ (blue) cells.
two distinct spots. Finally, MAARS automati-cally detects the presence of lagging chro-mosomes, including stretched merotelic attachment during mitotic progression. Me-rotelic attachment is the most frequent error during metaphase in eukaryotic cells. Several studies reported the presence of merotelic attachment in mammalian cells re-leased from nocodazole treatment (Cimini et al., 2004) or in S. pombe cohesin mutants (Gregan et al., 2007; Courtheoux et al., 2009; Rumpf et al., 2010), although this at-tachment defect has not been observed in wild-type conditions. Merotelic attachment leads to intrakinetochore stretching fol-lowed by correction in anaphase through spindle elongation mechanical forces (Cimini et al., 2004; Courtheoux et al., 2009). Of note, the presence of merotelic chromo-somes linearly antagonizes spindle elonga-tion rate, and its correcelonga-tion in anaphase prevents spindle collapse and cell death (Courtheoux et al., 2009). However, quanti-tative analysis of merotelic attachment and its correction in live cells is poorly docu-mented. MAARS provides a tool to under-stand the molecular mechanisms of correction.
Quantitative analysis by MAARS of lagging chromosomes has enabled us to detect rare events of correction during ana-phase in wild-type and mutant conditions. For example, the presence of merotelic at-tachment has never been reported in mod20∆ cells. Similarly, we were also able to visualize rare events of correction of a missegregated kinetochore in late anaphase in wild-type cells, although it is generally admitted that correction only occurs in metaphase or early anaphase. By following single cells during mitotic progression, it will be possible to identify the timing of correc-tion of merotelic attachment. MAARS will thus be a perfect expert system to decipher the mechanisms of merotelic attachment signaling and correction.
With future developments, MAARS soft-ware will deliver high-content information for other mitotic parameters such as kinetochore congression at the metaphase plate or kinet-ochore oscillation (Mary et al., 2015). A com-bination analysis of these parameters will create new insights into of mitosis. For example, because mitosis in fission yeast im-plicates almost 500 proteins, a large-data combinational analysis could unravel new functions for known proteins or assign mitotic functions for unknown proteins. By adapting MAARS’s existing segmentation parameters, we will be able to detect and analyze prokaryotic cell division with either single or multiple chromosomes. In the future, it will even be possible to analyze metazoan mitotic progression using spindle poles appearance of a monopolar spindle, which corresponds to defects
in spindle formation (Vardy and Toda, 2000). MAARS can also detect this type of defect as long as SPBs are duplicated and detected as
FIGURE 5: Automated analysis of spindle elongation and anaphase B onset in several genetic backgrounds. (A) Top, representative single-cell analysis of mitotic progression in a wild-type cell showing the SPBs (red) and the kinetochores (green). Middle, kymograph representation of mitotic progression of the cell shown above. Bottom, profile of spindle elongation in wild-type cells (white; n = 75). Time zero corresponds to anaphase B onset. (B) Top, representative single-cell analysis of mitotic progression in a rad21-K1 mutant showing the SPBs (red) and the kinetochores (green). Middle, kymograph representation of mitotic progression of the cell shown above. Bottom, profile of spindle elongation in rad21-K1 mutant (green; n = 88). Time zero corresponds to anaphase B onset. (C) Top, representative single cell analysis of mitotic progression in a mal3∆ mutant, showing the SPBs (red) and the kinetochores (green). Middle, kymograph representation of mitotic progression of the cell shown above. Bottom, profile of spindle elongation in mal3∆ mutant (blue; n = 92). Time zero corresponds to anaphase B onset. (D) Top, representative single-cell analysis of mitotic progression in a mod20∆ mutant showing SPBs (red) and kinetochores (green). Middle, kymograph representation of mitotic progression of the cell shown above. Bottom, profile of spindle elongation in mod20∆ mutant (red; n = 33). Time zero corresponds to anaphase B onset.
MATERIALS AND METHODS
Cell culture
Media, growth, maintenance of strains, and genetic methods were as reported (Moreno et al., 1991). Cells were grown at 25°C in yeast extract before being mounted on an imaging chamber.
All fluorescently tagged strains (GFP, RFP, and CFP) are integrated at their native chromosomal loci and under the control of their endogenous promoters. The different strains used in this study are listed in Supplemental Table S1.
Cell fixation
To determine the percentage of binucleated and septated cells in cdc25-22 experiments, cells were fixed in 3.7% formaldehyde for 7 min at room temperature, washed once in phosphate-buffered saline (PBS), and ob-served in presence of DAPI/calcofluor. Live-cell imaging
Live-cell microscopy was performed on an imaging chamber (CoverWell PCI-2.5; Grace Bio-Labs) filled with 1 ml of 2% aga-rose in minimal medium and sealed with a 22 × 22 mm glass coverslip. The tempera-ture was maintained at 25°C during acquisi-tions. Images were acquired from an inverted wide-field microscope (Nikon Eclipse TI) equipped with a Neo scientific complementary metal oxide semiconductor camera (2560 × 2160 pixel resolution; Andor Technology), an LED light source (Lumencor Spectra), and either a 60× objective (1.40 numerical aperture [NA]) or a 100x objective (1.45 NA).
Mitotic synchronization
The temperature-sensitive mutant cdc25-22 was synchronized in G2 by incubation at 36°C for 4 h and then released synchro-nously into mitosis by shifting cells at the permissive temperature of 25°C (>80% of cells were in prometaphase).
Description of MAARS software MAARS is a Micro-Manager plug-in de-signed to perform on-the-fly analysis and real-time microscope control or postacquisi-tion analysis. MAARS was written using the Java programming language and uses nu-merous image-processing libraries, includ-ing Fiji (Schindelin et al., 2012), TrackMate (Tinevez et al., 2017), LOCI bioformats (Link-ert et al., 2010), and Micro-Manager (Edel-stein et al., 2010). MAARS is licensed under open-source license BSD (Berkeley Software Distribution License). Documentation and source code are available in a public repository (https://github.com/bnoi/MAARS/releases/tag/v1.0.0). The plug-in as a Jar file can be used in ImageJ. We recommend following and kinetochore markers as long as a suitable segmentation
algo-rithm is implemented. In conclusion, mitosis research will largely ben-efit from a quantitative analysis and an expert system approach to understand the ballet of chromosome dynamics in time and space.
FIGURE 6: Automated detection of lagging kinetochores and merotelic attachment in several genetic backgrounds. (A) Normalized density profiles of spindle elongation speed during metaphase in wild-type (black), rad21-K1 (red), mal3∆ (green), and mod20∆ (blue) cells. (B) Normalized density profiles of spindle elongation speed during anaphase B in wild-type (black), rad21-K1 mutant (red), mal3∆ (green), and mod20∆ (blue) cells. (C) MAARS automatic detection of merotelic kinetochore correction in rad21-K1 cells. Red arrows indicate the position of the merotelic kinetochore. (D) Kymograph representation of the cell shown in C and
schematic representation of the correction of the merotelic kinetochore in anaphase. (E) Multiple spindle elongation profiles observed in rad21-K1 cells (n = 88). Spindle elongation profiles in the absence of merotelic attachment are highlighted in pink, and elongation profiles presenting merotelic attachment in anaphase are highlighted in yellow. Time zero corresponds to anaphase onset. (F) Statistical analysis describing the percentages of lagging kinetochores (red) and merotelic kinetochore attachments (yellow) in different cell lines. Error bars correspond to SDs obtained from three independent experiments.
S. pombe changes from a dark to a bright color at various focal positions. This dark-to-bright intensity variation is very similar to the invert derivative of a Gaussian distribution.
We implemented this method to seg-ment fission yeast cells. This segseg-mentation computes a correlation image from a stack of 34 bright-field images taken with a Z-step of 0.3 μm; 17 images are taken below and the other 17 above the longitudinal axis of the cell. In this three-dimensional stack, ev-ery pixel has X-, Y-, and Z-coordinates. For each stack of pixels having the same X- and Y-coordinates, MAARS determines a corre-lation score between observed and theo-retical Gaussian gray value distributions and provides a correlation image transformed in a binary image. Finally, the Particle Analyzer plug-in from Fiji returns polygonal regions of interest (ROIs) as potential “cells.” Generation of automated ROIs around cells. Previously detected ROIs corresponds to single cells but also to false-positive re-gions (fused cells, intercell space). Before proceeding to mitotic analysis, MAARS rejects unwanted regions based on decision tree filters such as minimum cell size, maxi-mum cell size, ROI solidity, and ROI mean gray value.
Optimized parallelization. Parallelization in MAARS ensures correct acquisition timing and fast computation. One thread is dedi-cated to image acquisition, and other threads are allocated for heavy computation such as segmentation or single-cell analysis. Spot detection. All of the analyses are done in two dimensions after a maximum projection of the stacks. Kinetochore or SPB epitope-tagged strains used in this study appear as bright spots inside cells. MAARS applies a maximum Z-projection of images before spot detection. Then a Laplacian of Gaussian (LoG) detector (from TrackMate Fiji plug-in) detects the spots. To guarantee on-the-fly spot detection with a very low rate of false positives, it is crucial to optimize two parameters: the spot radius and the quality of the spots of interest. Owing to the high variability between biological samples, multiple parameters, including spot intensity, signal/noise ratio, and so on, could vary slightly. Thus users have to test and modify the parameters of spot detection before launching the MAARS analysis process, by using the test button in the Graphical User Interface. These parameters can be adjusted for each experiment to provide high-quality detection for kinetochores and SPBs.
Mitotic cells and phase detection. The spindle is defined by the recognition of the two SPBs in a single cell. Metrics related to the distance between the two SPBs or their position within the cell can precisely the installation instructions (https://github.com/bnoi/
MAARS/blob/master/doc/install_MAARS.md). Several tutorials are also provided (https://github.com/bnoi/MAARS/tree/master/doc/ demos) to illustrate the simplicity and efficiency of MAARS software. Bright-field segmentation. Segmentation of S. pombe was per-formed using a correlation imaging technique based on bright-field images taken at various focal positions, as previously described (Julou et al., 2013). The principle of this correlation imaging technique is that under bright-field illumination, the cell wall of
FIGURE 7: Automated detection of rare events of chromosome segregation defects in wild-type cells. (A) Example of a rare event of segregation defect detected by MAARS in a wild-type cell (n > 8000 mitotic cells filmed). SPBs in red and kinetochores in green. (B) Top, kymograph representation of the cell shown above. Bottom, automated tracking analysis of the cell shown in A. The number of kinetochores at each SPB is indicated for each time point on both sides of the kymograph; zero (yellow), two (purple), three (green), and four (red). Note the presence of four kinetochores at the upper pole and the correction of the defect during anaphase.
Manual annotation. The entire automated detection is not error-free. Thus several semiautomated manual efforts are required. The first type of error is the presence of telophase cells within the ana-lyzed population. Indeed, the two SPBs of cells in telophase can move apart by chance or due to problems of spot detection. Be-cause MAARS saves the cropped images of each cell, the user can get back to the cropped films and reject unwanted telophase cells. Lagging-chromosome detection. MAARS searches for cells with spots (kinetochores) located between the two spindle poles during anaphase. It confirms an event of anaphase chromosome lagging when a kinetochore between SPBs is detected after anaphase B on-set. The corresponding cell appears in a pop-up window at the end of the analysis to allow user confirmation of this event.
be easily calculated (e.g., spindle length, spindle orientation). Because the spindle forms in prophase and elongates to reach cell ends in late anaphase B, we determine in each cell the mitotic pe-riod as the pepe-riod of time between the minimum and maximum spindle length as judged by the distance between the SPBs.
A first step in the detection of mitosis consists of finding cells with at least two fluorescent signals (e.g., presence of two spindle poles inside a ROI for a minimum of 3 min). However, fused cells present-ing a high solidity value can contaminate this detection. Thus a sec-ond step consists of a more precise description of the directed movement of the two spindle poles from prophase to anaphase B (i.e., corresponding to spindle poles moving away from each other during spindle elongation). Although the rate of spindle elongation differs from prophase to anaphase B, we assume that the entire elon-gation process is roughly linear. Building a model of spindle elonga-tion and finding the best parameters for each strain to detect mitosis is not the optimum way to identify every mitotic cell. Indeed, the detection process may ignore mitotic cells with an abnormal fluores-cent signal. In addition, the way in which the spindle elongates may vary from strain to strain. To circumvent this problem, we chose to use a minimum number of parameters to detect mitotic cells by test-ing the linearity of the elongation curves. For this, we segmented spindle elongation trajectories into a region between the minimum distance between the SPBs and the maximum distance between the SPBs. Then, the program applies a line-fit function on the elongation curve and determines its p value. A threshold of p value resulting in fewer mistakes is used to specifically select mitotic cells. In practice, we chose to use a higher threshold than the optimum p value (i.e., 10–11 vs. 10–15) to decrease false-negative detection and accept more false-positive cells, which can be easily eliminated afterward (Supplemental Figure S4). Supplemental Figure S4 shows the total number of errors measured as a function of this threshold.
Virtual cell representation. For the virtual cell representation, the positions of the SPBs are projected into a single virtual cell in order to describe spindle positioning and orientation in a population of cells. However, cells are filmed in random positions, and the coor-dinates of the cell centers are different. It is thus required to per-form both a rotation and a translation of the SPB coordinates. Cell rotation is performed by multiplying all spot coordinates with the corresponding rotation matrix using the angle of the cell major axis. Then cell translation is obtained by subtracting the cell center’s co-ordinates. Thus the reference of each set of cell coordinates is zero. Determination of slope changes during spindle elongation. Slope changes in the rate of spindle elongation can be used to detect prophase or anaphase B onset. It also can be used to detect the presence of merotelic attachment in anaphase because spindle elongation is reduced in their presence. To locate such changes, we analyze spindle elongation in sliding 3-min windows throughout mitotic progression. Anaphase B onset corresponds to the time point having the maximum slope change among those 3-min win-dows. This method can also be used to find prophase onset. How-ever, in mutant cells, especially in the case of the rad21-K1 mutant, for which the slope change at anaphase onset is less brutal, ana-phase B onset is determined with less accuracy (±1 min). In such situations, manually annotating anaphase onset is highly recom-mended before proceeding to further analysis. Once the annotated elongation curves are aligned according to the onset of anaphase, the program calculates spindle elongation rates before or after this time-point (corresponds to pro/metaphase or anaphase cells). The speed in each phase is shown as a mean value.
ACKNOWLEDGMENTS
We thank the S. pombe community for supplying strains, Olivier Gadal (Centre de Biologie Integrative, Toulouse) for supplying a budding yeast strain with SPB markers, Lucie Chadelle for the com-ments on the MAARS tutorial, and Thomas Mangeat and Guillaume Gay (DamCB, Marseille) for helpful discussions. H.M. was supported by the Fondation pour la Recherche Medicale. J.F. and S.C. were supported by the plan Cancer 2009-2013 Systems Biology. This work was funded by Agence Nationale de la Recherche Blanc120601 Chromocatch and the plan Cancer 2009-2013 Systems Biology. Microscopy equipment was funded by the Centre National de la Re-cherche Scientifique, Agence Nationale de la ReRe-cherche Blanc120601 and l’Association de la Recherche sur le Cancer.
REFERENCES
Adames NR, Cooper JA (2000). Microtubule interactions with the cell cortex causing nuclear movements in Saccharomyces cerevisiae. J Cell Biol 149, 863–874.
Asakawa K, Kume K, Kanai M, Goshima T, Miyahara K, Dhut S, Tee WW, Hirata D, Toda T (2006). The V260I mutation in fission yeast alpha-tubulin Atb2 affects microtubule dynamics and EB1-Mal3 localization and activates the Bub1 branch of the spindle checkpoint. Mol Biol Cell 17, 1421–1435.
Beinhauer JD, Hagan IM, Hegemann JH, Fleig U (1997). Mal3, the fission yeast homologue of the human APC-interacting protein EB-1 is required for microtubule integrity and the maintenance of cell form. J Cell Biol 139, 717–728.
Carminati JL, Stearns T (1997). Microtubules orient the mitotic spindle in yeast through dynein-dependent interactions with the cell cortex. J Cell Biol 138, 629–641.
Chang F, Nurse P (1993). Finishing the cell cycle: control of mitosis and cytokinesis in fission yeast. Trends Genet 9, 333–335.
Choi SH, McCollum D (2012). A role for metaphase spindle elongation forces in correction of merotelic kinetochore attachments. Curr Biol 22, 225–230.
Cimini D, Cameron LA, Salmon ED (2004). Anaphase spindle mechanics prevent mis-segregation of merotelically oriented chromosomes. Curr Biol 14, 2149–2155.
Cimini D, Wan X, Hirel CB, Salmon ED (2006). Aurora kinase promotes turnover of kinetochore microtubules to reduce chromosome segregation errors. Curr Biol 16, 1711–1718.
Cleveland DW, Mao Y, Sullivan KF (2003). Centromeres and kinetochores: from epigenetics to mitotic checkpoint signaling. Cell 112, 407–421. Compton DA (2011). Mechanisms of aneuploidy. Curr Opin Cell Biol 23,
109–113.
Conrad C, Wunsche A, Tan TH, Bulkescher J, Sieckmann F, Verissimo F, Edelstein A, Walter T, Liebel U, Pepperkok R, Ellenberg J (2011). Micro-pilot: automation of fluorescence microscopy-based imaging for systems biology. Nat Methods 8, 246–249.
Courtheoux T, Gay G, Gachet Y, Tournier S (2009). Ase1/Prc1-dependent spindle elongation corrects merotely during anaphase in fission yeast. J Cell Biol 187, 399–412.
Edelstein A, Amodaj N, Hoover K, Vale R, Stuurman N (2010). Computer control of microscopes using microManager. Curr Protoc Mol Biol Chapter 14, Unit 14.20.
Franco A, Meadows JC, Millar JB (2007). The Dam1/DASH complex is required for the retrieval of unclustered kinetochores in fission yeast. J Cell Sci 120, 3345–3351.
Gachet Y, Reyes C, Courtheoux T, Goldstone S, Gay G, Serrurier C, Tournier S (2008). Sister kinetochore recapture in fission yeast occurs by two distinct mechanisms, both requiring Dam1 and Klp2. Mol Biol Cell 19, 1646–1662.
Gachet Y, Tournier S, Millar JB, Hyams JS (2004). Mechanism controlling perpendicular alignment of the spindle to the axis of cell division in fission yeast. EMBO J 23, 1289–1300.
Gao Q, Courtheoux T, Gachet Y, Tournier S, He X (2010). A non-ring-like form of the Dam1 complex modulates microtubule dynamics in fission yeast. Proc Natl Acad Sci USA 107, 13330–13335.
Gay G, Courtheoux T, Reyes C, Tournier S, Gachet Y (2012). A stochastic model of kinetochore-microtubule attachment accurately describes fission yeast chromosome segregation. J Cell Biol 196, 757–774. Gregan J, Riedel CG, Pidoux AL, Katou Y, Rumpf C, Schleiffer A, Kearsey
SE, Shirahige K, Allshire RC, Nasmyth K (2007). The kinetochore proteins Pcs1 and Mde4 and heterochromatin are required to prevent merotelic orientation. Curr Biol 17, 1190–1200.
Grishchuk EL, McIntosh JR (2006). Microtubule depolymerization can drive poleward chromosome motion in fission yeast. EMBO J 25, 4888–4896. Holland AJ, Cleveland DW (2009). Boveri revisited: chromosomal
instability, aneuploidy and tumorigenesis. Nat Rev Mol Cell Biol 10, 478–487.
Julou T, Mora T, Guillon L, Croquette V, Schalk IJ, Bensimon D, Desprat N (2013). Cell-cell contacts confine public goods diffusion inside Pseudo-monas aeruginosa clonal microcolonies. Proc Natl Acad Sci USA 110, 12577–12582.
Kalinina I, Nandi A, Delivani P, Chacon MR, Klemm AH, Ramunno-Johnson D, Krull A, Lindner B, Pavin N, Tolic-Norrelykke IM (2013). Pivoting of microtubules around the spindle pole accelerates kinetochore capture. Nat Cell Biol 15, 82–87.
Kirschner M, Mitchison T (1986). Beyond self-assembly: from microtubules to morphogenesis. Cell 45, 329–342.
Kohli J, Hottinger H, Munz P, Strauss A, Thuriaux P (1977). Genetic mapping in Schizosaccharomyces pombe by mitotic and meiotic analysis and induced haploidization. Genetics 87, 471–489.
Kotak S, Gonczy P (2013). Mechanisms of spindle positioning: cortical force generators in the limelight. Curr Opin Cell Biol 25, 741–748.
Kotwaliwale CV, Frei SB, Stern BM, Biggins S (2007). A pathway containing the Ipl1/aurora protein kinase and the spindle midzone protein Ase1 regulates yeast spindle assembly. Dev Cell 13, 433–445.
Kozlowski C, Srayko M, Nedelec F (2007). Cortical microtubule contacts position the spindle in C. elegans embryos. Cell 129, 499–510. Linkert M, Rueden CT, Allan C, Burel JM, Moore W, Patterson A, Loranger
B, Moore J, Neves C, Macdonald D, et al. (2010). Metadata matters: access to image data in the real world. J Cell Biol 189, 777–782. Mary H, Fouchard J, Gay G, Reyes C, Gauthier T, Gruget C, Pecreaux J,
Tournier S, Gachet Y (2015). Fission yeast Kinesin-8 controls chromosome congression independently of oscillations. J Cell Sci 128, 3720–3730. Mora-Bermudez F, Gerlich D, Ellenberg J (2007). Maximal chromosome compaction occurs by axial shortening in anaphase and depends on Aurora kinase. Nat Cell Biol 9, 822–831.
Moreno S, Klar A, Nurse P (1991). Molecular genetic analysis of fission yeast Schizosaccharomyces pombe. Methods Enzymol 194, 795–823. Nabeshima K, Nakagawa T, Straight AF, Murray A, Chikashige Y, Yamashita
YM, Hiraoka Y, Yanagida M (1998). Dynamics of centromeres during metaphase-anaphase transition in fission yeast: Dis1 is implicated in force balance in metaphase bipolar spindle. Mol Biol Cell 9, 3211– 3225.
Niwa O (2016). Determination of the frequency of minichromosome loss to assess chromosome stability in fission yeast. Cold Spring Harb Protoc 2016(Jun 24), doi: 10.1101/pdb.prot091991.
Nurse P (1975). Genetic control of cell size at cell division in yeast. Nature 256, 547–551.
Nurse P, Thuriaux P (1980). Regulatory genes controlling mitosis in the fission yeast Schizosaccharomyces pombe. Genetics 96, 627–637. Page BD, Snyder M (1993). Chromosome segregation in yeast. Annu Rev
Microbiol 47, 231–261.
Peng JY, Chen YJ, Green MD, Sabatinos SA, Forsburg SL, Hsu CN (2013). PombeX: robust cell segmentation for fission yeast transillumination images. PLoS One 8, e81434.
Petersen J, Hagan IM (2003). S. pombe aurora kinase/survivin is required for chromosome condensation and the spindle checkpoint attachment response. Curr Biol 13, 590–597.
Petersen J, Paris J, Willer M, Philippe M, Hagan IM (2001). The S. pombe aurora-related kinase Ark1 associates with mitotic structures in a stage dependent manner and is required for chromosome segregation. J Cell Sci 114, 4371–4384.
Rieder CL, Cole RW, Khodjakov A, Sluder G (1995). The checkpoint delay-ing anaphase in response to chromosome monoorientation is mediated by an inhibitory signal produced by unattached kinetochores. J Cell Biol 130, 941–948.
Rudner AD, Murray AW (1996). The spindle assembly checkpoint. Curr Opin Cell Biol 8, 773–780.
Rumpf C, Cipak L, Schleiffer A, Pidoux A, Mechtler K, Tolic-Norrelykke IM, Gregan J (2010). Laser microsurgery provides evidence for merotelic kinetochore attachments in fission yeast cells lacking Pcs1 or Clr4. Cell Cycle 9, 3997–4004.
Russell P, Moreno S, Reed SI (1989). Conservation of mitotic controls in fission and budding yeasts. Cell 57, 295–303.
Sampath SC, Ohi R, Leismann O, Salic A, Pozniakovski A, Funabiki H (2004). The chromosomal passenger complex is required for chromatin- induced microtubule stabilization and spindle assembly. Cell 118, 187–202. Sawin KE, Lourenco PC, Snaith HA (2004). Microtubule nucleation at
non-spindle pole body microtubule-organizing centers requires fission yeast centrosomin-related protein mod20p. Curr Biol 14, 763–775.
Schindelin J, Arganda-Carreras I, Frise E, Kaynig V, Longair M, Pietzsch T, Preibisch S, Rueden C, Saalfeld S, Schmid B, et al. (2012). Fiji: an open-source platform for biological-image analysis. Nat Methods 9, 676–682. Schmitter D, Wachowicz P, Sage D, Chasapi A, Xenarios I, Simanis , Unser
M (2013). A 2D/3D image analysis system to track fluorescently labeled structures in rod-shaped cells: application to measure spindle pole asymmetry during mitosis. Cell Div 8, 6.
Segal M, Bloom K (2001). Control of spindle polarity and orientation in Saccharomyces cerevisiae. Trends Cell Biol 11, 160–166.
Shaw SL, Yeh E, Maddox P, Salmon ED, Bloom K (1997). Astral microtubule dynamics in yeast: a microtubule-based searching mechanism for spindle orientation and nuclear migration into the bud. J Cell Biol 139, 985–994. Steigemann P, Wurzenberger C, Schmitz MH, Held M, Guizetti J, Maar S,
Gerlich DW (2009). Aurora B-mediated abscission checkpoint protects against tetraploidization. Cell 136, 473–484.
Tada K, Susumu H, Sakuno T, Watanabe Y (2011). Condensin association with histone H2A shapes mitotic chromosomes. Nature 474, 477–483. Tanaka TU, Rachidi N, Janke C, Pereira G, Galova M, Schiebel E, Stark MJ,
Nasmyth K (2002). Evidence that the Ipl1-Sli15 (Aurora kinase-INCENP) complex promotes chromosome bi-orientation by altering kinetochore-spindle pole connections. Cell 108, 317–329.
Tatebe H, Goshima G, Takeda K, Nakagawa T, Kinoshita K, Yanagida M (2001). Fission yeast living mitosis visualized by GFP-tagged gene products. Micron 32, 67–74.
Tinevez JY, Perry N, Schindelin J, Hoopes GM, Reynolds GD, Laplantine E, Bednarek SY, Shorte SL, Eliceiri KW (2017). TrackMate: an open and extensible platform for single-particle tracking. Methods 115, 80–90. Tournier S, Gachet Y, Buck V, Hyams JS, Millar JB (2004). Disruption of astral
microtubule contact with the cell cortex activates a Bub1, Bub3, and Mad3-dependent checkpoint in fission yeast. Mol Biol Cell 15, 3345–3356. Tran PT, Marsh L, Doye V, Inoue S, Chang F (2001). A mechanism for nuclear
positioning in fission yeast based on microtubule pushing. J Cell Biol 153, 397–411.
Vardy L, Toda T (2000). The fission yeast gamma-tubulin complex is required in G(1) phase and is a component of the spindle assembly checkpoint. EMBO J 19, 6098–6111.
Venkatram S, Jennings JL, Link A, Gould KL (2005). Mto2p, a novel fission yeast protein required for cytoplasmic microtubule organization and anchoring of the cytokinetic actin ring. Mol Biol Cell 16, 3052–3063. Vitre BD, Cleveland DW (2012). Centrosomes, chromosome instability (CIN)
and aneuploidy. Curr Opin Cell Biol 24, 809–815.
Yanagida M (1998). Fission yeast cut mutations revisited: control of anaphase. Trends Cell Biol 8, 144–149.
Yanagida M (2000). Cell cycle mechanisms of sister chromatid separation; roles of Cut1/separin and Cut2/securin. Genes Cells 5, 1–8.
Yeh E, Yang C, Chin E, Maddox P, Salmon ED, Lew DJ, Bloom K (2000). Dynamic positioning of mitotic spindles in yeast: role of microtubule motors and cortical determinants. Mol Biol Cell 11, 3949–3961. Zimmerman S, Chang F (2005). Effects of {gamma}-tubulin complex proteins
on microtubule nucleation and catastrophe in fission yeast. Mol Biol Cell 16, 2719–2733.