Publisher’s version / Version de l'éditeur:
Vous avez des questions? Nous pouvons vous aider. Pour communiquer directement avec un auteur, consultez la première page de la revue dans laquelle son article a été publié afin de trouver ses coordonnées. Si vous n’arrivez pas à les repérer, communiquez avec nous à [email protected].
Questions? Contact the NRC Publications Archive team at
[email protected]. If you wish to email the authors directly, please see the first page of the publication for their contact information.
https://publications-cnrc.canada.ca/fra/droits
L’accès à ce site Web et l’utilisation de son contenu sont assujettis aux conditions présentées dans le site LISEZ CES CONDITIONS ATTENTIVEMENT AVANT D’UTILISER CE SITE WEB.
Inter-Noise 2009 [Proceedings], pp. 1-10, 2009-08-24
READ THESE TERMS AND CONDITIONS CAREFULLY BEFORE USING THIS WEBSITE. https://nrc-publications.canada.ca/eng/copyright
NRC Publications Archive Record / Notice des Archives des publications du CNRC :
https://nrc-publications.canada.ca/eng/view/object/?id=b93574b0-c1a6-4fe1-8cd1-f4cf41954c3c https://publications-cnrc.canada.ca/fra/voir/objet/?id=b93574b0-c1a6-4fe1-8cd1-f4cf41954c3c
NRC Publications Archive
Archives des publications du CNRC
This publication could be one of several versions: author’s original, accepted manuscript or the publisher’s version. / La version de cette publication peut être l’une des suivantes : la version prépublication de l’auteur, la version acceptée du manuscrit ou la version de l’éditeur.
Access and use of this website and the material on it are subject to the Terms and Conditions set forth at
Using SPMSoft to assess speech privacy in open-plan offices
http://www.nrc-cnrc.gc.ca/irc
U sing SPM Soft t o a sse ss spe e c h priva c y in ope n-pla n offic e s
N R C C - 5 1 3 2 8
B r a d l e y , J . S .
A u g u s t 2 0 0 9
A version of this document is published in / Une version de ce document se trouve dans:
Inter-Noise 2009, Ottawa, Ontario, August 24-26, 2009, pp. 1-10
The material in this document is covered by the provisions of the Copyright Act, by Canadian laws, policies, regulations and international agreements. Such provisions serve to identify the information source and, in specific instances, to prohibit reproduction of materials without written permission. For more information visit http://laws.justice.gc.ca/en/showtdm/cs/C-42
Les renseignements dans ce document sont protégés par la Loi sur le droit d'auteur, par les lois, les politiques et les règlements du Canada et des accords internationaux. Ces dispositions permettent d'identifier la source de l'information et, dans certains cas, d'interdire la copie de documents sans permission écrite. Pour obtenir de plus amples renseignements : http://lois.justice.gc.ca/fr/showtdm/cs/C-42
Ottawa, Canada
INTER-NOISE 2009
2009 August 23-26
Using SPMSoft to assess speech privacy in open-plan offices
John S Bradley1
National Research Council 1200 Montreal Rd
Ottawa, K1A 0R6, Canada
ABSTRACT
SPMSoft is new software to enable convenient measurements of speech privacy in open-plan offices. By using impulse response techniques to assess the attenuation between locations in offices, speech privacy can be measured during normal occupied conditions with little disturbance to the occupants. Values of speech privacy measures such as the Articulation Index are obtained while at each location in the office to make possible more efficient investigations of acoustical problems. The relative importance of the primary ceiling reflection and the initial diffracted path are identified on the measured impulse response. The cause of problems can be diagnosed from the relative importance of these two key sound paths along with the measured ambient noise level. This paper describes the new software and gives results of measurements in a number of open-plan offices. Example measurements show the effects of ceiling absorption and panel height as well as furniture arrangements. Privacy measurements can be obtained between adjacent workstations or over larger distances, without loud test sounds, by using synchronous averaging with impulse response measurements.
1. THE NEED FOR SPEEECH PRIVACY MEASUREMENT SOFTWARE
For a successful open-plan office design we should aim for ‘normal’ privacy corresponding to Articulation Index1 (AI) ≤ 0.15 and with an ambient noise level of approximately 45 dBA2-4. This can only be achieved by careful attention to all important design details. If any key design parameters are ignored, AI ≤ 0.15 will not be reached, and the office will not be a success. To ensure that changes systematically improve speech privacy, it is helpful to have objective measurements to give unbiased assessments of conditions. However, conventional measurements of speech privacy are quite time consuming and typically require after hours measurements of sound attenuation between workstations along with daytime ambient noise measurements and later calculations of speech privacy measures. The new SPMSoft program was intended to solve these problems and makes in situ results conveniently possible.
2. THE SPMSoft MEASUREMENT SOFTWARE
SPMSoft is new speech privacy measurement software that can measure privacy in offices during occupied conditions without unduly disturbing the occupants. The attenuation of sound between locations in an office is determined from impulse response measurements using moderate level signals and synchronous averaging. Daytime ambient noise levels can also be measured and speech privacy measures calculated in situ at each measurement location. SPMSoft calculates values of the Articulation Index (AI)1, the Speech Intelligibility Index (SII)5, the Speech Transmission Index (STI)6 and the A-weighted signal-to-noise ratio (SNR(A)). The
1
user sees immediately how close the measured conditions are to the goals of AI ≤ 0.15 and an ambient noise level of 45 dBA.
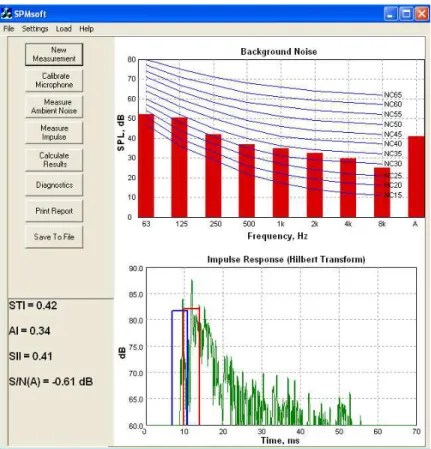
The program displays the envelope of the measured impulse response and the spectrum of the measured ambient noise as illustrated in Fig. 1 that shows the main screen of the software. These displays give the user the key information required to diagnose the cause of acoustical problems. Although many sound paths contribute to the levels of unwanted speech, the two most important paths are usually the initial ceiling reflection and the initial screen diffracted path (whereby speech sound diffracts over the separating partial height panel). After the user enters the dimensions of the workstations, including ceiling and panel heights, the program indicates the components of the impulse response that are due to the sound arriving by the initial ceiling reflection path and via the initial panel diffraction path (red and blue boxes respectively in the lower graph on Fig. 1). The relative heights of these two components of the impulse response relate to the relative importance of increasing either the panel height or the ceiling absorption for improving speech privacy.
Fig. 1 SPMSoft main measurement screen including measured ambient noise spectrum displayed in octave bands (upper) and the measured impulse response envelope with the blue and red boxes identifying the initial diffracted
path sound and the initial ceiling reflection respectively (lower).
An ambient noise level of close to 45 dBA is an optimum compromise between being too loud and disturbing and too quiet and not masking unwanted speech sounds2-4. It is typical of ventilation system noise levels found in many offices. Privacy measures can be recalculated with a more ideal ambient noise spectrum, than that measured, to explore the importance of changes to ambient noise levels. From the impulse response display and ambient noise level effects, the user gets an immediate indication of the relative importance to improved speech privacy of improvements to the key parameters: panel height, ceiling absorption and ambient noise levels.
3. THE SOFTWARE OPERATION
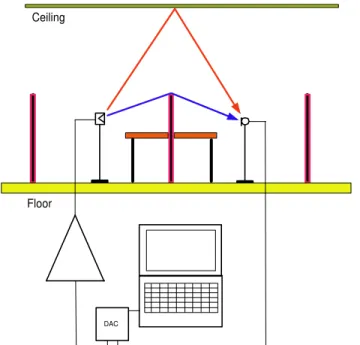
SPMSoft combines sophisticated processing techniques with a simple, and easy-to-use interface to make the measurement of acoustical conditions in open-plan offices as convenient as possible. Fig. 2 illustrates a typical measurement setup and a block diagram of the external hardware required. A portable computer is connected to an external sound card (DAC). The program outputs sine-sweep test signals via the sound card and power amplifier to a small loudspeaker located in one workstation. A calibrated measurement microphone is located in the adjacent workstation and connected to the computer via the external sound card.
Ceiling
Floor
DAC
Fig. 2. Illustration of typical measurement setup showing a section through a pair of adjacent workstations.
The steps necessary to make a measurement are described with reference to the main screen shown in Fig. 1. The user simply proceeds from top to bottom through the 8 buttons at the upper left of the screen. Information for a new measurement is entered using the first button and the microphone is calibrated with the second button. New measurement information includes the required number of repeats of the test signal and the speech source spectrum to be used in
calculations, which should be representative of voice levels in open-plan offices2-4.
The third button starts the measurement of ambient noise levels. The measurement duration is set as part of the new measurement information. Although the ambient noise is measured in 1/3-octave bands, it is displayed in octave bands in the upper half of the screen (see Fig. 1) where the values are displayed over a user-selected set of reference contours. The user can alternatively use a pre-selected reference noise spectrum in the calculations.
The next button starts the process of measuring the impulse response between the source and the receiver locations. A sine sweep signal with a pink spectrum is output and can be repeated up to 99 times. From the captured response, the impulse response is calculated. The envelope of the first 70 ms of the impulse response is displayed in the lower half of the screen as shown in Fig. 1.
Pressing ‘Calculate Results’ determines values of AI, SII, STI and SNR(A), which are displayed at the lower left of the screen. The ‘Diagnostics’ button allows the user to enter the dimensions of two adjacent workstations so that the program can determine the expected arrival times of the initial ceiling reflection and the initial panel diffracted sound. These are then indicated by the red and blue boxes respectively on the impulse response plot as in Fig. 1. The final button saves the measured impulse response and separately saves all other values to a csv
format file for access by spreadsheet software. Previous impulse response measurements can be re-processed using different ambient noise data.
Before any measurements can be made in an office, the user must first measure the output test signal at a distance of 1 m in free field conditions. This can be done in a large room by including time windowing to eliminate reflected sounds for this reference measurement. SPMSoft is available for download7 and is described more fully in8-10.
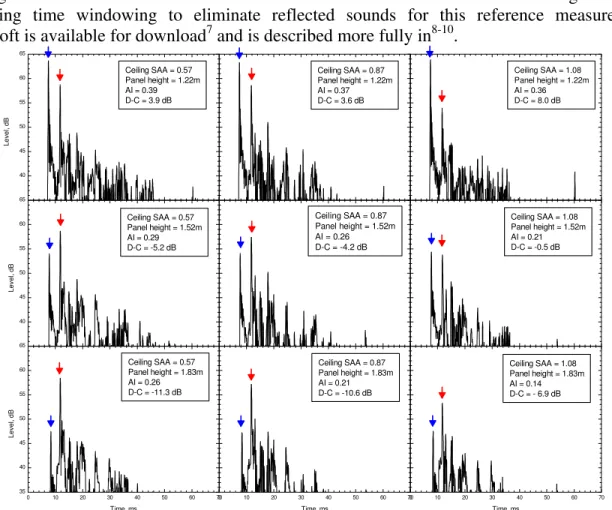
40 45 50 55 60 65 Ceiling SAA = 0.57 Panel height = 1.22m AI = 0.39 D-C = 3.9 dB Le vel , d B Ceiling SAA = 0.87 Panel height = 1.22m AI = 0.37 D-C = 3.6 dB Ceiling SAA = 1.08 Panel height = 1.22m AI = 0.36 D-C = 8.0 dB 40 45 50 55 60 65 Ceiling SAA = 0.57 Panel height = 1.52m AI = 0.29 D-C = -5.2 dB Lev el , d B Ceiling SAA = 0.87 Panel height = 1.52m AI = 0.26 D-C = -4.2 dB Ceiling SAA = 1.08 Panel height = 1.52m AI = 0.21 D-C = -0.5 dB 0 10 20 30 40 50 60 70 35 40 45 50 55 60 65 Ceiling SAA = 0.57 Panel height = 1.83m AI = 0.26 D-C = -11.3 dB Le vel , d B Time, ms 0 10 20 30 40 50 60 70 Ceiling SAA = 0.87 Panel height = 1.83m AI = 0.21 D-C = -10.6 dB Ceiling SAA = 1.08 Panel height = 1.83m AI = 0.14 D-C = - 6.9 dB Time, ms 0 10 20 30 40 50 60 70 Time, ms
Fig. 3. Measured impulse response envelope plots for varied initial diffracted sound (blue arrow) and initial ceiling reflection (red arrow). Increasing ceiling absorption, SAA, from left to right; increasing panel height top to bottom. Fig. 3 is intended to help the user interpret the measured impulse responses. It shows 9 impulse responses measured between adjacent workstations for which ceiling absorption and separating panel height were systematically varied. In going from left to right among the 9 plots, the ceiling absorption is increasing, corresponding to the Sound Absorption Average (SAA) of the ceiling increasing from 0.57, to 0.87 and then to 1.07. Because of this, the initial ceiling reflection peak indicated by the second (red) arrow, decreases with increasing ceiling absorption (SAA). Moving from top to bottom on this figure corresponds to increasing separating panel height, which varied from 1.22m to 1.52m and then to 1.83m. The height of the initial pulse under the first (blue) arrow systematically decreases in going from top to bottom due to the corresponding increase in separating panel height. These examples should help the user to interpret these two key features of measured impulse responses in open-plan offices.
4. MEASUREMENT EXAMPLES9
A. Ceiling Absorption
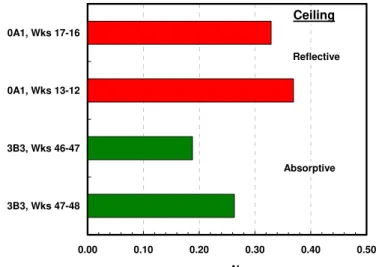
Fig. 4 illustrates measured AI values between pairs of adjacent workstations in two different offices. Both had similar workstation panels, which were 1.59 m high. The AI values were calculated using the same ideal ambient noise spectrum for both offices. However, office 0A1
had a higher (3.76 m) and more sound reflective ceiling (painted gypsum board), while office 3B3 had a lower (2.54 m high) ceiling with 19 mm thick glass fibre tile. Not surprisingly there was substantially better privacy between adjacent workstations in the office with the more absorptive ceiling. 0.00 0.10 0.20 0.30 0.40 0.50 3B3, Wks 47-48 3B3, Wks 46-47 0A1, Wks 13-12 0A1, Wks 17-16 AI Ceiling Reflective Absorptive
Fig. 4 AI values measured between adjacent pairs of workstations with exactly the same ambient noise in office 0A1 with a higher sound reflective ceilings and office 3B3 with lower height and more absorptive ceiling.
0.00 0.10 0.20 0.30 0.40 0 2 4 6 8 10 12 14 16 18 Source-Receiver Distance, m AI 0A1 0A1 3B3 3B32
Fig. 5 AI values measured from one workstation to other workstations, increasingly more distant from the source, in rows of workstations in office 0A1 with a reflective ceiling and in office 3B3 with a more absorptive ceiling.
The benefit of the more absorptive ceiling extends much beyond the adjacent workstation. Fig. 5 shows how AI values vary with distance in these same two offices. In office 3B3 with the more absorptive ceiling, AI values were close to zero at the second workstation away from the source. In office 0A1 with the reflective ceiling, one must be 4 or 5 workstations away from the source workstation to get similarly high privacy. Plots such as Fig. 5 can be used to more generally characterise conditions in a particular office but can miss the often significant effects of the details of individual workstations.
B. Separating Panel Height
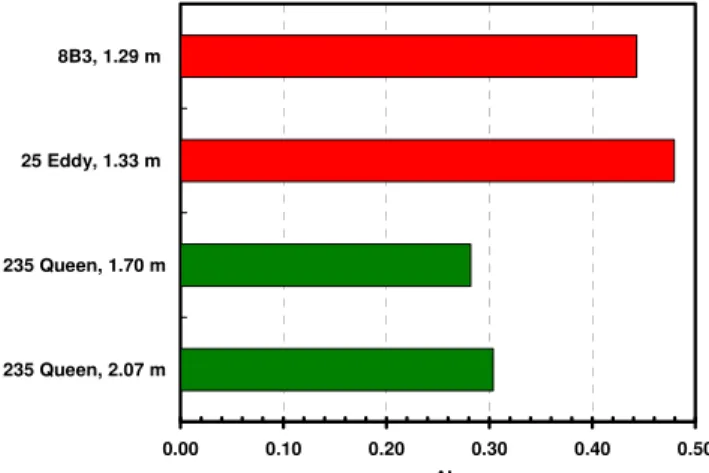
Workstation panels must be high enough to block direct sound propagation and be a substantial barrier to unwanted speech sounds (STC ≥ 20) as well as have sound absorptive surfaces. Figure 6 compares AI values for measurements of speech privacy between adjacent workstation pairs. Two of the cases (offices 8B3 and 25 Eddy) had relatively low separating panels with heights of 1.29 and 1.33 m. The others had quite high separating panels with panel heights of 1.70 and 2.07
m. As would be expected, the higher panels provided better speech privacy with significantly lower AI values when determined using exactly the same 1/3-octave band ambient noise spectra. The combined effects of various panel heights and ceiling absorptions are described more completely by the example impulse response plots for 9 combinations of panel height and ceiling absorption in Fig 1. 0.00 0.10 0.20 0.30 0.40 0.50 235 Queen, 2.07 m 235 Queen, 1.70 m 25 Eddy, 1.33 m 8B3, 1.29 m AI
Fig. 6 Illustration of the effects of separating panel height, calculated with the same optimum ambient noise. Offices 8B3 and 25 Eddy, 1.29 and 1.33 m panel heights; office 255 Queen, 1.70 m and 2.07 m panel heights.
C. Window Reflections
Windows adjacent to one side of a workstation can reflect significant amounts of sound into the next workstation. Fig. 7 illustrates the average effect of such reflections in one office. The office consisted of rows of rectangular workstations parallel to a wall of windows. One row of workstations was immediately adjacent to the windows. Subsequent rows were parallel to but increasingly more distant from the windows. In Fig. 7 the average AI value for workstation pairs immediately adjacent to windows was more than 0.1 greater than for those workstation pairs without reflections from windows. Because it is usually difficult to reduce such reflections, it is often not possible to achieve high privacy for workstations near windows.
0.00 0.10 0.20 0.30 0.40 0.50 3B3, Wks 54-60 3B3, Wks 52-46 3B3, Wks 39-45 AI No windows Near windows
Fig. 7 Comparisons of average AI values measured between 6 adjacent pairs of workstations in the same office. Workstations 54-60 were adjacent to the windows, workstations 39-45 and 52-46 were not adjacent to windows.
Figures 8a and 8b illustrate how the program can be used to identify that a peak in the impulse response envelope is due to a window reflection. These two figures illustrate the result of measurements between the same two points. However, in Fig. 8b the source was pointed at a 45-degree angle towards the windows to increase the amplitude of the window reflection. In this case, the window reflection only had a small effect on AI values because of the large amounted of reflected sound from other parts of the office.
0 10 20 30 40 50 60 70 20 30 40 50 (b) 450 to window Lev el, d B Time, ms 20 30 40 50 Le ve l, d B
(a) Parallel to window
Fig. 8 Impulse response measurement for a workstation pair adjacent to a window. Lower plot (b) shows increased amplitude for window reflection due to loudspeaker orientation. Blue arrow, initial diffracted sound; red arrow,
initial ceiling reflection; purple arrow, window reflection.
D. Effects of Furniture Arrangement
After measuring AI values between a large number of adjacent pairs of workstations in one office, it was noticed that the furniture arrangement systematically affected the measured AI values. When there was a large horizontal surface, such as a desk or table, near the centre of a workstation, AI values were increased. As shown by the average AI values in Fig. 9, AI values were increased more when the desk or table was at the centre of the source workstation than when it was at the centre of the receiver workstation. When there was a desk or table near the centre of both of the adjacent workstations, AI values were most increased.
0.00 0.10 0.20 0.30 0.40
3B3, both Wks 3B3, source Wks 3B3, receiver Wks
AI
Fig. 9. Average AI values measured between adjacent workstations in the same office. ‘Source Wks’, table at centre of the source workstation; ‘receiver Wks’, table at centre of the receiver workstation; ‘both Wks’, table at centre of
both workstations.
Because of the limited size of most workstations, if there is a desk or table near the centre, it will increase the levels of unwanted speech sounds in adjacent workstations due to the added
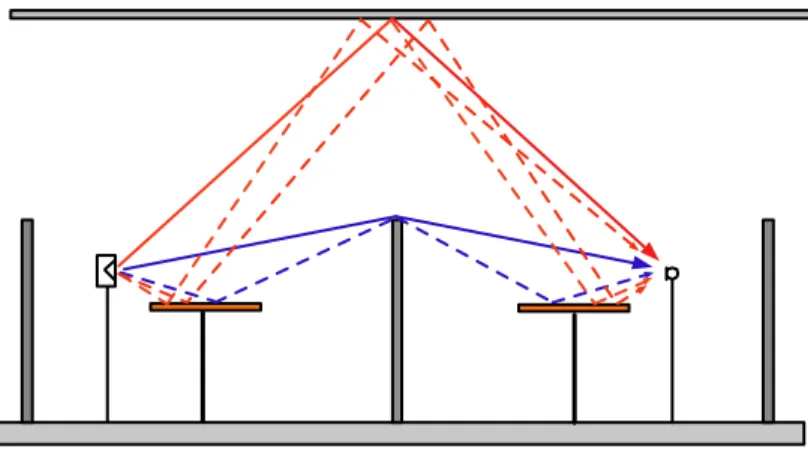
reflected sound paths that are created. The example of sound paths for a desk or table near the centre of both of a pair of adjacent workstations is in illustrated in Fig. 10.
Fig. 10 Sound paths between adjacent workstations with a table or desk in the centre of each workstation. Dashed lines indicate added reflected sound paths due to the tables.
E. Office Case Studies
Fig. 11 includes two examples from case study investigations9 to illustrate diagnosing the causes
of the lack of speech privacy. Office A in Figure 12 had a measured ambient noise level of 33 dBA and an AI = 0.47 using the measured ambient noise level. When the AI was recalculated with a more optimum 45 dBA ambient noise spectrum, an AI of 0.11 was obtained. This office design is seen to be excellent except that there is not enough ambient noise to mask unwanted speech sounds.
Office B in Fig. 11 illustrates an office with a little too much ambient noise. In office B the ambient noise level was 46 dBA and with this noise level had AI = 0.25. When the ambient noise was reduced to the optimum of 45 dBA, the AI increased to 0.33. Comparing the impulse response plots of offices A and B shows that there is much more reflected sound in office B. The initial ceiling reflection (red box) is stronger, the initial panel diffracted path is stronger (Blue box) and there is a quite strong window or side-wall reflection. Both the separating panels and the ceiling absorption are inadequate to provide acceptable speech privacy.
5. CONCLUSIONS
The measurement results illustrate how the effects of key office design parameters: ceiling absorption, workstation panel height, and ambient noise levels, influence speech privacy in the measured open plan offices. They also revealed that details of the furniture layout and reflections from windows can also significantly affect speech privacy.
Measurements between adjacent workstations can explore the important details of sound propagation between nearby workstations. Measurements over larger distances can characterise the average conditions in a particular office.
Speech privacy measurements in open-plan offices using conventional approaches are time consuming to perform and hence have not been frequently used. By making it much easier to make objective measurements of speech privacy, the new SPMSoft program makes it possible to systematically identify and solve acoustical problems in open-plan offices and to better optimize acoustical conditions in the offices. This complements existing acoustical design software for
Office A. Ambient noise 33 dBA, AI=0.47; ambient noise 45 dBA, AI=0.11
Office B. Ambient noise 46 dBA, AI=0.25; ambient noise 45 dBA, AI=0.33
10 20 30 40 50 0 10 20 30 40 50 60 7 Time, ms Level, dB
Impulse Response Screen Ceiling
0
Fig. 11. Summary of the details of two offices included in a case study invetigation9.
10 20 30 40 50 0 10 20 30 40 50 60 Time, ms Level , dB
Impulse Response Screen Ceiling
70
ACKNOWLEDGEMENTS
Work supported by Public Works and Government Services Canada (PWGSC). REFERENCES
[1] ANSI S3.5-1969, “American National Standard Methods for the Calculation of the Articulation Index”, Standards Secretariat, Acoustical Society of America, New York, USA.
[2] Bradley, J.S., “Acoustical Design for Open-Plan Offices”, Construction Technology Update, (63), pp 6, 2004.
http://irc.nrc-cnrc.gc.ca/pubs/ctus/63_e.html
(also available in French http://irc.nrc-cnrc.gc.ca/pubs/ctus/63_f.html )
[3] Bradley. J.S., “The Acoustical Design of Conventional Open Plan Offices”, Canadian Acoustics, 31(2) 23-30 (2003).
[4] Bradley, J.S., “A Renewed Look at Open Office Acoustical Design”, Paper N1034, Proceedings Inter Noise 2003, Seogwipo, Korea, August 25-28, 2003.
[5] ANSI S3.5-1997, “American National Standard Methods for Calculation of the Speech Intelligibility Index”, American National Standard, Standards Secretariat, Acoustical Society of America, New York, USA. [6] IEC 60268-16, Ed. 3, 2003, “Sound system equipment – Part 16, Objective rating of speech intelligibility by
speech transmission index”, International Electrotechnical Commission, Geneva. [7] SPMSoft download: http://irc.nrc-cnrc.gc.ca/ie/acoustics/open/SPMsoft/index_e.html
[8] Bradley, J.S. and Gover, B.N., “Development and Evaluation of Speech Privacy Measurement System”, IRC Research Report, RR-262, August 2008. http://irc.nrc-cnrc.gc.ca/pubs/rr/rr262/
[9] Bradley, J.S. and Gover, B.N., “Open-Plan Office Speech Privacy Case Studies”, IRC Research Report, RR-263, August 2008. http://irc.nrc-cnrc.gc.ca/pubs/rr/rr263/
[10] Bradley, J.S. and Estabrooks, T., “SPMSoft (Speech Privacy Measurement Software) User’s Manual, Software user’s manual, IRC publication, RR-266, August 2008.
http://irc.nrc-cnrc.gc.ca/pubs/rr/rr266/