Analysis of the Cardiovascular Control System Using Broad-Band Stimulation
by
Ronald David Berger Bachelor of Science
Electrical Engineering and Computer Science Massachusetts Institute of Technology (1981)
Master of Science
Electrical Engineering and Computer Science Massachosetts Institute of Technology (1983)
Submitted to the M.I.T. Department of Electrical Engineering and Computer Science
in partial fulfillment of the requirements for the degree of
Doctor of Philosophy at the
Massachusetts Institute of Technology June, 1987
Copyright (c) 1987 Ronald David Berger
The author hereby grants to M.I.T. permission to reproduce and to distribute copies of this thesis document in whole or in part.
Signature of Author
Dept. of Electrical Engineering a' Computer Science June 10, 1987
Certified by _……._______________……---,..--- 1 _ __ -- ---
__---Richard J. Cohen Thesis Supervisor
Accepted by _ ___~____ ..-....
& a-ir!an, Departmental Graduate Committee
MASS',SCHUSETT INSITUTE
OF TECINOLMGY
- 2
Analysis of the Cardiovascular Control System Using Broad-Band Stimulation
by
Ronald David Berger
Submitted to the Department of Electrical Engineering and Computer Science on June 10, 1987 in partial fulfillment
of the requirements for the Degree of Doctor of Philosophy
ABSTRACT
The research discussed in this thesis is an investigation of the regulatory mechanisms that govern the cardiovascular system. These mechanisms comprise the autonomic nervous system (ANS) and are modeled as part of a feedback network in which systemic arterial pressure is the controlled variable. In order to improve our understanding of the phy-siology and potential pathology of autonomic regulation, we have at-tempted to characterize the various functional and anatomic blocks im-plicated in cardiovascular control using transfer function analysis. Transfer functions represent the frequency response of the system or subsystem under study, and are derived from measurements of the system's input and output signals using spectral estimation techniques. Reliable estimation of the transfer function requires that the input signal con-tain significant power density over the entire frequency band of in-terest. Consequently, we have had to devise methods for the introduc-tion of broad-band perturbaintroduc-tions at various points in the cardiovascular system.
Our first set of experiments was designed for study of the response of the sino-atrial (SA) node to fluctuations in vagal and sympathetic tone, and was performed on anesthetized dogs. While the animal's atrial electrogram was continuously recorded, a train of current pulses was ap-plied to the right vagus or cardiac stellate nerve. The frequency of these pulses was modulated by a band-limited Gaussian white noise signal whose mean level could be adjusted from one experimental run to the next. Transfer functions computed between the instantaneous neural stimulation frequency and the resulting heart rate show that the SA node responds to fluctuations in autonomic tone as a low-pass filter whose parameters vary as a function of the mean level of neural activity. This dependence on the operating point in the behavior of the SA node had not previously been appreciated.
In a second study, we developed a technique to allow investigation of the heart rate response to broad-band fluctuations in autonomic tone in human volunteer subjects. These fluctuations were elicited by having the subject breathe on cue to a sequence of beeps spaced erratically in time. Instantaneous lung volume and surface ECG were recorded and served as the system's input and output signals, respectively. Transfer functions were then computed for each subject in both supine and stand-ing positions, and reveal a significant alteration in morphology
associ 3 associ
-ated with postural change. These results most likely reflect a shift in autonomic activity that accompanies postural change, and demonstrate the sensitivity of our approach in detecting subtle variations in autonomic balance.
A final set of experiments was designed, and a single pilot study performed on an anesthetized dog, to investigate the response of the ANS to fluctuations in blood pressure in terms of changes in heart rate and peripheral resistance. Broad-band oscillations in systemic arterial pressure were induced by electrically pacing the ventricles with a white noise frequency-modulated pulse train. The SA nodal rate response of the ANS was measured via epicardial atrial electrodes, and was decoupled from the ventricular activity by ablation of the atrioventricular junc-tion (AVJ). Systemic vascular resistance was computed as the quotient between time-averaged arterial pressure and aortic flow signals. Transfer functions were then computed between arterial pressure and SA nodal rate and between pressure and vascular resistance. Results from the pilot study show that the determination of autonomic response characteristics using this approach is quite feasible. We intend to perform a series of experiments on dogs chronically instrumented as described, but using aseptic technique. Once recuperated from surgery, these dogs can then be studied in a fully conscious state, enabling us to explore the effects of interventions such as acute hemorrhage and selective autonomic blockade on cardiovascular regulation.
We believe these studies will improve our understanding of car-diovascular physiology and assist in our interpretation of spontaneous fluctuations commonly observed in the heart rate and arterial pressure. Furthermore, it is our hope that with additional research, our efforts will lead to the development of non-invasive clinical tools to assess the integrity of a patient's autonomic nervous system that will be ap-plicable in a wide spectrum of pathologic conditions.
Thesis Supervisor: Prof. Richard J. Cohen Title: Associate Professor,
-
4-Acknowledgements
It is a pleasure to thank my thesis supervisor, Prof. Richard J. Cohen, for seven years of thoughtful guidance, advice, and friendship. I am particularly grateful for his encouragement and confidence in my abilities, especially at times when my own doubts might otherwise have led me away from a career in research. At the same time, he has con-tinually challenged me to rethink and defend my ideas and techniques, thereby forcing me to strengthen my approach. Most importantly, how-ever, he has developed a laboratory environment where I could freely explore my own research interests. I look forward to many years of further fruitful collaboration, and many more rousing sets of tennis.
I would like to thank my thesis readers, Professors Roger Mark and William Siebert, for their invaluable suggestions in the development and presentation of my thesis research. Prof. Mark was articularly helpful in critically reviewing the design of and data from my animal experi-ments. Prof. Siebert carefully examined my data analysis approach and offered many insightful recommendations regarding modeling techniques.
My alter ego, Joe Smith, has been a wonderful friend and a strong influence on my life during the last four years. His sharp wit and acerbic tongue have kept me always on my guard. The stimulating discus-sions we have had on both moral and scientific issues have added an important dimension to my graduate experience and sharpened my debating skills. Brainstorming together, Joe and I have found a synergism of thought that has led to many a wild scheme. Our friendship will surely continue to flourish as we enter our medical residency together.
Phil Saul has been a most valuable collaborator and friend. His enthusiasm and boundless energy were largely responsible for the success and completion of the respiratory arrhythmia studies, and his many clever suggestions were tremendously helpful in my experiments on the sino-atrial node. His ideas for future research have been the catalyst for many of my own, and I will enjoy continuing to work closely with him in the coming years.
I am very grateful for the contributions Paul Albrecht has made to my thesis work. He has helped me think through many of the signal pro-cessing issues involved in the data analysis, and he carefully reviewed the text of this thesis. Most importantly, however, Paul has provided our laboratory with an indispensable, though often taken for granted, array of software utilities of which I have made extensive use.
Bo Saxberg deserves my thanks for the many hours he spent teaching me the complex mathematics I needed to understand in order to prepare for my area exam. I appreciate the patience, selflessness, and clarity with which he explained to me this very difficult material. I wish him luck in choosing his post-graduate career path and congratulate him on his upcoming marriage.
I thank Mike Broide for the many hours of pleasurable conversation he has given me. Often sprinkled with tidbits of linguistics or physics
- 5
-for the non-physicist, these discussions have provided rich food -for thought. I particularly appreciate his explanation of why the sky is blue. I wish Mike luck as he approaches married life.
I owe much of my knowledge of animal experimentation techniques to t'le tutelage of Mike Bailin. Although we worked together for only a year, in that time, Mike managed to provide me with a solid foundation in anatomy, physiology, pharmacology, and pathology that seemed to encapsulate many of the important points I went on to learn in medical school.
I would like to take this opportunity to thank a number of other labmates for their help and friendship over the last several years. I only apologize for the brevity with which I recognize their contribu-tions, and wish not to imply that their significance is any less than the aforementioned. I thank Robert Kenet for having introduced our lab, and me in particular, to transfer function analysis. I also appreciate all the laughs I had with Rob and his brother, Barney. Jeff Madwed's thorough investigation of Mayer waves sparked my interest in this area, and I thank him for his collaboration in performing the random-interval ventricular-pacing experiments with me. I thank Ming Hui Chen for her hard work and interest in carrying out and analyzing the respiratory arrhythmia experiments. Danny Kaplan has provided many interesting insights regarding both physics and politics, and I thank him for his careful proofreading of my thesis. I am grateful to Solange Akselrod for taking such good care of me for six weeks, while I worked in her lab at the University of Tel Aviv.
I would like to extend a special thanks to Keiko Oh, my "friend in high places." She has been extremely helpful in managing the adminis-trative issues behind my research assistantships and fellowships, and has gone well beyond the call of duty in making my biggest headaches magically disappear.
The M.I.T. Division of Comparative Medicine is to be thanked for their excellent care of our laboratory animals. I am particularly indebted to Chris Newcomer and Terri Sylvina for their knowledge and assistance in handling animals.
At this point, I come to those for whom acknowledgement is most overdue. I would like to express my deep gratitude and love for my mother, Beverly, and father, Joseph, who have instilled in me a desire to learn and a drive to excel. Although they never pressured me academ-ically, I fully attribute my achievements to the self-motivation and self-confidence that their upbringing fostered.
The last individual I wish to thank is the one to whom I dedicate this thesis, my wife, Linda. She has shared with me the successes and failures of my research, the fun and frustrations of my medical educa-tion, and the happiness and challenges of three years of marriage. Hav-ing uprooted herself from New York, she has made enormous sacrifices to make our marriage work. Always selflessly offering me he" support, she has my love and my adoration.
6
-Finally, I would like to thank the various agencies that provided financial support for this thesis research. These include NASA (grants NAG2-327 and NAGW-988), the Office of Naval Research (grant N00014-79-C-0168) and the Naval Blood Research Laboratory of the Boston University School of Medicine. I am grateful for fellowship support provided by the Whitaker Health Sciences Fund for my final year of graduate study.
8 Table of Contents Abstract ... 2 Acknowledgements ... Table of Contents... List of Figures... ... 4
...
10
1. Introduction... 12 2. Cardiovascular Physiology... 2.1 Function of the cardiovascular system... 2.2 Need for cardiovascular regulation... 2.3 Autonomic control - a block model... 2.4 Cardiovascular system responses... 2.4.1 Physiologic influences ... 2.4.2 Pathologic states... 3. Approaches toward studying autonomic regulation. 3.1 System components and signals of interest. 3.2 Mean levels of hemodynamic variables... 3.3 Spontaneous hemodynamic fluctuations ... 3.4 Autoregressive models and techniques... 3.5 Analyses using exogenous input excitation. 3.6 Nonlinear analysis... 3.7 Transfer function analysis...4. Signal processing techniques... 4.1 Recording of physiologic signals... 4.2 Sampling, filtering, and decimating ... 4.3 Derivation of the heart rate signal...
4.3.1 Difficulties in defining heart rate... 4.3.2 Previous algorithms for heart rate... 4.3.3 Description of new heart rate algorithm... 4.3.4 Performance comparison among algorithms... 4.4 Spectral estimation...
4.4.1 Autospectrum ... 4.4.2 Cross-spectrum . ...
4.5 Transfer function estimation...
4.5.1 Transfer and coherence functions ... 4.5.2 Confidence limits of transfer function... 4.5.3 Pooling of transfer function data... 5. Study of the response of the sino-atrial node.
5.1 Introduction... 5.2 Methods ... 5.3 Results ... 5.3.1 Vagal stimulation ... 5.3.2 Sympathetic stimulation... 5.4 Discussion...
5.4.1 Experimental response characteristics..
5.4.2 Warner and Cox model of the sino-atrial node ... 149 16 16 23 26 32 33 36 42 42 44 45 48 57 60 64 69 69 71 76 76 76 80 87 92 92 105 107 107 109 112 120 120 122 129 129 137 146 146
...
...
...
...
...
.... ...
...
. . . .. . . . . .. . . . . .. . . . . .. . . . . .. . . . . .. . . . . .. . . . . .. . . . . .. . . . . . .. . . . . . .. . . . . . .. . . . . . .. . . . . . .. . . . . . .. . . . . . .. . ....
...
...
...
...
...
...
-
9-5.5 Comments ... 153 of autonomic response to respiratory activity....
Introduction... Methods... Results ... Discussion ... Follow-up studies... . . . . . . . .. . mode' . . . . * . . . . * . . . . . . . . * . . . . * . . . . * . . . . * . . . . * . . . . * . . . . 1...eeeeeeeele elleeeeeee eeeeeeeeee .eeeleeeee eeeeeeeeee eeeeeeeeee eeeelleeee .eeeeleeee eeeeeeeee. leeeeeeeee
7. Animal model for analysis of autonomic response... 7.1 Introduction ... 7.2 Methods...
7.3 Results of pilot study... 7.4 Discussion and proposal for conscious animal 8. Conclusion ... References... ... 209 ... 213 Biographical Sketch... 6. Study 6.1 6.2 6.3 6.4 6.5 157 157 161 170 175 178 181 181 188 190 202 225
- 10
List of Figures
2.1: Schematic of the circulation ... 18
2.2: Windkessel model of the circulation . ... 20
2.3: Waveforms resulting from Windkessel model . ... 22
2.4: Modified Windkessel model ... 24
2.5: Block diagram of short-term CV control ... 27
2.6: Example of Mayer waves ... 39
3.1: Spontaneous fluctuations in HR and ABP . ... 47
3.2: Model of a linear system ... 48
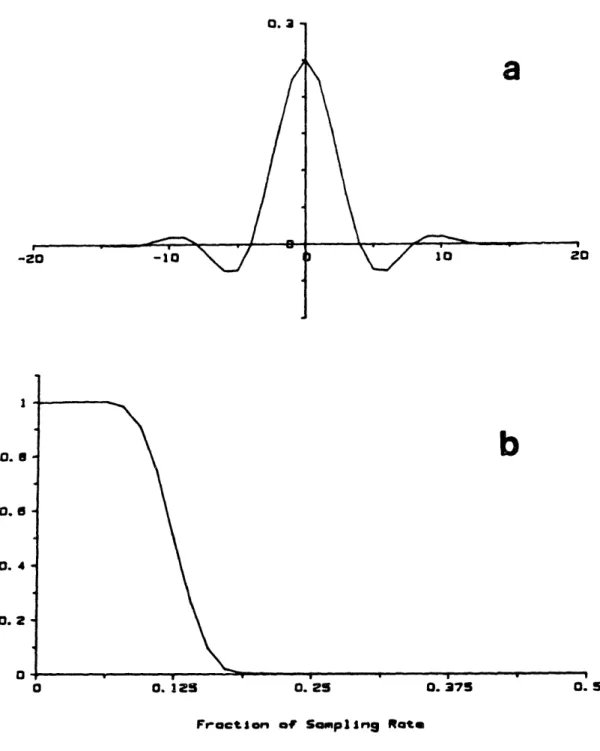
4.1: Digital anti-aliasing filter ... 74
4.2: Explanation of tachometer algorithm. ... 81
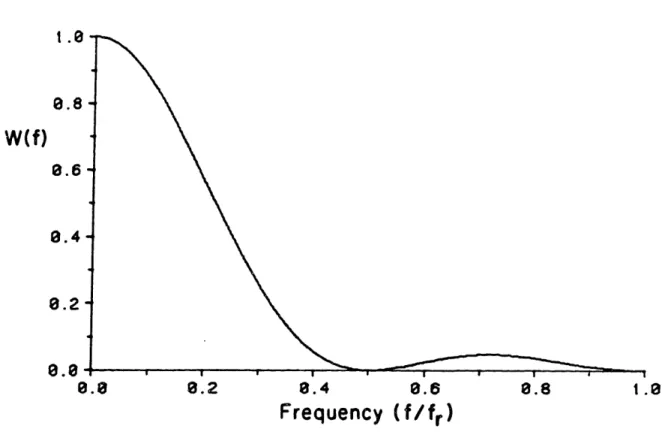
4.3: Spectral window resulting from tachometer algorithm ... 84
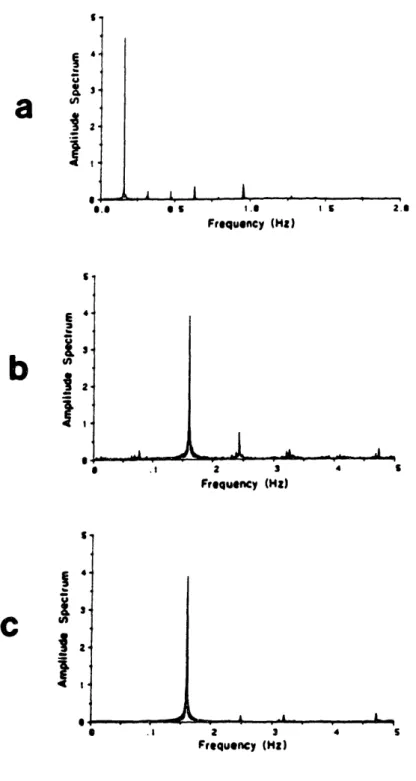
4.4: Comparison of HR spectra showing aliasing effects ... 86
4.5: Comparison of four tachometer algorithms - I... 88
4.6: Comparison of four tachometer algorithms - II ... 90
4.7: Gaussian window used in spectral estimation ... 101
4.8: Flow chart of spectral estimation algorithm ... 104
4.9: Measurement error in transfer function estimate ... 111
4.10: Total error in transfer function estimate ... 115
4.11: Flow chart of group-average transfer function estimation ... 118
5.1: Apparatus used in experiments on the SA node ... 123
5.2: Gaussian white noise frequency modulation ... 126
5.3: Schematic of voltage-to-current converter circuit ... 127
5.4: Mean SA nodal rate vs vagal stimulation frequency ... 130
5.5: Example of signals during GWNFM vagal stimulation ... 131
5.6: Example vagal rate-to-HR transfer and coherence functions... 132
5.7: Group-average vagal rate-to-HR transfer magnitude plots ... 134
5.8: Group-average vagal rate-to-HR transfer phase plots ... 135
5.9: Vagal rate-to-HR system gain plots ... 138
5.10: Mean SA nodal rate vs sympathetic stimulation frequency ... 139
5.11: Example of signals during GWNFM sympathetic stimulation ... 140
5.12: Example symp. rate-to-HR transfer and coherence functions ... 142
5.13: Group-average symp. rate-to-HR transfer function plots ... 143
5.14: Sympathetic rate-to-HR system gain plots ... 145
5.15: Reproduction of Warner and Cox model of SA nodal control ... 150
5.16: Vagal rate-to-HR TF plots for Warner and Cox model ... 152
5.17: Symp. rate-to-HR TF plots for Warner and Cox model ... 154
6.1: Apparatus used in random-interval breathing experiments... 162
6.2: Distribution of inter-breath intervals ... 165
6.3: Spectrum of impulses with interval distribution of Fig. 6.2... 169
6.4: Example of signals during random-interval breathing ... 171
6.5: Example of lung volume-to-HR TF and coherence . ... 172
6.6: Group-average lung volume-to-HR transfer function plots ... 173
7.1: Model of baroreflex control of vascular resistance ... 185
7.2: Multichannel recording from GWNFM pacing experiment ... 191
- 11
-7.4: Power spectra of signals in Fig. 7.3... 195
7.5: Vent. rate-to-ABP TF and coherence - mean rate of 90 bpm ... 196
7.6: Vent. rate-to-ABP TF and coherence - mean rate of 180 bpm... 198
7.7: ABP-to-atrial rate TF and coherence ... 199
12
-Chapter 1: ntroduction
The physiologic mechanisms that regulate the cardiovascular system have long intrigued investigators in a variety of disciplines. While medical researchers have quite naturally been interested in the perfor-mance of the cardiovascular control system as a critical determinant of patient health, engineers have found that this regulatory system consti-tutes a fascinating paradigm of nature's solution to a common engineer-ing problem: feedback and control. If we attempt to model the car-diovascular control system as a feedback network, we need to identify (1) the central processor organ, (2) the variables that are being moni-tored and controlled, (3) the feedback paths and effector organs, (4) the set-points and operating regimes of the system, and (5) the transfer functions of the individual elements of the system and of the integrated system. Additional relevant points to consider regarding this system include interaction between the several feedback loops that comprise the network, stability of the overall system, nonlinearities of operation, and the appearance of failure modes.
A thorough understanding of this last point, namely the failure modes of the cardiovascular control system, is a large part of the motivation for the study of this system. Only with such an understand-ing can we fully appreciate the mechanisms that underlie the hemodynamic abnormalities seen in essential hypertension, sudden infant death syn-drome, diabetes, and congestive heart failure, as well as in conditions that stress the cardiovascular system such as hemorrhagic shock. Furth-ermore, in order to provide proper therapeutic management in each of these pathological conditions, we must understand not only the etiology
13
-and effects of the disease processes, but the effects of the
interven-tions as well. In particular, many of the pharmacologic agents used in treating cardiovascular disorders selectively block one control path or another, leaving the rest of the system intact. Since the various con-trol limbs that comprise this system have different characteristic time constants, selective blockade of any single pathway can affect the dynamics, and even the stability, of the system profoundly. Similarly, prosthetic devices such as pacemakers and artificial hearts can dramati-cally alter not only the set-point, but the dynamic response of the car-diovascular system to natural perturbations as well.
In the last century, great strides have been made toward under-standing cardiovascular physiology. As I will discuss in greater detail later, a number of investigators have employed a systems engineering approach to study many aspects of the cardiovascular control system. A difficulty encountered in this area of research, as in the investigation of any biological system, is that one must significantly perturb the very system he wishes to study in order to obtain the most informative measurements. Conversely, the information obtainable from a study designed specifically to be minimally perturbing will inevitably be lim-ited. Consequently, many questions remain unanswered regarding the dynamic response of the cardiovascular control system to disturbances of the nature that it normally experiences from one moment to the next.
In this thesis, I report on the application of broad-band stimula-tion techniques to probe the dynamics of several components of the car-diovascular control system. The data I present is derived from three different experimental setups: two groups of invasive studies in acute
- 14
-anesthetized dog preparations and a non-invasive study in human volunteers. As mentioned above, the most invasive of these experiments provides the most easily interpreted measurements, while those in the least invasive studies were somewhat more perplexing. Nonetheless, sig-nificant, new, and interesting results were obtained in all studies, and add to our current understanding of cardiovascular regulatory dynamics. Furthermore, some of the techniques developed in the course of this thesis research show promise as potential diagnostic tools in clinical medicine.
To provide an appropriate perspective through which to view the experiments presented herein, I include a discussion (Chapter 2) of the relevant cardiovascular physiology and of a block-type model of the regulatory mechanisms that govern cardiovascular function. In Chapter 3, I review the various techniques to probe these control mechanisms that have been employed in the past, and discuss some of the results that have been obtained with these approaches. The data analysis tech-niques that I have utilized are presented in Chapter 4. Here, the sig-nal processing algorithms, as well as the hardware and software developed for their implementation, are described. In Chapter 5, I dis-cuss the animal preparation, results, and implications thereof for two sets of experiments performed on anesthetized dogs, designed to probe the dynamic behavior of the heart's normal pacemaker, the sino-atrial node. In Chapter 6, I present a study of the effects of respiratory activity on cardiovascular function in humans. A final group of exments, designed to investigate neural regulation of heart rate and peri-pheral resistance, is discussed in Chapter 7. This latter study is part
15
-of an ambitious on-going project, and the results presented are derived from pilot experiments performed on anesthetized dogs. Ultimately, these experiments will involve fully conscious animals who will have been previously instrumented with the necessary probes and catheters. Finally, in Chapter 8, the significant implications of all the studies are summarized, and future directions for this research are discussed.
- 16
-Chapter 2: Cardiovascular Physiolqgy
2.1 Function of the Cardiovascular System
The heart and blood vessels comprise a transport system that enables exchange of fluid, gases, electrolytes, nutrients, and waste products between the organs of the body. Of primary importance in the operation of this transport system is its ability to deliver sufficient oxygen to meet the collective metabolic needs of the various tissues. Nutrients such as carbohydrates and fats are transported between the digestive tract, liver, adipose tissue, and other organs for energy storage, and then back through the blood stream to the brain and muscu-lature for energy utilization. Metabolic waste products including car-bon dioxide and urea are carried by the cardiovascular system for elimi-nation by the lungs and kidneys. The cardiovascular system also pro-vides a route of transport for hormones produced by the endocrine sys-tem, and for the cells and products of the immune and clotting systems.
Fluid compartmentalization and osmolarity are maintained by the membranes of cells that line the vasculature. Since each cell's electr-ical and metabolic activities are strongly influenced by intra- and extracellular pH and electrolyte concentrations, the transport of these ions throughout the body constitutes a vital function of the cardiovas-cular system. Also, since the blood volume that fills the vasculature carries heat released as a byproduct of metabolism, the redistribution of the blood between parts of the body provides a mechanism for thermal regulation, as well. In particular, heat is conserved by selective con-striction of vessels that serve the skin, and can be emitted through
17
-perfusion of such peripheral tissue. When more rapid heat loss is required, as during muscular exercise, fluid originating in the vascula-ture is exuded through the skin via sweat glands, thereby allowing for evaporative cooling.
In its crudest form, the cardiovascular system may be thought of as a network of plumbing. The heart serves as a pump and the blood vessels are the pipes. The system is, in fact, more complicated than that: the heart is a dual pump with four chambers, and each half of the heart sup-plies a separate vascular circuit from the other. This structure is outlined in Figure 2.1. As shown in this schematic, blood returning from all organs except the lungs enters the right atrium, the antechamber of the right half of the heart. During the ventricular fil-ling, or diastolic phase of the cardiac pumping cycle, the tricuspid valve opens, allowing blood to pass from the right atrium to the right ventricle. The blood is then ejected through the pulmonic valve to the pulmonary arterial vasculature during the systolic phase of the cardiac cycle. The pulmonary arteries arborize and perfuse the parenchyma of the lungs, where gas exchange between the alveolar sacs and the blood occurs. In particular, carbon dioxide is released from the blood and exhaled, while inspired oxygen diffuses into the blood. This oxygenated blood enters the left-side antechamber, the left atrium. Left atrial blood passes through the mitral valve into the left ventricle during diastole, and is then ejected through the aortic valve during systole. Branches of the aorta supply blood to the heart muscle itself, to the brain, kideys, skeletal muscle, and skin, and to all other organs of the body.
- 18
-Pulmonary
Circulation
Systemic
Circulation
Aorta
Pulmonary
Artery
Figure 2.1.
Schematic drawing of the circulation,
showing the four
chambers of the heart and the pulmonary and systemic vascular circuits.
- 19
-The structure of the blood vessels themselves contributes impor-tantly to the function of the cardiovascular system. Arteries, which carry blood at high pressure away from the heart, are muscular vessels capable of significant modulation of caliber and substantial stretching. They ramify into smaller and smaller arterioles, ultimately giving off capillaries whose walls are so thin as to allow gas exchange by diffu-sion. The capillaries merge into venules which in turn collect into larger and larger veins to return blood to the heart under low pressure. The venous system is composed of vessels with much thinner, less muscu-lar, walls than in the arteries and arterioles. The veins thus possess a greater capacity for pooling of blood but present less resistance to flow than the arterial vessels.
The mechanical properties of the vasculature may thus be modeled by an electrical circuit with a resistance and capacitance as in Figure 2.2. In this representation, termed the Windkessel model, electric current is analogous to blood flow and voltage represents pressure. The heart is modeled here as a current source, although the cardiac output -and thus current level - are by no means assumed constant. A single current source, resistor, and capacitor, as here, model either the pul-monary or systemic circuit; two such networks may be coupled in series to represent the combined cardiovascular system. The resistance R is the net effective resistance of all the parallel branches of the vascu-lar tree. Simivascu-larly, the capacitance C is the sum of the individual capacitances of the various vessels. This obviously represents a tremendous simplification of the true vasculature, where the resistance and capacitance are distributed along the length of the circuit, as in a
20
-V
C
Windkessel model of the circulation. i
21
-waveguide.
The equations that describe the circuit behavior are:
i CdV (2.1a) c _ Cd V iR =V (2.1b) iC + iR = i (2.1c) Thus,
dV +
-V
i
(2.2)
dt RC CIf the cardiac cycle is modeled by a square wave current signal of mag-nitude I, then during systole,
V = V + IoR(1 - e
- t / w)
(2.3)
where Va is the voltage just prior to the upstroke of the current wave,
and the time constant equals RC. During diastole,
V
Ve-t/r
(2.4)V - Vbe
where Vb is the voltage ust prior to the fall in supply current.
Examples of the current and corresponding voltage waveforms are
shown in Figures 2.3a and 2.3b respectively.
A stylized arterial
pres-sure waveform is shown in Figure 2.3c for comparison with the circuit voltage signal. Note that the voltage waveform models the pressure quite well. In fact, much of the differences between these signals can be reconciled by taking into account the variable capacitance of the ventricle itself during systole and the rebound effect of valve closure at the termination of systole.
22
-lo
a )
Vb )
Vb
VABPABP
) I I I I I I I l l I I I I I I I I I I I I I I I I .. I It
Figure 2.3. Current and voltage waveforms for the Windkessel model. When the square wave current signal (a) is applied to the model, the resulting voltage (b) rises and falls with time constant equal to RC. A stylized arterial blood pressure trace (c) is shown for comparison.
23
-2.2 Need for Cardiovascular Regulation
The rate of metabolism in many tissues varies considerably depend-ing on the rate of cellular growth, temperature, enzymatic activity, and work performed. If te blood flow to each organ were always sufficient to sustain its maximal metabolic needs regardless of the actual instan-taneous requirements, the cardiac output would have to be maintained orders of magnitude greater than the normal resting level, placing inor-dinate demands on myocardial (heart muscle) performance. To avoid this state of affairs, the circulation functions parsimoniously; the blood flow to each organ of the body is maintained so as to exactly meet the instantaneous functional requirements of that tissue. This is accom-plished through three basic mechanisms: 1) regulation of blood flow through the vasodilatory effects of insufficient nutrient concentration (e.g., oxygen) or of excess metabolites (e.g., carbon dioxide, lactic acid, hydrogen ions, etc.) within the local milieu, 2) neural control of cardiac output and vascular resistance, and 3) humoral (blood-born chem-ical) regulation of either local or general vascular tone by substances such as hormones, ions, or toxins. These mechanisms allow for 25-fold increases in blood flow through tissues such as skeletal muscle, while at the same time preserve almost constant flow through the brain, whose functional requirements hardly vary.
The regulation of regional blood flow may be represented by a modi-fied version of the circuit shown in Figure 2.2. The new circuit, shown in Figure 2.4, includes separate resistors for each section of the sys-temic circulation. Each of these resistors is composed of two com-ponents: one under local regulation via the first mechanism described
- 24
-*0
Figure 2.4. Modified Windkessel model, with separate resistors for each region of tissue in the body. Also indicated are local regulatory mechanisms that control a component of the resistance so as to maintain local perfusion, and global mechanisms that affect all the resistances and cardiac output so as to regulate arterial pressure.
- 25
-above, and the other governed by the generalized effects included in mechanisms 2 and 3. Note that the current source is also regulated, representing the neural control of cardiac output.
A key question concerning the regulation of the circulation is: what governs central neural control of cardiac function and peripheral resistance? Local control mechanisms can respond to changes in dis-solved ion and gas concentrations within the very neighborhood of the regulated blood vessels. But the central nervous system (CNS) can not sense regional changes throughout the body; rather, it responds to changes in global hemodynamic variables. As I will discuss in greater detail in Section 2.3, empirically, the CNS serves chiefly (although not exclusively) to regulate systemic arterial blood pressure. Refering to Figure 2.4, we see that a regulated arterial pressure, or voltage level V, enables local control mechanisms to adjust regional blood flow predictably and in proportion to the total local vascular resistance.
Cardiac output and systemic peripheral resistance are thus regu-lated as part of a feedback loop. The anatomic and functional elements that comprise this feedback loop will be discussed in the following sec-tion. The overall effect of these central control mechanisms can be summarized in terms of the circuit model: the current source and effec-tive resistance are modulated to make the source behave as a well-regulated voltage supply. Superimposed on this regulated voltage or pressure level, however, appear phasic variations related to the cardiac cycle. The story is further complicated by the fact that the setpoint for mean arterial pressure may vary depending on the state of conscious-ness and activity level of the organism. In fact, the influence of
26
-emotion, mentation, and other higher cerebral functions on hemodynamic control is an area of active research. It is a goal of this thesis work to explore the fundamental dynamics of the lower neural pathways impli-cated in cardiovascular regulation, as a foundation for investigatory endeavors concerning higher cortical pathways.
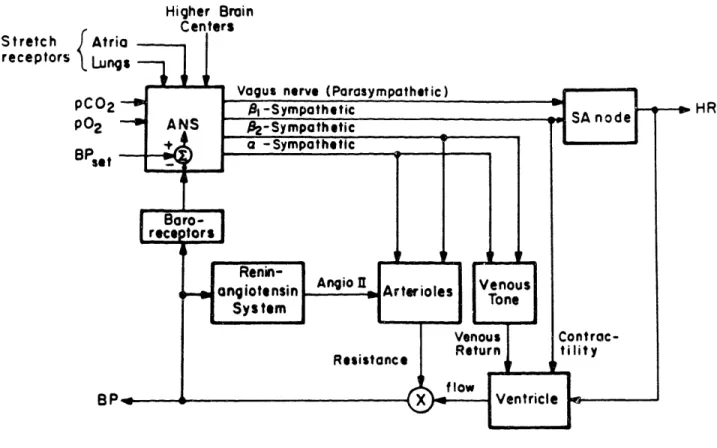
2.3 Autonomic Control - A Block Model
A block diagram model of the control network that regulates the cardiovascular system is shown in Figure 2.5. Each of the subsystems (blocks) within the complete network represents a distinct anatomical and functional component of the cardiovascular system, and the connect-ing lines represent either neural or vascular communication paths. Guy-ton et al [54] presented a similar but more complete model of the vari-ous cardiovascular control mechanisms. They separated these mechanisms into two categories: those that govern the hour-to-hour or even day-to-day state of fluid balance and those that mediate rapid responses (on the order of seconds to minutes) to perturbations in systemic blood pressure. The first category is comprised of the capillary filtration system which controls the distribution of fluid volume between the blood and the interstitial spaces, and renal mechanisms. These include the control of urine output through modulation of the glomerular filtration rate and the secretion of antidiuretic hormone and atrial natriuretic factor (ANF). The renin-angiotensin system (RAS), well reviewed recently by Reid [111], is considered by many to be another slowly reacting regulator of intravascular fluid volume, although Akselrod et al [4] have shown the RAS may play an important role in short-term
hemo 27 hemo -Stretch
f
Atri receptors LurnpC0
2 P02 BPset BPFigure 2.5. Block diagram of short-term cardiovascular control. Each block represents a separate functional entity, and the connecting lines denote paths of neural conduction or blood flow.
28
-dynamic regulation, as well. The second category of cardiovascular con-trol loops, however, consists of neurally mediated mechanisms, which by definition comprise the autonomic nervous system (ANS).
While the study of renal function and the effects of shifts in fluid balance on the cardiovascular system is an area of active investi-gation, the scope of this thesis is restricted to the mechanisms that regulate short-term control on hemodynamics (i.e., those with time con-stants less than 10 minutes). For this reason, I have omitted renal influences and capillary filtration in the model shown in Figure 2.5. (The renin-angiotensin system will not be considered further in this thesis, although it is included in this figure to show where its effects would enter the model.) For sure, there exist other physiologic mechan-isms, not included in this model, whose response to hemodynamic pertur-bations may appear within minutes. The release of epinephrine from the adrenal medulla in situations of stress is one example, and there may well exist other similar mechanisms yet to be identified. Any such effector pathways will be considered in this model to be just suffi-ciently slow in their responses as to remain at constant levels of activity throughout any one ten minute period, although it is understood that these levels may differ from one operating regime to another. Since these influences may well be important or even dominate in certain physiologic regimes, one must obviously be cautious in attempting to extrapolate results whose significance assumes validity of this simpli-fied model to situations in which the model does not well apply.
The autonomic nervous system receives numerous input signals both from afferent nerve fibers and from higher brain centers. The
29
-information received from other parts of the brain includes many of the required set-point signals. One may alternatively define the autonomic nervous system to include any such brain centers, so that all set-points are controlled within the central processor block. The afferent nerves carry to the brainstem information regarding many physiologic variables. These include arterial blood gas partial pressures (pCO2 and pOz), body temperature, degree of lung expansion (chest wall stretch, actually), and blood pressure measured at several points in the vasculature. While all of these signals are undoubtedly of importance in some aspect of physiologic regulation, there is substantial evidence [58,100] suggest-ing systemic arterial blood pressure is the variable most carefully regulated by those feedback mechanisms that impinge on cardiovascular function. For simplicity in this model, arterial blood pressure will be the only variable considered to be both monitored and regulated by the cardiovascular control system. Hemodynamic variables such as heart rate and instantaneous cardiac output are, of course, governed by the ANS, but their modulation is assumed here to be a means for regulating the controlled variable, arterial pressure. Some other physiologic vari-ables, such as body core temperature and pCOs, are indeed both monitored and regulated by the ANS. An important assumption in this simplified model, however, is that these variables remain sufficiently static from moment to moment that their fluctuations do not significantly influence short-term cardiovascular control. (Note that pCO2 is the key regulated
variable in models of respiratory control [211, but does not substan-tially affect cardiovascular regulation unless its level rises or falls well above the normal range.)
- 30
-The physiologic subsystem responsible for measuring arterial blood pressure is not simple. The transducers are several, located at dif-ferent anatomical sites, and may respond somewhat difdif-ferently from each other to fluctuations in pressure [5,39,66,67,121]. The most important of these transducers, or baroreceptors, are situated in the aortic arch and bilaterally in the bifurcations of the carotid arteries. The baroreceptors consist of stretch sensors within the walls of the vessels in which they are located. Afferent nerve fibers originating in the carotid baroreceptors communicate with the brainstem by way of the glos-sopharyngeal nerves, while aortic baroreceptor activity is carried by the left aortic nerve which runs to the brainstem within the vagosym-pathetic nerve trunk.
The autonomic nervous system apparently effects its function of cardiovascular control through multiple, seemingly redundant, pathways. Since mean arterial blood pressure is the product of cardiac output and arterial vascular resistance, it is not surprising that mechanisms exist to modulate both of these variables. Cardiac output is, in turn, the product of heart rate and stroke volume, each of which is also regulated by the autonomic nervous system. Further redundancy is present in the system in that two major efferent neural pathways exist for the communi-cation of information from the brainstem to the cardiovascular effector organs. Signals carried along one of these neural networks, the sym-pathetic nervous system, generally effect an increase in arterial blood pressure and cardiac output, while the other pathway, the vagus nerve (a part of the parasympathetic nervous system) carries signals that mediate opposing effects. The sympathetic nervous system can be further
subdi 31 subdi
-vided according to the particular chemical receptor on the cell surfaces of the tissues receiving the neural message. Although the neuro-transmitter released by all sympathetic nerve terminals is norep-inephrine, the receptor types differ somewhat in structure as well as in sensitivity to norepinephrine analogs, and are classified as a, , and 02. The neurotransmitter for the parasympathetic nervous system is ace-tyl choline, and the corresponding receptors on cells of the cardiovas-cular system's effector organs all appear to be of the same type, termed muscarinic receptors.
The effector organs of the cardiovascular control system are the sino-atrial (SA) node which functions as the heart's pacemaker, the car-diac ventricles whose contractility and degree of diastolic filling determine stroke volume, and the systemic vasculature which presents an impedance load to the ventricular pump. The SA node is innervated by both the vagus nerve and the sympathetic nervous system. The receptor type for the latter is P1. While either an increase in sympathetic activity or a decrease in vagal signals can initiate an increase in heart rate, the physiologic situations in which the first of these mechanisms is actually invoked may be quite different from those in which the second one predominates [37,52,108,122,125]. Thus the apparent redundancy of this dual innervation of the SA node may actually be an advantageous evolutionary development, allowing for the appropri-ate response to a transient fall in arterial blood pressure in a variety of settings. Similarly, the muscular walls of the arteriolar vessels, which are innervated by sympathetic fibers, possess receptors that eli-cit competing effects. a receptors predominate and when stimulated,
32
-cause vasoconstriction and thus an increase in vascular resistance. However, receptors are also present in arterioles that supply skele-tal muscle and mediate a vasodilatory response, especially during exer-cise. Diastolic filling depends most critically on the state of fluid balance, which varies slowly and is controlled predominantly by renal mechanisms, as described earlier, but can be modulated in the short term by changes in venous tone which is influenced by a and ,2 sympathetic activity [53]. Finally, the contractility of the ventricles appears to be controlled by the sympathetic nervous system (via receptors), although some evidence suggests a small degree of participation by the parasympathetic nervous system [100].
Clearly, the cardiovascular control system is substantially more complicated than a simple feedback and control system such as a furnace with a thermostat. The multiplicity of feedback and effector pathways may provide a system fail-safe against failure of an individual pathway, or it may be a crucial attribute of the system for optimal stable opera-tion. This questions is largely unanswered at present.
2-4
General
ardigna2 ulr
gyatfm
Behayl-aSome of the basic principles of cardiovascular regulation are well illustrated by the system response to several common physiologic and pathologic perturbations. The availability of multiple feedback mechan-isms, mentioned above, allows for the appearance of different types of response in different situations. Vagal, or parasympathetic, modulation is largely responsible for heart rate fluctuations in response to many physiologic influences, while the sympathetic nervous system mediates
33
-most of the changes in cardiovascular function that take place in either physiologic or pathologic stress. Even when increased sympathetic drive is called upon, the specific reaction invoked may be quite selective; the diverse cardiovascular effects of generalized sympathetic discharge need not appear simultaneously.
2.4.1 Physlogi_ Influeneas
One of the most common physiologic perturbations to the circulation is a change in posture from a recumbent position to standing. The direct and immediate effect of such a postural change is a shift in local blood volumes and pressures due to the weight of the intravascular column of blood. Since the veins of the lower leg lie about 100 cm below the level of the heart in the average erect adult, the pressure in these veins should theoretically rise from less than 10 mm Hg when supine to over 80 mm Hg when standing. The actual elevation in leg venous pressure is not nearly this severe because valves within the veins interrupt the column of blood. Similarly, the hydrostatic pres-sure in the cerebral vasculature would be reduced by roughly 30 mm Hg on standing, were it not for compensatory mechanisms invoked.
Despite a modest rise in venous pressure in the lower extremities upon standing, the veins distend only minimally. Increased tone in sym-pathetic fibers innervating the veins stimulate a receptors in the vessel walls, thereby eliciting smooth muscle contraction and a reduc-tion in venous capacity. a stimulation also causes an increase in sys-temic arterial resistance which helps to maintain arterial blood pres-sure in the cerebral circulation. Finally, the mean heart rate also
34
-increases on transition from supine to erect position. This is, in part, a further manifestation of heightened sympathetic activity, as receptors in the SA node are stimulated. In most normal healthy indivi-duals, however, most of the rise in heart rate on standing is due to withdrawal of vagal activity, as will be discussed in detail in Chapter 6. The elevated heart rate, coupled with reduced lower body venous capacity, helps mitigate the reduction in cardiac output that would oth-erwise occur if a substantial volume of blood pooled in the dependent vasculature. Note that all of these neurally mediated responses to standing are presumably triggered by the initial fall in arterial pres-sure at the level of the baroreceptors, although a decrease in right atrial stretch may also play an important role.
A physiologic stress requiring substantially greater adjustments in cardiovascular function is muscular exercise. During maximal exertion, the rate of total oxygen consumption can rise 15-fold over the basal state. This enormous demand for oxygen can be met in part by 5-fold increase in cardiac output and thus oxygen delivery. Almost all of this amplification in cardiac output is accomplished by sympathetically medi-ated elevation in heart rate; the stroke volume rarely increases more than 50% above the basal level. The remainder of the excess oxygen demand is met by up to 3-fold increases in the fractional extraction of oxygen from the blood, which becomes manifest in a commensurately increased arteriovenous oxygen difference. The greatest part of the augmented cardiac output goes to the working skeletal muscle, which in fact steals blood from temporarily less essential organs, thereby reduc-ing flow to those tissues. Organs that are exceptions to this rule
- 35
-include the heart itself whose perfusion increases in proportion to the work it performs, the skin which is perfused according to heat loss requirements, and the brain whose blood flow is constant.
An important distinction between the effects of postural change nd of exercise lies in the systemic vascular resistance. As mentioned above, on standing, arterioles throughout the body constrict to maintain cerebral blood pressure. During exercise, however, vessels that supply the working skeletal muscle dilate under the control of both local regu-latory mechanisms and systemic , sympathetic activation. As a result, systemic vascular resistance falls, often substantially. In this way, cardiac output can rise dramatically with only modest increases in arterial pressure.
A third physiologic perturbation of cardiovascular function is respiration. Both the pulmonary and systemic vascular circuits are influenced by the phasic intrathoracic pressure fluctuations that accom-pany the inspiratory/expiratory cycle. Not only does the intrathoracic pressure have an additive effect on the blood pressure in vessels emanating from the chest, but it also influences ventricular filling by enhancing venous return to the heart during inspiration and causing the opposite effect during expiration. Fluctuations in ventricular filling modulate cardiac output, which in turn perturbs arterial pressure.
A particularly interesting effect of respiration on the cardiovas-cular system, however, is its influence on heart rate. The phasic vari-ations in heart rate that follow the inspiratory/expiratory cycle have long been recognized and are refered to as the respiratory sinus
36
-arrhythmia (RSA). Three different mechanisms have been suggested as being at least partly responsible for this phenomenon. The first derives from the mechanical effects of respiration described above. The autonomic nervous system senses fluctuations in systemic arterial pres-sure (and perhaps in atrial stretch, as well) and responds through modu-lation of heart rate. A second potential mechanism is an autonomic response to the changing chest circumference. Stretch receptors within the chest wall may well exist and communicate with the brainstem. The third mechanism often cited is a direct neural interaction between the respiratory drive and heart rate control centers of the brainstem. The survival value of the latter two mechanisms is unclear and the RSA remains a confusing and actively investigated phenomenon.
The ANS mediates these respiratory-induced heart rate fluctuations predominately through modulation of vagal tone. Sympathetic modulation also contributes somewhat, however, particularly at lower frequencies of respiration. Since these two limbs of the ANS mediate responses with differing amounts of delay, the precise phase relationship between respiration and heart rate is likely frequency-dependent. Furthermore, influences that shift the sympathetic/parasympathetic balance, such as postural changes, will obviously affect this phase relationship, as well. These issues will be examined in detail in Chapter 6.
2.4.2 Pathologic States
The spectrum of disease states that alter autonomic regulation of cardiovascular function is almost as wide as the set of all diseases. Three types of pathologies are discussed here to illustrate the kinds of
- 37
-failure modes that exist in the cardiovascular control system, and how the system tries to compensate for the effects of these maladies.
Hypertension, or high blood pressure, is a collection of disease states in which the operation of the feedback loop of Figure 2.5 has gone awry. This may occur as the result of three different etiologies, First, the natural pressure sensor, or baroreceptor, may malfunction, as in renal hypertension [100]. In this case, the ANS is no longer able to detect properly the effect of its own actions. In particular, if the baroreceptors send fewer impulses to the brainstem than they should for a given pressure level, then the ANS will elicit an increase in cardiac output or vascular resistance until the pressure rises such that the baroreceptor signals appear normal. At that point, of course, the arterial pressure is higher than desired.
Another scenario leading to hypertension is an inappropriate overactivity of the cardiovascular effector organs despite proper baroreceptor performance. This state of affairs implies that the ANS has lost the ability to effect a diminution in cardiac output or peri-pheral resistance. Vascular smooth muscle hyperactivity is one such condition where this loss of end-organ control occurs. Unregulated secretion of a sympathetic agonist into the blood stream, for example by an epinephrine producing pheochromocytoma, will similarly result in hypertension that is out of the hands of the ANS.
The vast majority of cases of hypertension, however, can not be linked to these aforementioned etiologies. The most likely explanation for these cases appears to be an idiopathic resetting of the central
- 38
-setpoint for blood pressure control. Refering to Figure 2.5, this can be represented by an elevation in BPset'
A second type of pathologic state where cardiovascular regulation is altered is hemorrhage. The autonomic responses to acute blood loss are in many ways similar to those mentioned for postural changes, but are generally of greater magnitude. Increased sympathetic discharge elicits venous and arteriolar constriction, thereby reducing venous capacitance and increasing vascular resistance. These effects, along with an elevated heart rate and force of ventricular contraction, serve to maintain mean arterial blood pressure even in the face of a 10 loss of the blood volume. In more extensive hemorrhage, adrenal secretion of epinephrine further augments sympathetic tone, and an accelerated respiration and widened arteriovenous oxygen difference help compensate for the reduced oxygen carrying capacity of the circulation.
However, a curious phenomenon is frequently observed in both humans and laboratory animals that have lost a significant fraction of the blood volume. Large amplitude low frequency (roughly .05 Hz) oscilla-tions in heart rate and arterial blood pressure, as shown in Figure 2.6, often spontaneously appear. These 20-second rhythms have been termed Mayer waves [97], although their origin remains somewhat mysterious. The heart rate oscillations have been shown to be secondary to those in arterial pressure (presumably through the baroreflex) 95], and several theories have been proposed [106] to explain the pressure waves: 1) the triggering of a neural oscillator within the ANS, 2) the appearance of rhythmic smooth muscle contractions in arterial vessel walls, indepen-dent of the ANS, or 3) the development of a system resonance or
- 39
-ARTERIAL BLOOD PRESSURE. HEART RATE AND RESPIRATION
a
M h
111111ll
"I"I~'!11uuI1~[11~" · -" l Ollfllb
C
TIME (SECONDS)Figure 2.6. Example of Mayer waves in a conscious dog, elicited by 30 cc/kg hemorrhage. Note that oscillations in arterial blood pressure (a) and heart rate (b) have a period of roughly 20 seconds, which is much longer than the period of respiratory activity (c). Reproduced from
Madwed, 1986.
40
-instability due to some change in the operational parameters of the blood pressure control feedback loop. None of these tantalizing possi-bilities has yet been either well demonstrated or ruled out, despite active research in this area. One phase of this thesis research addresses these issues and is discussed in Chapter 7.
A final class of disease states that affect cardiovascular regula-tion, considered here, is the neuropathies. A neuropathic disorder could theoretically interfere with either afferent or efferent nerve conduction. The symptomatology associated with most neuropathies in which the ANS is involved, however, suggest sympathetic efferent nerve activity is most easily disrupted. The most common cardiovascular-related complaint in these disorders is postural hypotension leading to syrcopal (fainting) attacks upon standing, reflecting a loss of the sym-pathetically mediated compensatory mechanisms normally invoked in pos-tural changes.
Neuropathies are diseases that affect either the central nervous system or peripheral nerves. The first category includes spinal trauma and tabes dorsalis (tertiary syphilis) in which preganglionic sym-pathetic fibers are injured before they emerge from the spinal cord, pontine hemorrhage which disrupts the autonomic nuclei in the brainstem, and a rare degenerative disorder of unknown cause called idiopathic autonomic insufficiency or Shy-Drager syndrome. A prototypical peri-pheral neuropathy is that associated with diabetes mellitus. In this disease state, multiple peripheral sensory and motor nerves are often affected, leading to parasthesias and pareses. But the appearance of postural hypotension in affected individuals suggests sympathetic
41
-efferents, presumably postganglionic, may be disrupted by this disease as well. The analysis techniques developed in this thesis research may have utility in the early noninvasive detection of neuropathy in many disease states. This is discussed further in Chapter 6.
42
-ChaPtr 3:
ARRahes
TowarEd
Sudyng
Autonomic Rggulati n
3.1 System Compnnts and Signals f Interest
The control network that regulates the cardiovascular system may be studied as a whole or piece by piece. Both of these approaches have been employed in the numerous past investigations of this system. In taking the latter approach, one must decide how to split the control system into its component parts and then identify which components are to be studied. The splitting operation is somewhat arbitrary; for instance, it is artificial to consider the left ventricle functionally separate from the aorta and yet lump the aorta together with the rest of the systemic vasculature in our analysis. On the other hand, if this sort of division is done intelligently, we may be able to express the complicated behavior of the integrated system as the interaction of several more readily analyzed and understood functional blocks.
An important criterion in demarcating the functional blocks that comprise the control system is that the signals considered to pass from one block to the next be well defined. If these signals can be meas-ured, then analysis of the behavior of the blocks becomes feasible. Furthermore, if the communication of these signals between blocks can be interrupted, then the behavior of the blocks may also be studied in an "open-loop" configuration of the control network. It is important, how-ever, to reiterate the caution mentioned in Chapter 1: the procedure of opening the control loop may dramatically alter the operation of the very system we wish to study.
43
-satisfies the above criterion is portrayed in Figure 2.5. Again, briefly, the cardiovascular control system is divided into a pacemaker (the sino-atrial node), a ventricle, resistance vessels, capacitance vessels, a pressure sensor (or baroreceptor), and a central control ele-ment (taken to be the combined nuclei of the brainstem). The relevant signals that pass between these functional blocks include the pacemaker rate, ventricular output or flow, vascular impedance, systemic arterial blood pressure, and the various neural signals sent from the barorecep-tor to the central controller and from central controller to all effec-tor organs.
Arterial pressure is readily measured in humans or animals with a strain gauge either inserted into or placed in fluid contact with an arterial lumen. Cardiac output can be obtained on an instant to instant basis with either electromagnetic or ultrasonic flow probes implanted around the aortic root, or on a time-averaged basis less invasively using either Fick or indicator-dilution methods [100]. The real part of the vascular impedance, namely the resistance, can be estimated for each cardiac cycle by dividing the mean pressure by the mean flow rate for that beat. The pacemaker rate or heart rate is derived from the elec-trocardiogram as the instantaneous frequency of cardiac activations. Since the activations occur at discrete points in time, there are some subtleties in defining the heart rate between these events. This is discussed in detail in section 4.3. Neural signals are, however, techn-ically the most difficult to measure. In general, the nerves are acces-sible only through fairly invasive procedures, and even then carry a signal that is often difficult to discern from noise. The vast majority
44
-of previous analyses -of cardiovascular control, not surprisingly, have thus been based on the two most readily obtained system signals, heart rate and arterial blood pressure. A number of more invasive studies have also examined aortic flow and peripheral resistance, and a few have involved analyses of neural signals, particularly in the carotid sinus
nerve.
3.2 Mean Levels of Hemodynamic Variables
Undoubtedly the simplest analysis of hemodynamic regulation is a determination of mean values for the system variables. A set of such values for heart rate, arterial pressure, and cardiac output remains the standard form for characterizirng an individual's hemodynamic status in a critical care setting. Indeed, mean arterial pressure is likely the key indicator of vital organ perfusion, mean cardiac output is a good metric of cardiac function, and mean heart rate provides a measure of net sympathetic/parasympathetic balance. Furthermore, treatment regimens for essential hypertension are based almost entirely on steady state values of arterial pressure. (Actually, the most important measure for following antihypertensive therapy is the average diastolic pressure, which is not the same as the mean arterial pressure. Like mean pres-sure, however, the diastolic pressure measurement alone provides no information regarding the nature of fluctuations in blood pressure.)
The mean signal values, in effect, indicate the bias points at which the system components operate. Some additional understanding of the behavior of a few system elements is afforded by examining a component's output level when its input signal is experimentally clamped
45
-at various constant values, after the control loop has been opened. For instance, in 1934, Rosenblueth and Simeone [1171 applied constant fre-quency stimulation to the sympathetic and parasympathetic nerves and measured the change in heart rate. These workers, as well as others who conducted similar studies [92,119], presented input-output curves relat-ing the change in heart rate to the stimulus frequency. Their data demonstrates how different levels of sympathetic or vagal tone influence the operating or bias point of the sino-atrial node, but does not address the issue of fluctuations in autonomic tone around the operating point or of the heart rate response to such fluctuations.
Similarly, a number of studies have been conducted to investigate the effects of mean arterial blood pressure on the operating point of the baroreceptor reflex [5,41,48,76]. In these studies, the arterial baroreceptors were isolated and perfused at various mean pressures while the heart rate and systemic arterial blood pressure were recorded. Although the importance of the pulsatile nature of blood pressure was addressed by several investigators [5,41,67,126,131] (and a pulsatile component was therefore added to the applied mean perfusion pressure), the critical issue of frequency-dependent responses to pressure fluctua-tions was ignored.
3.3
Sontaneous
Hedynamic Flucutin
An analysis of spontaneous fluctuations in the signals generated by a control system often provides far more insight into the operation of the system than does knowledge of the signal means. This is well exem-plified by the furnace-thermostat analogy. The mean temperature in a