HAL Id: hal-03127007
https://hal.sorbonne-universite.fr/hal-03127007
Submitted on 1 Feb 2021
HAL is a multi-disciplinary open access archive for the deposit and dissemination of sci-entific research documents, whether they are pub-lished or not. The documents may come from teaching and research institutions in France or abroad, or from public or private research centers.
L’archive ouverte pluridisciplinaire HAL, est destinée au dépôt et à la diffusion de documents scientifiques de niveau recherche, publiés ou non, émanant des établissements d’enseignement et de recherche français ou étrangers, des laboratoires publics ou privés.
muscle does not affect energy metabolism or exercise
capacity
Lewin Small, Lars Ingerslev, Eleonora Manitta, Rhianna Laker, Ann Hansen,
Brendan Deeney, Alain Carrié, Philippe Couvert, Romain Barrès
To cite this version:
Lewin Small, Lars Ingerslev, Eleonora Manitta, Rhianna Laker, Ann Hansen, et al.. Ablation of DNA-methyltransferase 3A in skeletal muscle does not affect energy metabolism or exercise capacity. PLoS Genetics, Public Library of Science, 2021, 17 (1), pp.e1009325. �10.1371/journal.pgen.1009325�. �hal-03127007�
RESEARCH ARTICLE
Ablation of DNA-methyltransferase 3A in
skeletal muscle does not affect energy
metabolism or exercise capacity
Lewin SmallID1, Lars R. IngerslevID1, Eleonora ManittaID1, Rhianna C. LakerID1, Ann N. HansenID1, Brendan DeeneyID1, Alain Carrie´2, Philippe Couvert2, Romain BarrèsID1* 1 Novo Nordisk Foundation Center for Basic Metabolic Research, Faculty of Health and Medical Sciences,
University of Copenhagen, Copenhagen, Denmark, 2 Sorbonne Universite´ -INSERM UMR_S 1166 ICAN, Pitie´-Salpêtrière Hospital, Paris, France
*barres@sund.ku.dk
Abstract
In response to physical exercise and diet, skeletal muscle adapts to energetic demands through large transcriptional changes. This remodelling is associated with changes in skele-tal muscle DNA methylation which may participate in the metabolic adaptation to extracellu-lar stimuli. Yet, the mechanisms by which muscle-borne DNA methylation machinery responds to diet and exercise and impacts muscle function are unknown. Here, we investi-gated the function of de novo DNA methylation in fully differentiated skeletal muscle. We generated muscle-specific DNA methyltransferase 3A (DNMT3A) knockout mice
(mD3AKO) and investigated the impact of DNMT3A ablation on skeletal muscle DNA meth-ylation, exercise capacity and energy metabolism. Loss of DNMT3A reduced DNA methyla-tion in skeletal muscle over multiple genomic contexts and altered the transcripmethyla-tion of genes known to be influenced by DNA methylation, but did not affect exercise capacity and whole-body energy metabolism compared to wild type mice. Loss of DNMT3A did not alter skeletal muscle mitochondrial function or the transcriptional response to exercise however did influ-ence the expression of genes involved in muscle development. These data suggest that DNMT3A does not have a large role in the function of mature skeletal muscle although a role in muscle development and differentiation is likely.
Author summary
Skeletal muscle is a plastic tissue able to adapt to environmental stimuli such as exercise and diet in order to adapt energetic demand. One of the ways in which skeletal muscle can rapidly react to these stimuli is DNA methylation. This is when chemical groups are attached to DNA, potentially influencing the transcription of genes. We investigated the function of DNA methylation in skeletal muscle by generating mice that lacked one of the main enzymes responsible forde novo DNA methylation, DNA methyltransferase 3A
(DNMT3A), specifically in muscle. We found that loss of DNMT3A reduced DNA meth-ylation in muscle however this did not lead to differences in exercise capacity or energy
a1111111111 a1111111111 a1111111111 a1111111111 a1111111111 OPEN ACCESS
Citation: Small L, Ingerslev LR, Manitta E, Laker
RC, Hansen AN, Deeney B, et al. (2021) Ablation of DNA-methyltransferase 3A in skeletal muscle does not affect energy metabolism or exercise capacity. PLoS Genet 17(1): e1009325.https://doi.org/ 10.1371/journal.pgen.1009325
Editor: Yvonne Bo¨ttcher, University of Oslo,
NORWAY
Received: July 29, 2020 Accepted: January 4, 2021 Published: January 29, 2021
Peer Review History: PLOS recognizes the
benefits of transparency in the peer review process; therefore, we enable the publication of all of the content of peer review and author responses alongside final, published articles. The editorial history of this article is available here:
https://doi.org/10.1371/journal.pgen.1009325 Copyright:© 2021 Small et al. This is an open access article distributed under the terms of the
Creative Commons Attribution License, which permits unrestricted use, distribution, and reproduction in any medium, provided the original author and source are credited.
Data Availability Statement: The authors confirm
that all data underlying the findings are fully available without restriction. Transcriptomic and DNA methylation data have been deposited in a
metabolism. This suggests that DNMT3a is not involved in the adaptation of skeletal mus-cle to diet or exercise.
Introduction
Regulation of gene expression is a critical process in all cells and plays a defining role in achiev-ing tissue- and cell-specificity, in the face of an identical genetic code. The control of gene expression is dependent upon transcription factors which, upon activation, bind to transcrip-tion factor-specific DNA motifs in promoter and/or enhancer regions, recruit co-factors and initiate transcription. Epigenetic modifications to DNA and histones add an additional level of control to gene expression by altering the structure of DNA and subsequent accessibility of transcriptional machinery to gene regulatory elements. DNA methylation is a major epigenetic modification that occurs at the 5’ position of cytosine residues within a cytosine-guanine (CpG) dinucleotide resulting in 5-methylcytosine. The presence or absence of 5-methylcyto-sine modulates the recruitment of methyl binding domain (MBD) proteins to the DNA and depending on the genomic context, may regulate transcription factor binding [1].
Skeletal muscle is a highly plastic tissue that displays a robust adaptive response to environ-mental stimuli such as physical exercise and diet. Muscle contraction results in large-scale transcriptional remodelling of metabolic, antioxidant and contractile genes which participate in the adaptation to the increased demands placed on the tissue [2]. This transcriptional remodelling is associated with changes in DNA methylation after both acute exercise [3–5] and exercise training [5–7]. For example, intense exercise in humans (80% maximal aerobic capacity) resulted in an immediate reduction in promoter methylation ofPPARGC1A, TFAM, MEF2A and PDK4 and expression levels of these genes were upregulated 3 hours later in an
intensity-dependent manner [3]. However, exercise-mediated demethylation of promoter regions is transient and re-methylation quickly occurs, within 1–3 hours [3], suggesting possi-ble directed methylation. Changes in nutritional status, either through diabetes status [8], fast-ing [9], weight loss [10] or diet [7,11] have also been shown to alter DNA methylation in skeletal muscle.
Despite an abundance of evidence that environmental stimuli such as exercise and diet can affect DNA methylation in skeletal muscle [12,13], the mechanisms by which DNA methyla-tion machinery responds to these stimuli are still unclear. The regulamethyla-tion of DNA methylamethyla-tion is complex and involves multiple enzymes that actively methylate (DNA methyltransferases, DNMTs) or oxidize for potential demethylation (Ten-eleven translocation enzymes, TETs) of cytosine residues. DNA may also be demethylated passively (non-enzymatically) during cell division. The classical model of DNA methylation proposes that DNMT1 is responsible for maintaining DNA methylation marks through cell divisions, while DNMT3A and DNMT3B are thought to be primarily responsible forde novo methylation events [14]. Early work in the field observed that knockdown ofDNMT3B in muscle cells in vitro could impede fatty
acid-induced methylation of thePPARGC1A promoter [8]. However, asDnmt3a is the most highly
expressed DNMT isoform in skeletal muscle [15] we decided to focus on the role of DNMT3A in differentiated skeletal muscle to investigate the importance ofde novo DNA methylation in
the response of skeletal muscle to environmental stimuli (exercise and diet).
We generated muscle-specific DNMT3A knockout mice (mD3AKO) and investigated the impact of the loss of muscle DNMT3A on skeletal muscle DNA methylation, exercise capacity, energy metabolism and mitochondrial function. Additionally, by integrating DNA
publicly available database (https://www.ncbi.nlm. nih.gov/geo/query/acc.cgi?acc=GSE152349) and numerical data underlying all figures is provided in a spreadsheet in thesupporting information(S2 Spreadsheet).
Funding: The Novo Nordisk Foundation Center for
Basic Metabolic Research is an independent research center at the University of Copenhagen, partially funded by an unrestricted donation from the Novo Nordisk Foundation (NNF18CC0034900). L.S. is supported by a research grant from the Danish Diabetes Academy, which is funded by the Novo Nordisk Foundation (NNF17SA0031406). The funders had no role in study design, data collection and analysis, decision to publish, or preparation of the manuscript.
Competing interests: The authors have declared
methylation and transcriptomics data, we report novel DNMT3A targets in differentiated skel-etal muscle, regulated by promoter/gene body methylation.
Results
mD3AKO mice have reduced skeletal muscle DNA methylation
In order to deleteDnmt3a in muscle, we utilized the Cre-lox system with a muscle creatine
kinase promoter driving Cre recombinase expression. mD3AKO mice had substantially reduced DNMT3A at the protein level compared to WT mice, specifically in skeletal muscle and heart and not in other tissues such as liver, kidney or brain (Fig 1A and 1B). DNA methyl-ation analysis and RNA sequencing were performed on thesoleus muscle as this muscle
dis-plays dynamic de-methylation and then re-methylation of metabolically important genes following contraction [3]. mRNA levels ofDnmt3a showed a ~60% reduction in the soleus,
EDL andquadriceps muscles of mD3AKO mice compared to wild type (WT) mice (Figs1C
andS1A). As mCK-Cre is expressed quite late during skeletal muscle differentiation [16], the residualDnmt3a expression likely comes from satellite cells and non-muscle cells (immune
cells, fibroblasts, adipocytes). mRNA levels ofDnmt3b, the other major de novo DNA
methyl-transferase isoform, showed no compensatory upregulation in mD3AKO muscle and was expressed at a much lower level thanDnmt3a (Fig 1C). To quantify DNA methylation, we per-formed reduced representation bisulfite sequencing (RRBS) on thesoleus muscle of WT and
mD3AKO mice. There was a small but significant reduction in global DNA methylation (per-centage of quantified CpG sites that were methylated) in the muscle of mD3AKO animals (Fig 1D). This corresponded to reduced methylation in mD3AKO muscle compared to WT in all genomic contexts examined (Fig 1E) however, the largest fold changes were in CpG islands (CGI,Fig 1F). After correcting for multiple testing (False Discovery Rate, FDR 5%), we found 1422 differentially methylated clusters between WT and mD3AKO muscle. 1386 were hypo-methylated and 36 were hyperhypo-methylated. Methylation at 9655 promoter regions was quanti-fied, 184 promoter regions were significantly hypomethylated and 13 promoter regions were significantly hypermethylated in mD3AKO muscle compared to WT (Fig 1G). Gene ontology analysis (gene ontology—biological process) of hypomethylated clusters included significantly enriched terms related to muscle development (S1B Fig), while there was no significant enrich-ment of terms from hypermethylated regions. Gene ontology analysis of hypomethylated pro-moter regions revealed only two terms: “inhibition of cysteine-type endopeptidase activity” and “zymogen inhibition” (S1C Fig).
DNMT3A knockout in skeletal muscle does not affect exercise capacity or
the transcriptional response to acute exercise
In order to assess exercise capacity in mD3AKO mice, we investigated both the capacity for these mice to run voluntarily, with free access to running wheels, as well as during a forced treadmill exercise tolerance test. For both exercise regimens, we observed that males ran a shorter distance compared to females. mD3AKO mice with free access to a running wheel ran a similar distance and speed compared to WT mice (Fig 2A and 2B). Similarly, there was no genotype-specific differences in the distance run during forced exercise (Fig 2C). Blood lactate, a measure of glucose utilization during exercise, showed an expected increase after exercise however there was no effect of genotype (Fig 2D).
In a separate cohort of 12-week-old mice, we assessed the transcriptional response to exercise in WT and mD3AKO mice by harvestingsoleus muscle 60 minutes following a 30-minute
Fig 1. Ablation of DNMT3A in muscle reduces DNA methylation over multiple genomic contexts. (A) Western blot
of DNMT3A protein in multiple tissues from WT and mD3AKO mice and (B) quantitation of DNMT3A protein in skeletal muscle, analysed by 2-way ANOVA, n = 3. (C)Dnmt3 isoform mRNA expression (quantified by RNA-seq) in
thesoleus muscle analysed by individual t-tests, n = 12. (D) Percentage of total methylated cytosine residues quantified
by RRBS insoleus muscle, analysed by t-test and (E) Quantified CpG methylation in different genomic contexts,
analysed by 2-way ANOVA. (F) Fold-change of methylated cytosine residues comparing mD3AKO to WT muscle in different genomic contexts. (G) Volcano plot of differentially methylated promoter regions, red points are significant, n = 23–24 mice.�P < 0.05,��P < 0.005,���P < 0.0005, † P < 0.0005 main effect of genotype. Data show the mean
(bar) with individual data points or violin plots.
https://doi.org/10.1371/journal.pgen.1009325.g001
Fig 2. Ablation of DNMT3A in skeletal muscle does not affect exercise capacity or the transcriptional response to acute exercise. In a cohort of 32-36-week-old
chow-fed mice, (A) voluntary wheel running distance and (B) speed in mice averaged for a 24-hour period from a period of 2 weeks, n = 8–10. (C) Distance run during a graded exercise tolerance test and (D) blood lactate before and directly after test, n = 6–8. Analysed by 2-way ANOVA for a main effect of genotype and a main effect of sex (A-C) or a main effect of genotype and a main effect of exercise, D. (E) Simplified schematic of acute running treadmill experiment in a separate cohort of 12-week old mice. (F) Number of significantly differentially expressed genes in thesoleus muscle when comparing genotype, exercise and a genotype/
exercise interaction. Expression of exercise responsive genes (G)Nr4a3, (H) Hk2, (I) Ppargc1a and (J) Atf3 in the soleus muscle of combined male and female mice,
n = 5–7.♀♂ P < 0.05 main effect of sex, # P < 0.05 main effect of exercise. Data show the mean (bar) with individual data points.
genes with a significant change in expression between the exercised and sedentary muscles (FDR 5%), while 56 were altered by genotype. However, there were no genes that had a significant exer-cise/genotype interaction (Fig 2F). Well-characterized exercise-responsive genes such asNr4a3, Ppargc1a and Hk2 (Fig 2G–2I) showed robust increases in expression after exercise but here again, we found no interaction between exercise and genotype. Activating transcription factor 3 (Atf3) displayed the largest increase in expression after exercise (~15 fold increased,Fig 2J).
Because few differences were found in exercise capacity or the transcriptional response to exer-cise between WT and mD3AKO mice, we used the methylation and RNA-seq data generated fromsoleus muscle to investigate the interaction between methylation and mRNA changes in
response to genotype and exercise. When the changes in muscle DNA methylation were visual-ized by principal component analysis (PCA), a technique used to separate multi-dimensional data based on variance, there was a clear separation of the muscle methylation data by genotype (Fig 3A), however no clear separation by exercise (Fig 3B), suggesting that ablation of DNMT3A has a far greater effect on methylation in muscle than exercise. This was also evident when look-ing at the number of differentially methylated regions when comparlook-ing the effect of genotype to the effect of time after exercise (S2A Fig). Interestingly, the RNA-seq data showed the opposite result, with multidimensional scaling (MDS) plots highlighting a far greater separation by exercise (Fig 3D) than genotype (Fig 3C). A separation by sex from the RNA-seq data was also apparent (Fig 3C). Global DNA methylation after exercise was not altered by time after exercise however, there was a clear reduction in DNA methylation in the muscle of mD3AKO mice (S2B Fig).
mD3AKO mice have normal body composition, whole-body energy
expenditure, substrate utilization and glucose tolerance
To investigate if DNMT3A in skeletal muscle contributes to whole-body energy metabolism, we measured body composition, whole-body energy expenditure (EE) and glucose tolerance in 30-week-old WT and mD3AKO mice fed a standard chow diet. mD3AKO had a similar body weight, lean mass and fat mass compared to WT mice (Fig 4A–4D). We observed no dif-ference in substrate utilization (RER,Fig 4E and 4F) or EE (Fig 4G and 4H) between WT and mD3AKO mice, although these measurements displayed clear diurnal variations, as expected. Male mice had a significantly higher rate of EE than female mice (Fig 4G and 4H) and there was a positive correlation between EE and lean mass regardless of sex and diet however this was not altered by genotype (Fig 4I). Glucose tolerance, fasting blood glucose, plasma insulin and NEFA levels were not affected by genotype (Fig 4J–4N) however, fasting plasma insulin levels were substantially higher in male mice (Fig 4M). Muscle mass, myofiber size and fiber composition (determined by analysis of gene transcription of slow and fast twitch muscle markers) were all similar between WT and mD3AKO mice (S3 Fig).
mD3AKO mice have a normal response to high-fat feeding
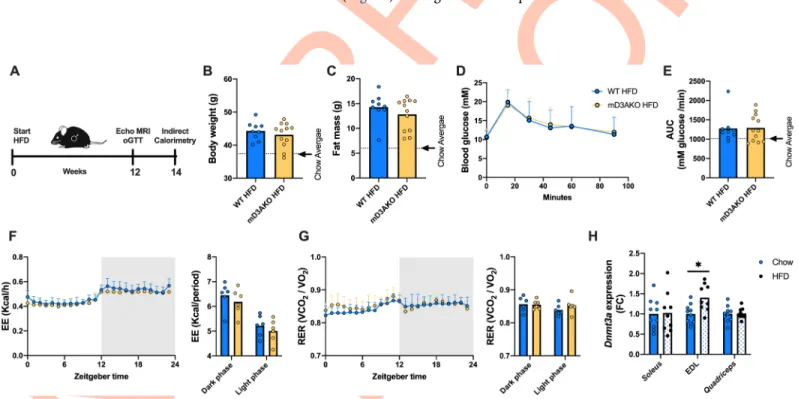
We next wanted to determine if skeletal muscle DNMT3A had a role in high fat diet (HFD)-induced glucose intolerance or adiposity as a previous investigation found that DNMT3A abla-tion in adipose tissue improved glucose tolerance in mice fed a HFD but not in chow-fed mice [17]. Male WT or mD3AKO mice were fed a HFD (45% calories from fat) for a period of 12 weeks after which body composition was analysed and a glucose tolerance test was performed. Indirect calorimetry was performed 2 weeks later (14 weeks of diet,Fig 5A). HFD-fed mice had substantially increased body and fat mass compared to chow-fed mice however there was no effect of genotype (Fig 5B and 5C). Similarly, there was no difference in glucose tolerance between HFD-fed mD3AKO and WT mice, although HFD-fed mice had a higher glucose excursion than chow-fed mice indicating relative glucose intolerance (Fig 5D and 5E). The
whole-body EE and RER of HFD-fed mD3AKO mice were similar to WT mice (Fig 5F and 5G). Independent of genotype, HFD-feeding caused an expected decrease in 24-hour RER compared to chow-fed mice indicating a greater reliance on fat oxidation (Figs4Eand5F). Additionally, we analysedDnmt3a expression in the muscle of WT mice fed either chow or a
HFD. 16–18 weeks of high-fat feeding did not alter the expression ofDnmt3a in soleus or quadriceps muscle compared to age-matched chow-fed mice however, Dnmt3a expression was
increased ~1.4 fold in the EDL of HFD-fed mice (Fig 5H).
Loss of DNMT3A in muscle does not affect mitochondrial content or
function
As skeletal muscle is responsible for a substantial proportion of whole-body energy utili-zation [18] and DNMT3A has been reported to be present in the mitochondria [19] we Fig 3. Genotype has a stronger effect on skeletal muscle DNA methylation than exercise while the opposite is true of skeletal muscle mRNA abundance. PCA of
DNA methylation data from RRBS labelled for (A) genotype and (B) time after exercise. MDS plots of RNA-seq data labelled for (C) genotype and (D) time after exercise. Fromsoleus muscle of 12-week old male and female WT and mD3AKO mice sacrificed 10, 30 or 60 minutes after 30 minutes of treadmill running, or not
exercised (rest).
investigated if DNMT3A is required for proper mitochondrial function. Thesoleus and
EDL from mD3AKO mice had similar abundances of OXPHOS complexes to WT mus-cle, although EDL from male mice had a significant increase in complex III abundance compared to female mice (Fig 6A–6C). Similarly,soleus mtDNA copy number, a measure
of mitochondrial content, was not different between genotypes although male mice dis-played an increase insoleus mtDNA copy number compared to females (Fig 6D). Next, we isolated muscle satellite cells from male mD3AKO and WT mice to investigate mito-chondrial functionin vitro. mD3AKO-derived primary myotubes had a significant (70%)
reduction in mRNA levels ofDnmt3a only at day 5 of differentiation (harvested for RNA
in parallel with the Seahorse experiments) (Fig 6E). Compared to myotubes derived from WT mice, 5-day differentiated primary myotubes from mD3AKO mice showed no differ-ences in basal or FCCP-uncoupled oxygen consumption (Fig 6F) or the extracellular acidification rate (Fig 6G) during Seahorse experiments.
Fig 4. mD3AKO mice have normal body composition, glucose tolerance and energy expenditure. (A) Body weight, (B) lean
mass, (C) fat mass and (D) percentage of body mass in chow-fed 30-week-old male and female WT and mD3AKO mice, n = 12– 20. (E) Diurnal respiratory exchange ratio and (F) average during the light and dark phase. (G) Diurnal energy expenditure and (H) total during the light and dark phase, measured in 32-36-week-old chow-fed male and female WT and mD3AKO mice, n = 4. (I) ANCOVA comparing the relationship between lean mass and energy expenditure in WT and mD3AKO mice combining sex and diet, n = 14. (J) Oral glucose tolerance test curves, (K) the area under the curve of the oGTT curves and (L) blood glucose after a 6 hour fast in chow-fed 30-week-old male and female WT and mD3AKO mice. (M) Plasma insulin and (N) plasma NEFA from blood taken after sacrifice in 6-hour fasted 36-40-week-old mice. n = 9–15. Analysed by 2-way ANOVA for a main effect of genotype and a main effect of sex.♀♂ P < 0.05 main effect of sex. Data show the mean (bar) with individual data points or mean +SD.
https://doi.org/10.1371/journal.pgen.1009325.g004
Fig 5. Ablation of DNMT3A in skeletal muscle does not affect the whole-body response to high-fat feeding. (A) 18-week-old male WT and mD3AKO mice were
fed a HFD for a period of 12 weeks after which body composition and glucose tolerance was determined. Indirect calorimetry was performed at 14 weeks of HFD. (B) Body weight, (C) fat mass, (D) oral glucose tolerance test curves and (E) the area under the curve of the oGTT curves. The mean of the chow values is depicted by the dotted line, n = 9–12. (F) Respiratory exchange ratio and (G) energy expenditure, n = 6. (H)Dnmt3a expression in the soleus, EDL and quadriceps muscles of WT chow
and HFD-fed mice compared to the housekeeping gene18S, fold-change compared to WT, n = 9–10. Analysed by individual t-tests.�P < 0.05. Data show the mean
(bar) with individual data points or mean +SD.
Loss of DNMT3A alters methylation and transcription of genes involved in
skeletal muscle development
We found 56 genes differentially expressed between WT and mD3AKOsoleus muscle (Fig 7A). Of those, 43 genes were significantly upregulated while 13 were significantly downregu-lated (Fig 7B). The most upregulated gene wasMyh8 (~11-fold increase compared to WT)
while the most downregulated wasDnmt3a. When percent methylation of promoter regions
was compared to log fold-changes (log FC) of the corresponding transcripts, comparing mD3AKO muscle to WT muscle, there was a small but significant negative correlation (R = -0.026) suggesting that transcriptional changes between WT and mD3AKO muscle are on the whole not caused by altered promoter methylation (Fig 7C). Altered gene body methylation (comparing muscle between the different genotypes) had a stronger negative correlation with RNA abundance than promoter methylation (R = 0.046,Fig 7D). Promoter and gene body methylation of differentially expressed genes after exercise displayed a similar lack of correla-tion to gene expression (S4 Fig). We found 8 genes which displayed both significantly altered DNA methylation (either at the promoter region or within the gene body) and altered tran-script level between WT and mD3AKOsoleus muscle, all of these had a reduction in DNA
methylation and an increase in expression when comparing between the muscle of mD3AKO and WT mice (Fig 7E). Gene ontology analysis of differentially expressed genes revealed enriched terms mostly related to a downregulation of DNA methylation and DNA methylation Fig 6. Loss of DNMT3A does not affect skeletal muscle mitochondrial function. (A) Representative blot and densitometry of OXPHOS complexes in the (B)soleus
and (C) EDL muscle and (D) mtDNA copy number in thesoleus muscle of 12-week old mice, analysed by individual 2-way ANOVAs for a main effect of genotype and
a main effect of sex, n = 11–13. (E)Dnmt3a expression in primary myotubes isolated from male WT and mD3AKO mice at differentiation day 0, 1, 3 and 5 compared
to the housekeeping gene18S, fold-change compared to WT, n = 3, analysed by individual t-tests, corrected for multiple comparisons. (F) Oxygen consumption rate
and (G) extracellular acidification rate determined using the Seahorse XF Analyser Mito Stress Test in the same myotubes at differentiation day 5. Drug treatments were oligomycin, FCCP and antimycin A + rotenone. n = 3, analysed by individual t-tests of the average of each state.♀♂ P < 0.05 main effect of sex,��P < 0.005.
Data show the mean (bar) with individual data points or mean +SD.
relating to embryonic development (Fig 7F). Additionally, genes related to “metabolism of xenobiotics and glutathione” were significantly downregulated while genes related to the term “muscle filament sliding” were significantly upregulated. Several genes involved in muscle cell development includingMyh8, a perinatally expressed myosin heavy chain isoform and Pax7
andMyog, two transcription factors crucial for normal muscle cell development, were
signifi-cantly upregulated in the skeletal muscle of mD3AKO mice (Fig 7G). Genes involved in the “development” gene ontology term have a star next to their gene symbol (Fig 7B).
In order to validate some of the differentially methylated/expressed genes found insoleus
muscle (Fig 7E) in other muscle types, we performed targeted bisulfite pyrosequencing and RT-qPCR on the EDL (white, mainly type II fibers) andquadriceps (mixed, type I and II fibers)
muscles from a separate cohort of mice. We includedH19 in this analysis, due to presence of a
differentially methylated CpG site in the gene body and excludedRhoh and Rab17 due to low
expression levels (CPM < 1),Sim2 due to technical issues with pyrosequencing as well as the
uncharacterized gene,1600002K03Rik. Similarly to the RRBS data in soleus muscle (Fig 8A), all the regions studied (H19, Aldh1l1, Agtrap, Pax7, and Eef1a1) showed a clear and significant
reduction in methylation when comparing mD3AKO to WT in both the EDL andquadriceps
muscles in all of the CpG sites studied, apart from the first CpG measured in theH19 cluster
(Fig 8B). However, when examining levels of the corresponding transcripts, only 3 of the 5 tar-gets (H19, Aldh1l1 and Agtrap) displayed a similar increase in expression in the EDL and quadriceps muscles (Fig 8D) compared to thesoleus muscle (Fig 8C) when comparing
mD3AKO to WT mice. Together, these data suggest that DNMT3A targets regions in multiple muscle types that are associated with muscle type-dependent increases in gene transcription.
Discussion
There is substantial evidence that exercise and diet can alter DNA methylation in skeletal mus-cle tissue. However, it is currently unmus-clear both by which mechanisms DNA methylation is altered and if these changes influence skeletal muscle physiology. In order to investigate the role ofde novo DNA methylation in these processes, we utilized a mouse model with
DNMT3A ablated specifically in mature muscle (mD3AKO mice). Due to the major role of DNMT3A in embryonic and early-life development (most whole-body DNMT3A-null mice die before 4-weeks of age [20]), we wanted to use a model in which DNMT3A was knocked out only in fully differentiated skeletal muscle fibers (Fig 6E) in order to remove the possibility that exercise or metabolic phenotypes were driven by changes in muscle differentiation. DNMT3A protein levels were also reduced in the heart however, as few differences were found in whole-body energy metabolism or the response to exercise, we did not further examine the impact of DNMT3A ablation in heart.
Knockout of DNMT3A substantially altered the DNA methylome of skeletal muscle, evi-denced by robust separation of genotypes after principal component analysis. This separation was far greater than the separation following exercise, which suggests that ablation of
DNMT3A has a greater impact than exercise on DNA methylation in skeletal muscle. Fig 7. Ablation of DNMT3A in skeletal muscle alters transcription of differentially methylated genes and genes involved in embryonic development. (A)
Volcano plot of all transcripts between the muscle of WT and mD3AKO mice, significant differential expression is indicated by red dots. (B) Heatmap of differentially expressed transcripts between WT and mD3AKO muscle, displayed as LogFC compared to the mean of the WT male rest group,�represent
developmental genes. Change in % methylation in (C) promoter regions and (D) gene bodies vs LogFC of RNA abundance of mD3AKO muscle compared to WT muscle, showing significant inverse correlation (simple linear regression). (E) Genes that are both significantly differentially expressed and have significantly altered DNA methylation within the promoter region or gene body between WT and mD3AKO muscle. (F) Significant GO-BP (gene ontology—biological processes) terms from the differentially expressed transcripts. (G) mRNA abundance of significantly differentially expressed genes involved in muscle development from RNA-seq data, expressed as fold over WT. Fromsoleus muscle of 12-week old male and female WT and mD3AKO mice, n = 12,�Padj < 0.05,���
Padj < 0.0005. Data show the mean (bar) with individual data points.
However, global DNA methylation measured as a percentage of quantified CpG sites was reduced by an average of only ~1% (WT mice ~25%, mD3AKO mice ~24%). This suggests that a large proportion of DNA methylation in skeletal muscle is static after development and this methylation is likely maintained by DNMT1 rather than thede novo methyltransferases.
Interestingly, this loss of DNA methylation occurs in all genomic contexts studied which sug-gests thatde novo methylation catalysed by DNMT3A is not specific to promoters or CGIs.
Potentially, the minor global hypomethylation of DNA caused by DNMT3A ablation may indicate a loss of the maintenance function of DNMT3A [21]. Supporting this idea is the dif-ferential methylation and transcription of the imprinted geneH19, which is normally
main-tained in a semi-methylated state (paternal allele is methylated). Despite this, if we plot change in promoter DNA methylation, there is a clear bias for a loss of methylation if we compare mD3AKO to WT muscle (Fig 1F).
We found no difference in either voluntary or forced exercise capacity between WT and mD3AKO mice. Similarly, the transcriptional response to acute exercise in skeletal muscle was the same between genotypes suggesting thatde novo methylation by DNMT3A does not
medi-ate exercise-responsive transcription. Comparably, we found that acute exercise causes a much more robust effect on the transcriptome than on the methylome. This would suggest that much of the transcriptomic response to acute exercise may not be driven byde novo CpG
methylation/demethylation. A similarly small overlap between significantly altered promoter methylation and corresponding transcripts after exercise was found in a previous investigation performed by our lab in human skeletal muscle [7]. As acute exercise is associated with demethylation of exercise-responsive genes [3], ablation of enzymes participating in DNA demethylation such as the TET enzymes, instead of thede novo DNA methyltransferases, may
have caused more effects on the transcriptome after exercise. Yet, it was speculated thatde novo DNA methyltransferase activity was needed to remethylate exercise-demethylated gene
promoters and shut down transcription [3]. If such a mechanism is at play, our data showing that transcription after exercise is not altered in skeletal muscle lacking DNMT3A suggest that DNMT3A does not participate inde novo methylation of exercise-demethylated genes.
As skeletal muscle is responsible for a large proportion of postprandial glucose disposal [22] we examined glucose metabolism in mD3AKO mice. Similar to a previous report, ablation of DNMT3A in the muscle of chow-fed mice did not affect glucose tolerance or fasting blood glu-cose levels [23]. Additionally, there was no difference in glucose tolerance between genotypes in male mice fed a HFD for a period of 12 weeks despite an expected significant increase in body weight and fat mass and a worsening of glucose tolerance in HFD-fed mice compared to chow-fed mice. This suggests that DNMT3A does not impact on the adaptation of muscle to a high-fat diet. This was not the case in adipose tissue where ablation of DNMT3A has been reported to improve glucose tolerance in mice fed a HFD, but not in chow-fed mice [17]. Unlike the adipose tissue which displays a clear upregulation ofDnmt3a expression in obese
Fig 8. Hypomethylation of specific regions in mD3AKO muscle is consistent over multiple skeletal muscle types. Analysis of gene body/
promoter methylation and transcription of putative DNMT3A target genes,H19, Aldh1l1, Agtrap, Pax7 and Eef1a1. (A) CpG methylation of
significantly differentially methylated gene body/promoter regions fromsoleus RRBS data, FDR 5%, n = 3–24 (some CpG sites were only
detected in some samples). (B) CpG methylation of the same regions from targeted bisulfite pyrosequencing in the EDL andquadriceps muscles
of a separate cohort of male WT and mD3AKO mice, n = 10, analysed by individual t-tests between WT and mD3AKO for each muscle, corrected for multiple comparisons (total number of CpG sites analysed). (C) Significantly differentially expressed transcripts from the corresponding genes fromsoleus RNA-seq data, FC compared to WT, n = 12, FDR 5%. (D) Gene expression of the same genes by qPCR in the
EDL andquadriceps muscles compared to the housekeeping gene 18S of a separate cohort of male WT and mD3AKO mice, FC compared to
WT, n = 5–10 (due to low expression of some genes, samples with CT values over 40 were excluded), analysed by 2-way ANOVA for a main effect of genotype.�AdjP < 0.0001 for each CpG site (both muscles). † P < 0.05 main effect of genotype. Data show the mean with individual
data points.
mice or mice fed a HFD [17,24], we found little difference inDnmt3a expression in skeletal
muscle between age matched chow and 16–18 week HFD-fed mice. This is opposed to a study reporting a ~2-fold increase inDnmt3a expression in the skeletal muscle of 3-month HFD-fed
mice compared to chow-fed controls [17].
There are several reports that suggest DNMT3A may have a role in influencing mitochon-drial DNA (mtDNA) methylation [19,25,26], potentially impacting mitochondrial function. However, the presence of cytosine methylation in mtDNA has been questioned and may be largely overestimated due to incomplete bisulfite conversion of coiled mtDNA [27]. The other
de novo DNA methyltransferase isoform, DNMT3B, plays a role in the regulation of
mitochon-drial density in skeletal muscle cells by fatty acid-induced methylation of thePPPARC1A
pro-moter [8]. In the current study, no differences were found in skeletal muscle mitochondrial content, mitochondrial function in isolated muscle cells or energy expenditure at a whole-body level between WT and mD3AKO mice suggesting that DNMT3A is not important for the regulation of mitochondrial function or density in mature skeletal muscle.
One advantage of the current study is that DNA methylation and mRNA abundance were determined from the samesoleus muscle and therefore the relationship between altered DNA
methylation and transcription can be examined. DNA methylation, both at promoter regions and in gene bodies, displayed a slight inverse correlation with transcript levels of the corre-sponding genes, with a stronger correlation with gene bodies than promoter regions. However, after multiple correction, only 8 genes displayed both a significant reduction in methylation (in the promoter region or gene body) and a corresponding increase in gene expression (Fig 7E). A similar lack of correlation between changed promoter methylation and gene transcription was observed in genes that were differentially expressed during exercise. This is comparable to reports that describe a low overlap between differentially methylated promoter regions and dif-ferentially expressed transcripts after exercise training [7,28] or exposure to a short term HFD in human skeletal muscle [11]. It is possible that differential methylation of genomic enhancer regions upstream or downstream of promoter regions may have a larger role in regulation of transcription which were not captured with this analysis, due to the bias of RRBS towards CpG islands. Genes that did change with genotype were part of gene ontology sets related to DNA methylation, glutathione metabolism and muscle filament sliding. Altered glutathione metabo-lism may be a consequence of reduced DNA methylation as the substrate for cytosine methyla-tion, s-adenosyl methionine shares the same amino acid precursors as glutathione: methionine and homocysteine [29]. Together, this dataset greatly expands the known DNMT3A targets in skeletal muscle [23,30] (evidenced by reduced promoter/gene-body methylation and a corre-sponding increase in the transcript level) and indicates possible enhancer interactions govern-ing the other differentially expressed genes. Additionally, 5 putative DNMT3A targets (H19, Aldh1l1, Agtrap, Pax7 and Eef1a1) were validated in multiple skeletal muscles (soleus, EDL and quadriceps) displaying significant promoter/gene body hypomethylation in mD3AKO muscle.
In 3 of the targets (H19, Aldh1l1 and Agtrap), this was accompanied by an increase in the
tran-script level of the corresponding gene in all of the muscles studied.
There have now been several investigations utilizing muscle-specific DNMT3A knockout mice. When DNMT3A is knocked out employing Cre recombinase driven by a muscle satellite cell marker (Pax3), mice are smaller due to substantially reduced skeletal muscle mass and muscle regeneration is compromised [30]. When the Cre recombinase is driven by a muscle marker that is intermediate in muscle cell development (alpha-actin), mice have normal body and skeletal muscle mass however muscle regeneration is still compromised [23]. In the cur-rent study, Cre recombinase was driven by the muscle creatine kinase promoter which is expressed late in skeletal muscle cell development [16], and no effect of DNMT3A knockout was seen on body weight, skeletal muscle size or morphology, presumably as DNMT3A is still
present in satellite cells. However, loss of DNMT3A in skeletal muscle altered the transcription of genes involved in embryonic development and morphogenesis (Sim2, Eya4, Hoxc9, Cux1, Hoxa10, Wnt16, Elf3) as well as upregulating genes involved in muscle cell development such
asMyh8, Pax7 and Myog. Overexpression of the myogenic transcription factors Myog [31] and
Pax7 [32] has been reported to inhibit skeletal muscle growth and differentiation. This sug-gests that earlier deletion of DNMT3A in the process of skeletal muscle differentiation may have a more substantial effect on muscle function.
In conclusion, ablation of DNMT3A in differentiated skeletal muscle does not affect skeletal muscle size, exercise capacity, glucose metabolism or mitochondrial content or function despite having a substantial effect on muscle DNA methylation. Additionally, this investigation revealed that changes in DNA methylation and gene transcription in skeletal muscle in response to acute exercise are not driven by DNMT3A and identified multiple novel
DNMT3A targets over different skeletal muscle types validated by RRBS, bisulfite pyrosequen-cing and gene expression. Together with previous investigations highlighted above, our data suggest that the major role of DNMT3A in skeletal muscle is likely to be in the development and differentiation of muscle tissue either during embryonic development or muscle regenera-tion from satellite cells, rather than a role in mature skeletal muscle funcregenera-tion.
Materials and methods
Ethics statement
Experiments involving mice were approved by the Danish Animal Experiments Expectorate and performed according to local committee guidelines (license numbers 2011/561-92 and 2019-15-0201-01638).
Animals
To exciseDnmt3a, LoxP sites flanked exon 19 of Dnmt3a, which codes for a PC motif in the
catalytic domain. Cre-mediated recombination would thereby lead to a frameshift for all
Dnmt3a variants as previously described [33]. Muscle specific DNMT3A knockout mice were generated by crossing mice heterozygous for muscle creatine kinase promoter-driven Cre recombinase (mCK-Cre-/+) with mice homozygous for floxedDnmt3a (Dnmt3aflox/flox, gift from Prof En Li from the Cardiovascular Research Center of Massachusetts General Hospital, USA) on a C57BL/6 background. This cross produced the experimental animals, genotyped as either WT (Dnmt3aflox/flox) or mCK-DNMT3A (Dnmt3aflox/floxmCK-Cre Tg). Mice were
group-housed with littermates of the same sex (2–7 in a cage), maintained at 22˚C±1˚C, and were fed either chow diet (Altromin diet #1310) or a high-fat diet (HFD, 45% calories as fat, Research Diets D12451). Mice hadad libitum access to food and water and were kept at a
12:12h light:dark cycle. Apart from the mice in the acute exercise protocol detailed below, mice were killed between 36–40 weeks of age at 14:00 after a 6 hour fast by intraperitoneal pen-tobarbital overdose (100 mg/kg of body weight) and cervical dislocation, blood was taken by cardiac puncture (prior to cervical dislocation) and muscle tissues were rapidly dissected and snap-frozen.
Acute exercise protocol for transcriptomics and methylation analysis
12-week-old male and female mice were used in these experiments. Mice were familiarized to a treadmill (Exer3/6, Columbus Instruments) for three consecutive days with 10 min of tread-mill running with 0% incline at 10 m/min. On the day of acute exercise mice performed 30 min of treadmill running with 5% incline at 16m/min. Mice were sacrificed by cervical
dislocation at 10, 30 or 60 min immediately after completion of treadmill running. A separate group of mice were sacrificed at the same time after 30 minutes on a sham treadmill arena ded-icated as “rest”.Soleus muscles were dissected and snap frozen in liquid nitrogen for later
anal-ysis. RRBS was performed on thesoleus muscle from all timepoints while RNA-seq was
performed on the “rest” and 60 minutes after exercise timepoints.
Exercise tolerance test and voluntary wheel running
32–36 week-old chow-fed mice were familiarized to the treadmill for three consecutive days with 10 min of treadmill running with 0% incline at 10 m/min finishing 2 days before the exer-cise tolerance test. On the day of the exerexer-cise tolerance test, at 14:00, mice underwent a graded treadmill test, at a 5% incline, in which they were warmed up with a speed of 10 m/min for 10 minutes and then every 4 minutes speed was increased by 2 m/min to a maximum of 30 m/ min. Mice that lagged at the charged coil for a period of 10 seconds were taken off the treadmill and the running time and distance were recorded. Blood lactate was determined by hand-held lactate meter (Lactate Pro 2, Axonlab) from tail blood, prior to and immediately following treadmill running. A separate cohort of 32–36 week-old chow-fed mice were used for volun-tary wheel running experiments. Mice were singly housed and acclimatized to wheel running cages for 1 week. After acclimatization, mice were kept in running wheel cages for an addi-tional 2 weeks and running distance and speed were monitored using bicycle computers.
Assessment of body composition, indirect calorimetry and oral glucose
tolerance test
Body composition and glucose tolerance were determined in mice at 30 weeks of age (12 weeks of high-fat feeding for HFD mice). Lean and fat mass were measured using the EchoMRI-500 (EchoMRI LLC, Houston, USA) according to the manufacturers’ instructions, excluding body water. For the oral glucose tolerance test, mice were fasted for 6 hours (food removed at 8:00, oGTT started at 14:00) and glucose was administered by gavage with a laryn-geal cannula corresponding to 2.5g of glucose/kg of lean mass. Blood glucose levels were moni-tored from the tail tip using a hand-held glucometer (Contour XT, Bayer) before, and for 90 minutes following glucose administration. Indirect calorimetry was performed in 31–32 week old mice. Mice were acclimatized to the Home Cage System Phenomaster (TSE systems) cages (without running wheels) for 1 week prior to recording measurements. Gas exchange was monitored every 20 minutes for a period of 5 days and was averaged to hourly intervals for a 24-hour period.
Plasma analysis
Plasma insulin was analysed by ELISA (Ultra Sensitive Mouse Insulin ELISA kit, Crystal Chem, #90080). Plasma NEFA was analysed by NEFA HR(2) kit (Wako).
Immunoblotting
Tissue was homogenized in RIPA buffer containing protease (SIGMAFAST Protease Inhibitor Cocktail Tablet, Sigma) and phosphatase inhibitors (10 mM NaF, 1 mM Na3VO4) by steel
bead disruption (3 x 90 sec at 30 Hz using the TissueLyser II, Qiagen). Protein amounts were normalized after determination of protein concentration using BCA protein assay kit (Pierce) in a standard laemmli buffer and subjected to SDS-PAGE, transferred to a PVDF membrane and blotted for DNMT3A (Abcam, #ab188470) or OXPHOS rodent cocktail (Abcam, #ab110413). Protein loading was determined using Bio-Rad stain-free technology.
RNA and DNA isolation
Muscle tissue was homogenized in 350–600μl of RLT plus buffer (Qiagen) with β-mercap-toethanol using steal beads and subjected to 3 x 90 sec at 30 Hz of disruption using the Tissue-Lyser II (Qiagen). RNA and DNA were simultaneously isolated using the RNA/DNA/miRNA AllPrep kit (Qiagen) as per instructions. Primary muscle cells were lysed directly in RLT buffer and RNA extracted using the RNeasy kit (Qiagen). RNA was eluted in 45μl of RNase free water and DNA in 60μl of elution buffer (Qiagen).
RNA sequencing
RNA was checked for quality using the Bioanalyser instrument (Agilent Technologies) and subject to the Illumina TruSeq Stranded Total RNA with Ribo-Zero Gold protocol (Illumina) and performed as described. Libraries were subjected to 75-bp paired-end sequencing on NextSeq 550 (Illumina). Approximately 32 million reads/sample were assigned to genes with 17389 genes surviving the expression threshold.
Genome-wide DNA methylation analysis
Reduced Representation Bisulfite Sequencing (RRBS) was performed as described [7]. Briefly, DNA samples were incubated with MspI enzyme (NEB) in order to fragment DNA at CCGG positions to enrich for CpG regions. Bisulfite conversion was performed using the EZ DNA methylation Kit (Zymo Research) according to the manufacturer’s instructions. DNA was then PCR amplified and ligated to TruSeq (Illumina) sequencing adapters. Libraries were sub-jected to 75-bp single-end sequencing on a NextSeq 550 (Illumina). On average, 18.3 million reads/sample were aligned and 205304 CpGs had sufficient coverage in every sample.
Bioinformatic analysis
RNA sequencing reads were processed as previously described [34], with the difference that the gene model used was mm10 GENCODE Comprehensive gene annotations version 15 pri-mary assembly (https://www.gencodegenes.org/mouse/release_M15.html). RRBS reads were preprocessed with Trim Galore v. 0.4.0 (https://github.com/FelixKrueger/TrimGalore), a wrapper for cutadapt v. 1.9.1 [35], with the—rrbs flag set and aligned to the mm10 genome assembly using Bismark v. 0.18.1 [36], with default parameters and finally CpG methylation calls were summarized using the bismark2bedgraph script which is part of the Bismark soft-ware suite. Samples with less than 10 million aligned reads were observed to have different global levels of methylation and were excluded from further analysis. For each CpG, observa-tions from both strands were added together to form an overall methylation level per CpG, and only CpGs covered by eight or more reads in every sample was used for testing for differ-ential methylation. Chromosomes M, X and Y were excluded, the former due to the lack of methylation on chromosome M and the latter two since the two sexes were not equally repre-sented in all groups and the sex differences were not of interest. Testing for differential methyl-ation was performed using the procedure described by Chenet al. version 2 [37], briefly the ratio between methylated and unmethylated counts is modelled by a negative binomial linear model as implemented in the edgeR framework [38]. The linear model consisted of the main effects of genotype, time post exercise and an interaction between the two. In addition to dif-ferential methylation analysis at the single CpG level, difdif-ferential methylation was also tested using counts aggregated within promoters, defined as 3000 bp up stream and 1000 bp down-stream of TSS, and gene bodies both defined by the same gene model used for RNA-seq analy-sis. Finally, CpGs were also aggregated and tested by CpG clusters where each cluster was
defined by scanning along the genome and grouping CpGs no more than 100bp apart. The fraction of methylation was calculated for each CpG included in the analysis and used both to annotate the differential methylation results and for performing a principal component analy-sis of the sample methylation levels. Gene ontology of differentially methylated clusters was performed using the Genomic Regions Enrichment of Annotations Tool (GREAT) [39] using the standard settings.Soleus mtDNA copy number was calculated from RRBS data by
deter-mining the ratio of reads that aligned to chromosome M compared to total aligned reads, as previously described [40].
Targeted bisulfite pyrosequencing
Bisulfite-pyrosequencing was performed on EDL andquadriceps samples from 36–40
week-old male WT and mD3AKO mice. 1μg of genomic DNA was bisulfite-converted using the EZ DNA Methylation-Lightning kit (Zymo Research) and 30 ng of bisulfite-converted DNA per assay was amplified with the Qiagen PyroMark PCR kit following the manufacturer’s instruc-tions. Amplicons were sequenced on a PyroMark Q48 Autoprep instrument (Qiagen). Pyrose-quencing primers were designed using the Qiagen PyroMark Assay Design Software 2.0 and are displayed inS1 Table. Targets were chosen from differentially methylated clusters from the
soleus RRBS data. Data were analysed with the provided PyroMark Q48 Autoprep software.
cDNA synthesis and qPCR
cDNA was synthesized using the Bio-Rad iScript cDNA synthesis kit from 1μg of RNA. qPCR was performed using conventional Sybr Green chemistry utilizing primers displayed inS1 Table. All primers were used at a final concentration of 200 nM. Relative quantification was determined by comparing samples to a standard curve of pooled cDNA and normalized to the housekeeping gene18S.
Primary muscle cells
Muscle satellite cells were isolated from the complete hindlimbs of 30-week-old male mice (3 WT and 3 mD3AKO) as described [41]. Satellite cells were seeded at 20,000 cells/well (96-well plate format) on Seahorse XFe96 Cell Culture Microplates coated with 1% Matrigel basement membrane (Corning) and differentiated into myotubes in high glucose DMEM with 2% horse serum for 5 days. Real-time measurements of oxygen consumption rate (OCR) and extracellu-lar acidification rate (ECAR) were performed using a Seahorse XFe96 Extracelluextracellu-lar Flux Ana-lyzer (Agilent Technologies) utilising the Seahorse XF Cell Mito Stress Test kit (Agilent Technologies). OCR and ECAR were measured under basal conditions and after injection of final concentrations of 1μM oligomycin, 2.3 μM FCCP, or 2.55 μM antimycin A combined with 1μM rotenone. The measured values were normalized to protein levels by lysing the cells in 50 mM NaOH (70˚C for 1 hour) and performing a BCA protein assay. 14–32 technical rep-licates (wells) were measured for each of the 3 primary muscle cell lines per genotype and an average was taken. The same satellite cells were grown and differentiated in parallel in 12-well plates for RNA extraction.
Analysis of myofiber size
Plantaris muscles from 12-week-old mice were frozen in isopentane and embedded in paraffin
blocks. 2μm muscle sections were stained using Picrosirius red (Direct Red 80, Sigma) for 15 minutes and dehydrated in 99% ethanol. Slides were imaged on a Zeiss Primovert light micro-scope with the objective lens at 20x magnification. Myofiber cross sectional area (CSA) was
calculated using ImageJ software (National Institutes of Health, Bethesda, MD) from at least 4 fields of view per slide and the average CSA per mouse was calculated.
Data availability
RNA-seq and RRBS data are archived for public access at the Gene Expression Omnibus (https://www.ncbi.nlm.nih.gov/geo/query/acc.cgi?acc=GSE152349) under accession number GSE152349. A summarised spreadsheet of the RNA-seq data is included in the supplemental information (S1 Spreadsheet). All of the numerical data underlying the figures is available in the supplemental information (S2 Spreadsheet).
Statistical analysis
Data are expressed as means, error bars depict standard deviation. For mouse experiments uti-lising both female and male mice, results were analysed by 2-way ANOVA for a main effect of genotype and a main effect of sex. When exercise was included as a factor (Fig 2), both sexes were analysed individually by 2-way ANOVA for a main effect of genotype and a main effect of exercise. When only genotype was tested, results were analysed by a student’s t-test. When comparing between different muscle types, results were analysed by 2-way ANOVA for a main effect of genotype and a main effect of muscle. N number represents individual animals or cell lines derived from individual animals. Statistical analysis was performed in GraphPad Prism software (Prism 8). A p-value of less than 0.05 was considered statistically significant. Differen-tial expression and differenDifferen-tial methylation data were analysed for a main effect of genotype, a main effect of exercise and a genotype/exercise interaction. As there were no significant exer-cise/genotype interactions in either the RNA-seq or RRBS datasets, exercised and non-exer-cised mice were grouped together for the analysis performed inFig 7. A false discovery rate (FDR) of less than 5% was considered significant.
Supporting information
S1 Fig. Skeletal muscle expression ofDnmt3a and gene ontology of differentially
methyl-ated regions between WT and mD3AKO muscle. (A)Dnmt3a expression in the EDL and quadriceps muscles of 36-40-week-old male WT and mD3AKO mice compared to the
house-keeping gene18S, fold-change compared to WT, n = 10. Analysed by individual t-tests.
Signifi-cant GO-BP (gene ontology—biological processes) terms from hypomethylated (B) clusters and (C) promoter regions when comparing mD3AKO to WTsoleus muscle. There were no
significant terms for hypermethylated regions. FDR 5%.���P < 0.0005. Data are the mean
(bar) with individual data points. (TIF)
S2 Fig. Modest changes in DNA methylation in muscle after exercise. (A) Number of
signif-icantly differentially methylated regions in thesoleus muscle when comparing genotype, time
after exercise and a genotype/exercise interaction. (B) Percentage of total methylated cytosine residues quantified by RRBS in thesoleus muscle of non-exercised mice (rest) or taken 10, 30
or 60 minutes after 30 minutes of treadmill running, combined male and female. Analysed by 2-way ANOVA, n = 6–7. Data are the mean (bar) with individual data points.
(TIF)
S3 Fig. No difference in skeletal muscle size or morphology between mD3AKO and WT mice. (A)Soleus and tibialis muscle weights of 36–40 week-old male and female WT and
mD3AKO mice, n = 15–21. (B) Representative sirius red staining of theplantaris muscle of
n = 7–9. Analysed by 2-way ANOVA for a main effect of genotype and a main effect of sex. (D) Gene expression of markers of slow and fast twitch fibers from thesoleus muscle of
12-week old mice (male and female combined) normalised to WT, n = 12, analysed by individ-ual t-tests.♀♂ P < 0.05 main effect of sex. Data are box plots or the mean (bar) with individual data points.
(TIF)
S4 Fig. Correlations between the expression of differentially regulated transcripts by exer-cise and the DNA methylation of corresponding regions. Change in % methylation in
pro-moter regions and gene bodies at (A, D) 10, (B, E) 30 and (C, F) 60 minutes after 30 minutes of treadmill running compared to rested muscle vs LogFC of RNA abundance in muscle 60 min-utes after 30 minmin-utes of treadmill running compared to rested muscle. A significant correlation is demonstrated by a blue line.
(TIF)
S1 Spreadsheet. Summarized RNA-seq data of thesoleus muscle. Displaying main effect of
genotype, main effect of exercise and a genotype/exercise interaction. (XLSX)
S2 Spreadsheet. Raw numerical data from all figures. Raw data is displayed in an Excel
spreadsheet with one sheet for each figure and supplemental figure. (XLSX)
S1 Table. Table of qPCR and pyrosequencing primer sequences used in this study.
(DOCX)
Acknowledgments
The authors would like to thank the staff of the Department of Experimental Medicine, Uni-versity of Copenhagen for assistance with animal care. We acknowledge the Single-Cell Omics platform at the Center for Basic Metabolic Research (CBMR) for technical and computational expertise and support.
Author Contributions
Conceptualization: Lewin Small, Rhianna C. Laker, Romain Barrès.
Data curation: Lewin Small, Lars R. Ingerslev. Formal analysis: Lewin Small, Lars R. Ingerslev. Funding acquisition: Lewin Small, Romain Barrès.
Investigation: Lewin Small, Eleonora Manitta, Rhianna C. Laker, Ann N. Hansen, Brendan
Deeney.
Methodology: Lewin Small, Lars R. Ingerslev, Eleonora Manitta, Rhianna C. Laker, Romain
Barrès.
Project administration: Romain Barrès.
Resources: Alain Carrie´, Philippe Couvert, Romain Barrès.
Software: Lars R. Ingerslev. Supervision: Romain Barrès.
Visualization: Lewin Small.
Writing – original draft: Lewin Small, Romain Barrès.
Writing – review & editing: Lewin Small, Lars R. Ingerslev, Eleonora Manitta, Rhianna C.
Laker, Ann N. Hansen, Philippe Couvert, Romain Barrès.
References
1. Robertson KD, Wolffe AP. DNA methylation in health and disease. Nat Rev Genet. 2000; 1: 11–19.
https://doi.org/10.1038/35049533PMID:11262868
2. Pillon NJ, Gabriel BM, Dollet L, Smith JAB, Puig LS, Botella J, et al. Transcriptomic profiling of skeletal muscle adaptations to exercise and inactivity. Nat Commun. 2020; 11: 470.https://doi.org/10.1038/ s41467-019-13869-wPMID:31980607
3. Barrès R, Yan J, Egan B, Treebak JT, Rasmussen M, Fritz T, et al. Acute exercise remodels promoter methylation in human skeletal muscle. Cell metabolism. 2012; 15: 405–411.https://doi.org/10.1016/j. cmet.2012.01.001PMID:22405075
4. Bajpeyi S, Covington JD, Taylor EM, Stewart LK, Galgani JE, Henagan TM. Skeletal Muscle PGC1α-1 Nucleosome Position and -260nt DNA Methylation Determine Exercise Response and Prevent Ectopic Lipid Accumulation in Men. Endocrinology. 2017; 158: 2190–2199. https://doi.org/10.1210/en.2017-00051PMID:28398573
5. Seaborne RA, Strauss J, Cocks M, Shepherd S, O’Brien TD, Someren KA van, et al. Human Skeletal Muscle Possesses an Epigenetic Memory of Hypertrophy. Sci Rep-uk. 2018; 8: 1898.https://doi.org/ 10.1038/s41598-018-20287-3PMID:29382913
6. Kanzleiter T, Ja¨hnert M, Schulze G, Selbig J, Hallahan N, Schwenk RW, et al. Exercise training alters DNA methylation patterns in genes related to muscle growth and differentiation in mice. Am J Physiol-ogy Endocrinol Metabolism. 2015; 308: E912–20.https://doi.org/10.1152/ajpendo.00289.2014PMID:
25805191
7. Laker RC, Garde C, Camera DM, Smiles WJ, Zierath JR, Hawley JA, et al. Transcriptomic and epige-netic responses to short-term nutrient-exercise stress in humans. Scientific reports. 2017; 7: 15134.
https://doi.org/10.1038/s41598-017-15420-7PMID:29123172
8. Barrès R, Osler ME, Yan J, Rune A, Fritz T, Caidahl K, et al. Non-CpG methylation of the PGC-1alpha promoter through DNMT3B controls mitochondrial density. Cell metabolism. 2009; 10: 189–198.https:// doi.org/10.1016/j.cmet.2009.07.011PMID:19723495
9. Gillberg L, Ro¨nn T, Jørgensen SW, Perfilyev A, Hjort L, Nilsson E, et al. Fasting unmasks differential fat and muscle transcriptional regulation of metabolic gene sets in low versus normal birth weight men. Ebiomedicine. 2019; 47: 341–351.https://doi.org/10.1016/j.ebiom.2019.08.017PMID:31439477 10. Barres R, Kirchner H, Rasmussen M, Yan J, Kantor FR, Krook A, et al. Weight loss after gastric bypass
surgery in human obesity remodels promoter methylation. Cell Reports. 2013; 3: 1020–7.https://doi. org/10.1016/j.celrep.2013.03.018PMID:23583180
11. Jacobsen SC, Brøns C, Bork-Jensen J, Ribel-Madsen R, Yang B, Lara E, et al. Effects of short-term high-fat overfeeding on genome-wide DNA methylation in the skeletal muscle of healthy young men. Diabetologia. 2012; 55: 3341–9.https://doi.org/10.1007/s00125-012-2717-8PMID:22961225 12. Jacques M, Hiam D, Craig J, Barrès R, Eynon N, Voisin S. Epigenetic changes in healthy human
skele-tal muscle following exercise- a systematic review. Epigenetics. 2019; 14: 633–648.https://doi.org/10. 1080/15592294.2019.1614416PMID:31046576
13. Sharples AP, Stewart CE, Seaborne RA. Does skeletal muscle have an ‘epi’-memory? The role of epi-genetics in nutritional programming, metabolic disease, aging and exercise. Aging Cell. 2016; 15: 603– 16.https://doi.org/10.1111/acel.12486PMID:27102569
14. Jeltsch A, Jurkowska RZ. New concepts in DNA methylation. Trends Biochem Sci. 2014; 39: 310–318.
https://doi.org/10.1016/j.tibs.2014.05.002PMID:24947342
15. Robertson KD, Uzvolgyi E, Liang G, Talmadge C, Sumegi J, Gonzales FA, et al. The human DNA methyltransferases (DNMTs) 1, 3a and 3b: coordinate mRNA expression in normal tissues and overex-pression in tumors. Nucleic Acids Res. 1999; 27: 2291–2298.https://doi.org/10.1093/nar/27.11.2291
PMID:10325416
16. Bi P, Yue F, Sato Y, Wirbisky S, Liu W, Shan T, et al. Stage-specific effects of Notch activation during skeletal myogenesis. eLife. 2016; 5.https://doi.org/10.7554/eLife.17355PMID:27644105
17. You D, Nilsson E, Tenen DE, Lyubetskaya A, Lo JC, Jiang R, et al. Dnmt3a is an epigenetic mediator of adipose insulin resistance. eLife. 2017; 6: 205.https://doi.org/10.7554/eLife.30766PMID:29091029 18. Zurlo F, Larson K, Bogardus C, Ravussin E. Skeletal muscle metabolism is a major determinant of
rest-ing energy expenditure. Journal of Clinical Investigation. 1990; 86: 1423–1427.https://doi.org/10.1172/ JCI114857PMID:2243122
19. Dou X, Boyd-Kirkup JD, McDermott J, Zhang X, Li F, Rong B, et al. The strand-biased mitochondrial DNA methylome and its regulation by DNMT3A. Genome Res. 2019; 29: 1622–1634.https://doi.org/10. 1101/gr.234021.117PMID:31537639
20. Okano M, Bell DW, Haber DA, Li E. DNA Methyltransferases Dnmt3a and Dnmt3b Are Essential for De Novo Methylation and Mammalian Development. Cell. 1999; 99: 247–257.https://doi.org/10.1016/ s0092-8674(00)81656-6PMID:10555141
21. Jones PA, Liang G. Rethinking how DNA methylation patterns are maintained. Nat Rev Genet. 2009; 10: 805–811.https://doi.org/10.1038/nrg2651PMID:19789556
22. Ferrannini E, Bjorkman O, Reichard GA, Pilo A, Olsson M, Wahren J, et al. The disposal of an oral glu-cose load in healthy subjects. A quantitative study. Diabetes. 1985; 34: 580–588.https://doi.org/10. 2337/diab.34.6.580PMID:3891471
23. Hatazawa Y, Ono Y, Hirose Y, Kanai S, Fujii NL, Machida S, et al. Reduced Dnmt3a increases Gdf5 expression with suppressed satellite cell differentiation and impaired skeletal muscle regeneration. The FASEB Journal. 2018; 32: 1452–1467.https://doi.org/10.1096/fj.201700573RPMID:29146735 24. Kamei Y, Suganami T, Ehara T, Kanai S, Hayashi K, Yamamoto Y, et al. Increased expression of DNA
methyltransferase 3a in obese adipose tissue: studies with transgenic mice. Obes Silver Spring Md. 2009; 18: 314–21.https://doi.org/10.1038/oby.2009.246PMID:19680236
25. Wong M, Gertz B, Chestnut BA, Martin LJ. Mitochondrial DNMT3A and DNA methylation in skeletal muscle and CNS of transgenic mouse models of ALS. Front Cell Neurosci. 2013; 7: 279.https://doi.org/ 10.3389/fncel.2013.00279PMID:24399935
26. Patil V, Cuenin C, Chung F, Aguilera JRR, Fernandez-Jimenez N, Romero-Garmendia I, et al. Human mitochondrial DNA is extensively methylated in a non-CpG context. Nucleic Acids Res. 2019; 47: 10072–10085.https://doi.org/10.1093/nar/gkz762PMID:31665742
27. Mechta M, Ingerslev LR, Fabre O, Picard M, Barrès R. Evidence Suggesting Absence of Mitochondrial DNA Methylation. Frontiers Genetics. 2017; 8: 166.https://doi.org/10.3389/fgene.2017.00166PMID:
29163634
28. Lindholm ME, Marabita F, Gomez-Cabrero D, Rundqvist H, Ekstro¨m TJ, Tegne´r J, et al. An integrative analysis reveals coordinated reprogramming of the epigenome and the transcriptome in human skeletal muscle after training. Epigenetics. 2015; 9: 1557–1569.https://doi.org/10.4161/15592294.2014. 982445PMID:25484259
29. Garcı´a-Gime´ nez JL, Roma´-Mateo C, Pe´rez-Machado G, Peiro´-Chova L, Pallardo´ FV. Role of glutathi-one in the regulation of epigenetic mechanisms in disease. Free Radic Biology Medicine. 2017; 112: 36–48.https://doi.org/10.1016/j.freeradbiomed.2017.07.008PMID:28705657
30. Naito M, Mori M, Inagawa M, Miyata K, Hashimoto N, Tanaka S, et al. Dnmt3a Regulates Proliferation of Muscle Satellite Cells via p57Kip2. Tajbakhsh S, editor. PLoS genetics. 2016; 12: e1006167.https:// doi.org/10.1371/journal.pgen.1006167PMID:27415617
31. Gundersen K, Rabben I, Klocke BJ, Merlie JP. Overexpression of myogenin in muscles of transgenic mice: interaction with Id-1, negative crossregulation of myogenic factors, and induction of extrasynaptic acetylcholine receptor expression. Mol Cell Biol. 1995; 15: 7127–7134.https://doi.org/10.1128/mcb.15. 12.7127PMID:8524280
32. Olguin HC, Olwin BB. Pax-7 up-regulation inhibits myogenesis and cell cycle progression in satellite cells: a potential mechanism for self-renewal. Dev Biol. 2004; 275: 375–388.https://doi.org/10.1016/j. ydbio.2004.08.015PMID:15501225
33. Kaneda M, Okano M, Hata K, Sado T, Tsujimoto N, Li E, et al. Essential role for de novo DNA methyl-transferase Dnmt3a in paternal and maternal imprinting. Nature. 2004; 429: 900–903.https://doi.org/ 10.1038/nature02633PMID:15215868
34. Williams K, Ingerslev LR, Bork-Jensen J, Wohlwend M, Hansen AN, Small L, et al. Skeletal muscle enhancer interactions identify genes controlling whole-body metabolism. Nat Commun. 2020; 11: 2695.
https://doi.org/10.1038/s41467-020-16537-6PMID:32483258
35. Martin M. Cutadapt removes adapter sequences from high-throughput sequencing reads. Embnet J. 2011; 17: 10–12.https://doi.org/10.14806/ej.17.1.200
36. Krueger F, Andrews SR. Bismark: a flexible aligner and methylation caller for Bisulfite-Seq applica-tions. Bioinform Oxf Engl. 2011; 27: 1571–2.https://doi.org/10.1093/bioinformatics/btr167PMID:
37. Chen Y, Pal B, Visvader JE, Smyth GK. Differential methylation analysis of reduced representation bisulfite sequencing experiments using edgeR. F1000research. 2017; 6: 2055.https://doi.org/10. 12688/f1000research.13196.2PMID:29333247
38. Robinson MD, McCarthy DJ, Smyth GK. edgeR: a Bioconductor package for differential expression analysis of digital gene expression data. Bioinform Oxf Engl. 2009; 26: 139–40.https://doi.org/10.1093/ bioinformatics/btp616PMID:19910308
39. McLean CY, Bristor D, Hiller M, Clarke SL, Schaar BT, Lowe CB, et al. GREAT improves functional interpretation of cis-regulatory regions. Nat Biotechnol. 2010; 28: 495–501.https://doi.org/10.1038/nbt. 1630PMID:20436461
40. Longchamps RJ, Castellani CA, Yang SY, Newcomb CE, Sumpter JA, Lane J, et al. Evaluation of mito-chondrial DNA copy number estimation techniques. Plos One. 2020; 15: e0228166.https://doi.org/10. 1371/journal.pone.0228166PMID:32004343
41. Shahini A, Vydiam K, Choudhury D, Rajabian N, Nguyen T, Lei P, et al. Efficient and high yield isolation of myoblasts from skeletal muscle. Stem cell research. 2018; 30: 122–129.https://doi.org/10.1016/j.scr. 2018.05.017PMID:29879622