HAL Id: hal-00297812
https://hal.archives-ouvertes.fr/hal-00297812
Submitted on 26 Jun 2006HAL is a multi-disciplinary open access
archive for the deposit and dissemination of sci-entific research documents, whether they are pub-lished or not. The documents may come from teaching and research institutions in France or abroad, or from public or private research centers.
L’archive ouverte pluridisciplinaire HAL, est destinée au dépôt et à la diffusion de documents scientifiques de niveau recherche, publiés ou non, émanant des établissements d’enseignement et de recherche français ou étrangers, des laboratoires publics ou privés.
Nitrous oxide water column distribution during the
transition from anoxic to oxic conditions in the Baltic
Sea
S. Walter, U. Breitenbach, H. W. Bange, G. Nausch, D. W. R. Wallace
To cite this version:
S. Walter, U. Breitenbach, H. W. Bange, G. Nausch, D. W. R. Wallace. Nitrous oxide water column distribution during the transition from anoxic to oxic conditions in the Baltic Sea. Biogeosciences Discussions, European Geosciences Union, 2006, 3 (3), pp.729-764. �hal-00297812�
BGD
3, 729–764, 2006
Nitrous oxide in the Baltic Sea S. Walter et al. Title Page Abstract Introduction Conclusions References Tables Figures J I J I Back Close
Full Screen / Esc
Printer-friendly Version Interactive Discussion
EGU Biogeosciences Discuss., 3, 729–764, 2006
www.biogeosciences-discuss.net/3/729/2006/ © Author(s) 2006. This work is licensed under a Creative Commons License.
Biogeosciences Discussions
Biogeosciences Discussions is the access reviewed discussion forum of Biogeosciences
Nitrous oxide water column distribution
during the transition from anoxic to oxic
conditions in the Baltic Sea
S. Walter1, U. Breitenbach1, H. W. Bange1, G. Nausch2, and D. W. R. Wallace1
1
Forschungsbereich Marine Biogeochemie, IFM-GEOMAR, Leibniz-Institut f ¨ur Meereswissenschaften, D ¨usternbrooker Weg 20, 24 105 Kiel, Germany
2
Leibniz-Institut f ¨ur Ostseeforschung, Warnem ¨unde, Germany
Received: 22 February 2006 – Accepted: 4 March 2006 – Published: 26 June 2006 Correspondence to: S. Walter ([email protected])
BGD
3, 729–764, 2006
Nitrous oxide in the Baltic Sea S. Walter et al. Title Page Abstract Introduction Conclusions References Tables Figures J I J I Back Close
Full Screen / Esc
Printer-friendly Version Interactive Discussion
EGU
Abstract
In January 2003, a major inflow of cold and oxygen-rich North Sea Water in the Baltic Sea terminated an ongoing stagnation period in parts of the central Baltic Sea. In order to investigate the role of North Sea Water inflow to the Baltic Sea with regard to the production of nitrous oxide (N2O), we measured dissolved and atmospheric N2O at 26 5
stations in the southern and central Baltic Sea in October 2003.
At the time of our cruise, water renewal had proceeded to the eastern Gotland Basin, whereas the western Gotland Basin was still unaffected by the inflow. The deep water renewal was detectable in the distributions of temperature, salinity, and oxygen concen-trations as well as in the distribution of the N2O concentrations: Shallow stations in the 10
Kiel Bight and Pomeranian Bight were well-ventilated with uniform N2O concentrations near equilibrium throughout the water column. In contrast, stations in the deep basins, such as the Bornholm and the Gotland Deep, showed a clear stratification with deep water affected by North Sea Water. Inflowing North Sea Water led to changed envi-ronmental conditions, especially enhanced oxygen (O2) or declining hydrogen sulfide 15
(H2S) concentrations, thus, affecting the conditions for the production of N2O. Pattern of N2O profiles and correlations with parameters like oxygen and nitrate differed be-tween the basins. The dominant production pathway seems to be nitrification rather than denitrification.
No indications for advection of N2O by North Sea Water were found. A rough budget 20
revealed a significant surplus of in situ produced N2O after the inflow. However, due to the permanent halocline, it can be assumed that the formed N2O does not reach the atmosphere. Hydrographic aspects therefore are decisive factors determining the final release of produced N2O to the atmosphere.
BGD
3, 729–764, 2006
Nitrous oxide in the Baltic Sea S. Walter et al. Title Page Abstract Introduction Conclusions References Tables Figures J I J I Back Close
Full Screen / Esc
Printer-friendly Version Interactive Discussion
EGU
1 Introduction
1.1 Nitrous oxide
Nitrous oxide (N2O) is an important atmospheric trace gas which influences, directly and indirectly, the Earth’s climate: In the troposphere, it acts as a greenhouse gas with a relatively long atmospheric lifetime of 114 years (Prather et al., 2001). In the 5
stratosphere it is the major source for nitric oxide radicals, which are involved in one of the main ozone reaction cycles (WMO, 2003).
N2O is mainly formed during microbial processes such as nitrification and denitrifi-cation. Nitrification is an aerobic two-step process in which ammonium is oxidized to nitrate. In this process, in which typically two groups of bacteria are involved, N2O is 10
assumed to be a by-product, the exact metabolism however is still under discussion (Ostrom et al., 2000). In suboxic habitats, nitrate can be reduced by denitrification to molecular nitrogen, with N2O as an intermediate (Cohen and Gordon, 1978). N2O may also be produced by coupled nitrification and denitrification at oxic/suboxic boundaries, due to the transfer of intermediates such as nitrate and nitrite (Yoshinari et al., 1997). 15
Other possibilities are the production of N2O during nitrifier-denitrification or aerobic denitrification (Wrage et al., 2001). Both processes enable nitrifiers to oxidize NH+4 to NO−2, followed by the reduction of NO−2 to N2O or N2 (Robertson and Kuenen, 1984; Robertson et al., 1988; Richardson, 2000). In anoxic habitats N2O is used, instead of oxygen, as an electron acceptor (Elkins et al., 1978; Cohen and Gordon, 1978). 20
The yield of N2O during these processes strongly depends on the concentration of dissolved oxygen and nitrate (Brettar and Rheinheimer, 1991; Goreau et al., 1980; Vol-lack and Zumft, 2001; Wetzel, 1983), with maximal N2O accumulation at the interface between oxic and suboxic layers and depletion in anoxic layers (Codispoti et al., 2005). Positive correlations between N2O and oxygen or nitrate are commonly interpreted as 25
an indication of N2O production by nitrification (Yoshinari, 1976; Yoshida et al., 1989; Cohen and Gordon, 1978). In contrast, production by denitrification is inferred by miss-ing correlations (Elkins et al., 1978; Cohen and Gordon, 1978). However, up to now
BGD
3, 729–764, 2006
Nitrous oxide in the Baltic Sea S. Walter et al. Title Page Abstract Introduction Conclusions References Tables Figures J I J I Back Close
Full Screen / Esc
Printer-friendly Version Interactive Discussion
EGU the dominant production pathway for N2O on the global scale remains unclear and is
discussed controversially (Codispoti et al., 2001; Popp et al., 2002; Yamagishi et al., 2005).
Oceans emit more than 25% of natural produced N2O and contribute significantly to the global N2O budget (Prather et al., 2001; Seitzinger et al., 2000). Particularly 5
coastal regions, including estuarine and upwelling regions, play a major role for the formation and release of N2O to the atmosphere (Bange et al., 1996; Naqvi et al., 2000; Seitzinger et al., 2000). In the Baltic Sea, first investigations were made by R ¨onner (1983) who found the Baltic Sea to be a source of atmospheric N2O. In contrast to open ocean areas coastal regions are expected to be more influenced by conversion 10
processes in sediments or by riverine inputs. In the Bodden waters and Danish fjords of the Baltic Sea enhanced N2O concentrations were correlated with seasonal riverine input (Jørgensen and Sørensen, 1985; Dahlke et al., 2000). Additionally, denitrification processes in sediments were shown to contribute to the release of N2O in Danish fjords (Jørgensen and Sørensen, 1985).
15
1.2 Study area
Samples of dissolved N2O were measured at 26 stations in the western, southern and central Baltic Sea. The cruise took place on board the German research ves-sel Gauss (expedition no. 11/03/04) from 13 October to 25 October 2003 as part of the Cooperative Monitoring in the Baltic Sea Environment (COMBINE) program of the 20
Baltic Marine Environment Protection Commission (Helsinki Commission, HELCOM, seehttp://www.helcom.fi). The locations of sampled stations are shown in Fig. 1.
The Baltic Sea is an adjacent sea of the Atlantic Ocean and part of the European continental shelf. It consists of a series of basins (Arkona, Bornholm, and Gotland Basin; see Fig. 1), with restricted horizontal and vertical water exchange due to shallow 25
sills and a clear salinity stratification of water masses.
In January 2003 a major inflow of cold, highly saline and oxygen-rich North Sea Wa-ter was observed. It was the most important inflow event since 1993 and Wa-terminated
BGD
3, 729–764, 2006
Nitrous oxide in the Baltic Sea S. Walter et al. Title Page Abstract Introduction Conclusions References Tables Figures J I J I Back Close
Full Screen / Esc
Printer-friendly Version Interactive Discussion
EGU the ongoing stagnation period in the central Baltic Sea (Feistel et al., 2003; Nausch et
al., 2003). This inflow event was preceded by a minor inflow of warmer and less oxy-genated water in August 2002. Due to the inflow of North Sea Water oxygen conditions changed from anoxic to oxic in most parts of the Baltic Sea. From the inflow in January 2003 until our cruise in October 2003 water renewal was already detectable at the Far ¨o 5
Deep (# 286), however the western Gotland Basin was still unventilated (Feistel et al., 2003; Nausch et al., 2003).
Due to the fact that N2O production highly depends on environmental conditions such as e.g. oxygen concentration (e.g., Naqvi et al., 2000) any natural or anthropogenic-induced shifts of coastal ecosystems will modulate the formation and subsequent re-10
lease of N2O to the atmosphere. In this context the inflow of North Sea Water into the Baltic Sea offered a good opportunity to investigate naturally changing environmental conditions with regard to the production of N2O.
1.3 Definition of water masses
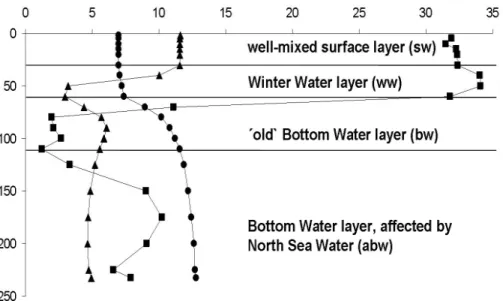
We refer to four different water masses, characterized by temperature, salinity and 15
oxygen concentrations (Fig. 2). The definition of water masses follows the description of the “Institut f ¨ur Ostseeforschung” (IOW) cruise reports (Nausch, 2003a, b, c; Nagel, 2003; Feistel, 2003; Wasmund, 2003) and the hydrographic-chemical report of the Baltic Sea in 2003 (Nausch et al., 2004). These water masses were characteristic for the time period after the inflow event in summer and autumn 2003.
20
The Surface Water layer (sw) was characterized by uniform temperature and salinity, in combination with high oxygen concentrations. Below this layer, rapidly decreasing temperatures indicated Winter Water (ww), which is formed annually during convection in winter. Salinity and oxygen concentrations were still uniform. The “old” Bottom Wa-ter (bw) was visible by increasing temperature and simultaneously increasing salinity. 25
In this water mass, located below the Winter Water, oxygen concentrations decreased rapidly, to anoxic conditions at some stations. A permanent halocline between Winter Water and Bottom Water strongly restricts the vertical exchange and is the reason for
BGD
3, 729–764, 2006
Nitrous oxide in the Baltic Sea S. Walter et al. Title Page Abstract Introduction Conclusions References Tables Figures J I J I Back Close
Full Screen / Esc
Printer-friendly Version Interactive Discussion
EGU the development of stagnant deep waters with oxygen depletion up to anoxia
accompa-nied by accumulation of hydrogen sulphide (H2S). Bottom Water, affected by the North Sea Water inflow in January 2003 (abw) was characterized by decreasing temperature and enhanced oxygen concentrations compared to previous Bottom Water (bw) values. Due to its higher density the affected Bottom Water lifts up the “old” Bottom Water. 5
2 Methods
Water samples were taken using a combined Seabird SBE911 CTD and Hydrobios rosette sampler equipped with 13 free-flow bottles. Samples for N2O analysis were collected in triplicate from various depths. The analytical method applied was a mod-ification of the method described by (Bange et al., 2001). Bubble free samples were 10
taken immediately following oxygen sampling from the rosette in 24 mL glass vials, sealed directly with butyl rubber stoppers and crimped with aluminium caps. To pre-vent microbial activity, samples were poisoned with 500 µL of a 2 mM mercury chloride solution.10 mL of the sample were then replaced with a helium headspace for each vial, and the samples were equilibrated for at least two hours at room temperature 15
(temperature was recorded continuously). A 9 mL subsample from the headspace was used to flush a 2 mL sample loop after passing through a moisture trap (filled with Sicapent®, Merck Germany). Gaschromatographic separation was performed at 190◦C on a packed molecular sieve column (6 ft×1/800 SS, 5 A, mesh 80/100, Alltech GmbH, Germany). The N2O was detected with an electron capture detector. A mix-20
ture of argon with 5 percent by volume methane was used as carrier gas with a flow of 21 mL min−1. For the two-point calibration procedure we used standard gas mix-tures with 311.8±0.2 ppb and 346.5±0.2 ppb N2O in synthetic air (Deuste Steininger GmbH, M ¨uhlhausen Germany). The standard mixtures have been calibrated against the NOAA (National Oceanic and Atmospheric Administration, Boulder, Co.) standard 25
BGD
3, 729–764, 2006
Nitrous oxide in the Baltic Sea S. Walter et al. Title Page Abstract Introduction Conclusions References Tables Figures J I J I Back Close
Full Screen / Esc
Printer-friendly Version Interactive Discussion
EGU Chemistry, Mainz, Germany.
2.1 Calculations
N2O water concentrations (CN2O) were calculated as follows: CN2O hnmol L−1i = ( β x P Vwp+ x P
R T Vhs) / Vwp (1)
where β stands for the Bunsen solubility in nmol L−1atm−1 (Weiss and Price, 1980), x 5
is the dry gas mole fraction of N2O in the headspace in ppb, P is the atmospheric pres-sure in atm, Vwp and Vhs stand for the volumes of the water and headspace phases, respectively. R is the gas constant (8.2054 10−2L atm mol−1K−1) and T is the temper-ature during equilibration. The salinity was measured by the CTD-Sensor during water sample collection; the temperature was measured while subsampling the headspace of 10
the sample vial (i.e. the equilibration temperature). The overall relative mean analytical error was estimated to be ±1.8%.
The excess N2O (∆N2O) was calculated as the difference between the calculated N2O equilibrium concentration and the measured concentration of N2O as follows ∆N2O (nmol L−1)=N2O (observed)−N2O (equilibrium). (2)
15
Since the water masses in the Baltic Sea are comparably young (e.g. 11 years for the oldest bottom water at the Landsort Deep) (Meier, 2005) it is reasonable to calculate the equilibrium value with the actual atmospheric N2O mole fraction. During the cruise we measured a mean of 318 ppb (±3 ppb, n=84) in the atmosphere, which is in good agreement with the monthly mean of 318.5±0.2 ppb in October 2003 measured at 20
Mace Head, Ireland. This value was taken from the Advanced Global Atmospheric Gases Experiment (AGAGE) data set (updated version from May 2005, available atftp: //cdiac.esd.ornl.edu (subdirectory pub/ale gage Agage/Agage/gc-md/monthly) at the Carbon Dioxide Information Analysis Center in Oak Ridge, Tennessee).
BGD
3, 729–764, 2006
Nitrous oxide in the Baltic Sea S. Walter et al. Title Page Abstract Introduction Conclusions References Tables Figures J I J I Back Close
Full Screen / Esc
Printer-friendly Version Interactive Discussion
EGU The apparent oxygen utilization (AOU) was calculated as follows:
AOU (µmol L−1)=O2(equilibrium)−O2(observed). (3)
The equilibrium values of dissolved oxygen (O2) were calculated with the equation given by Weiss (1970). The concentration of H2S is expressed as the negative oxygen equivalent (1 µmol L−1 H2S=−2.00 µmol L−1 O2). Dissolved nutrients and CTD data 5
were provided by the participating working groups.
The N2O inventory of single basins mN2Owas calculated as follows:
mN2O [tons]= ¯CN2O× nN2O× V × 10−3 (4)
where ¯CN2O is the mean measured N2O concentration in the single basins from the upper part of the halocline to the bottom (nmol L−1), nN2O is the mole weight of N2O 10
(44 g mol−1) and V is the water volume of the single basins (km3).
The water volumes are based on data published in Sect. 4.4.1 (HELCOM, 1996), available at:http://www.vtt.fi/inf/baltic/balticinfo/index.html.
The N2O content of basins was calculated with data of the following stations: Born-holm Basin: station 140, 200, 213, 222, eastern Gotland Basin: station 250, 259, 15
260, 272, western Gotland Basin: station 240, 245, 284. Station 286 is located in the northern part of the Gotland Basin and thus has not been taken into account.
Nitrification rates (N) were estimated for the Bornholm Basin and the eastern Gotland Basin.
Nhnmol L−1d−1i = ∆mN2O
dbasin× Vbasin× n × 10−9 × rN2O (5)
20
where∆mN2Ois the difference of calculated N2O content of the basins before and after the inflow event in tons, dbasin is the number of days from the first observation of the intrusion of North Sea Water until our measurements (assumed by data of the cruise reports of Nausch, 2003a, b, c; Nagel, 2003; Feistel, 2003; Wasmund, 2003).
Vbasin is the calculated volume of the basins (km3) (based on data published in 25
BGD
3, 729–764, 2006
Nitrous oxide in the Baltic Sea S. Walter et al. Title Page Abstract Introduction Conclusions References Tables Figures J I J I Back Close
Full Screen / Esc
Printer-friendly Version Interactive Discussion
EGU is the mole weight of N2O (44 g mol−1), and rN2Ois the assumed N2O release of 0.3%
in continental shelves during nitrification (Seitzinger and Kroeze, 1998).
3 Results
In order to account for the hydrographic characteristics of the Baltic Sea and the direc-tion of the inflow of North Sea Water, we present the results according to the following 5
classifications: I) well-mixed basins such as the Kiel, L ¨ubeck and Pomeranian Bights and II) clearly stratified basins such as the Arkona, the Bornholm, the western and the eastern Gotland Basin (see Fig. 2). For each basin selected profiles are shown. 3.1 Well-mixed basins
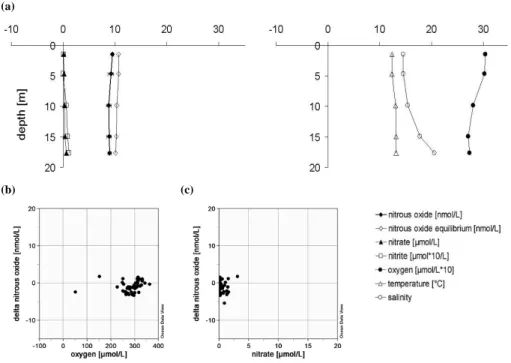
At shallow stations, with depths <30 m (station 10, 12, 22, 30, 41, 46, 121, 130, 133, 10
360, OB Boje, OB 4, Fig. 1), water masses were well mixed, and profiles showed nearly uniform vertical distributions of all parameters (Fig. 3a). Concentrations of N2O were near equilibrium; however the Pomeranian Bight (station 130, 133, OB Boje, OB 4) showed enhanced saturation values (104.6±7.9%) in comparison with the Kiel Bight (station 360) and the L ¨ubeck (station 22) and Mecklenburg Bight (station 10, 12, 41, 15
46; 79.3±10.7%). No correlations were found between∆N2O and other parameters like O2and NO−3 (Figs. 3b–c).
3.2 Stratified basins
Basins with water depths >30 m (Figs. 4–7) were clearly stratified into layers of well mixed Surface Water (sw), Winter (ww) and Bottom Water (bw) as described above. At 20
several stations Bottom Water was affected by North Sea Water (abw), up to the Far¨o Deep in the northern part of the central Baltic Sea (Fig. 1, station 286) (Feistel et al., 2003). However, below 110 m the deep water of the Far ¨o Deep was still anoxic, though
BGD
3, 729–764, 2006
Nitrous oxide in the Baltic Sea S. Walter et al. Title Page Abstract Introduction Conclusions References Tables Figures J I J I Back Close
Full Screen / Esc
Printer-friendly Version Interactive Discussion
EGU with decreasing H2S concentrations from 125 m to the bottom (Fig. 6a, lower profiles).
Stations in the western Gotland Basin such as the Landsort Deep (station 284, Fig. 7a) or the Karls ¨o Deep (station 245, not shown) were still unaffected by the inflow event, thus below 80 m H2S concentrations were uniform.
3.2.1 Arkona Basin 5
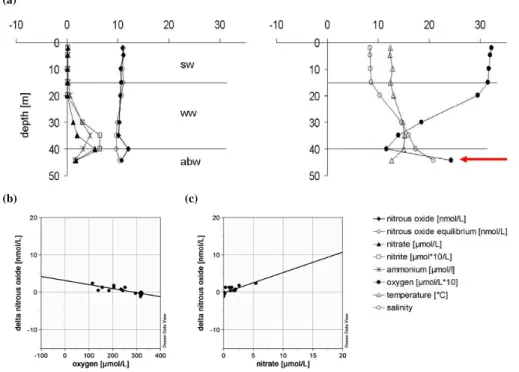
In the Arkona Basin (stations 109 and 113 (Fig. 4a)), N2O concentrations were con-stant and near equilibrium (10.9±0.7 nmol L−1) throughout the water column. In the Winter Water below the thermocline at 15 m O2concentrations decreased, associated with increasing NO−2, NO−3 and NH+4. ∆N2O was slightly negatively correlated with O2(Fig. 4b), and positively correlated with NO−3 (Fig. 4c). At the bottom below 40 m 10
inflowing North Sea (arrow in Fig. 4a) water formed a 5 to 10 m thick oxygen enriched layer, however with no clear influence on the N2O concentration.
3.2.2 Bornholm Basin
In the Bornholm Basin (Fig. 5, stations 140, 200, 213 and 222), N2O profiles in the cen-tral basin (stations 200 (not shown) and 213 (Fig. 5a)) can be clearly distinguished from 15
stations where water flows into and out of the basin. At station 140 (inflow, not shown) concentrations and distribution of N2O and ∆N2O were comparable to the Arkona Basin. At station 222 (outflow, not shown) N2O concentrations in the surface layer were uniform near equilibrium at approximately 10 nmol L−1, below the surface layer concentrations were uniform around 15.4 nmol L−1. In the central Bornholm Basin, 20
at station 200 (not shown) and 213 (Fig. 5a) N2O concentrations increased rapidly within the layer affected by North Sea Water (abw, below 60 m), with N2O values up to 31.3 nmol L−1 (station 200). These were the highest values measured during the en-tire cruise. In water masses above, N2O was near equilibrium, with slightly enhanced ∆N2O values in the “old” Bottom Water (bw, 40–60 m). In the Bornholm Basin∆N2O
25
how-BGD
3, 729–764, 2006
Nitrous oxide in the Baltic Sea S. Walter et al. Title Page Abstract Introduction Conclusions References Tables Figures J I J I Back Close
Full Screen / Esc
Printer-friendly Version Interactive Discussion
EGU ever, both correlations were nonlinear and were fitted best by polynomials.
3.2.3 Eastern Gotland Basin
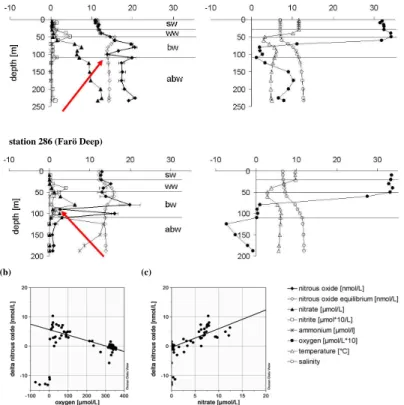
The situation became more complex in the eastern Gotland basin (stations 259, 250, 260, 271 and 286). Profiles were not as homogeneous as in the Arkona or Born-holm Basin. Again, N2O concentrations were near equilibrium in the surface layer (sw, 5
0–20/30 m) and the Winter Water (ww, 20/30–60 m). At station 271 (Fig. 6a, upper profiles) the Bottom Water (bw) was completely oxygenated, with N2O values at ap-proximately 20 nmol L−1 and positive∆N2O. At station 286 (Fig. 6a, lower profiles) the Bottom Water (bw) was affected by the North Sea Water too, but was still anoxic. In-flow of North Sea Water was detectable by decreasing H2S concentrations down to 10
the bottom. Throughout the Bottom Water N2O concentrations remained near zero. At station 250 (not shown), 271 (Fig. 6a, upper profiles) and 286 (Fig. 6a, lower pro-files) a sharp local minimum of N2O concentrations was observed at depths between 90 and 110 m (see arrows in Fig. 6a), combined with a local minimum in NO−3 values. Except for the anoxic water masses, ∆N2O was linearly correlated with O2 and NO−3 15
(Fig. 6b–c).
3.2.4 Western Gotland Basin
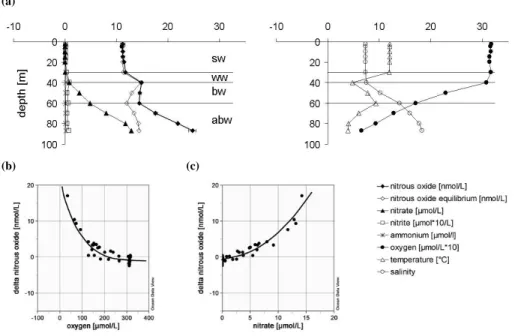
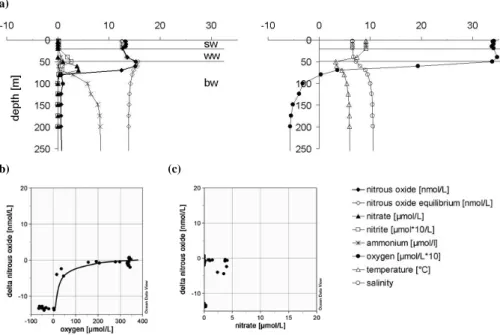
The western Gotland Basin with stations 284 (Fig. 7a), 245 and 240 revealed the “old” conditions, showing characteristics as yet unaffected by the latest intrusion of oxic North Sea Water. N2O in the surface layer (sw, 0–20/40 m) and Winter Water (ww, 20
20/40–60 m) was near equilibrium. Below 50 m, oxygen concentrations decreased rapidly and N2O concentrations dropped sharply within the oxic/anoxic interface and remained near zero in the anoxic deep waters. ∆N2O values were negative and were not correlated with NO−3 (Fig. 7c). ∆N2O was logarithmically correlated with oxygen (Fig. 7b).
BGD
3, 729–764, 2006
Nitrous oxide in the Baltic Sea S. Walter et al. Title Page Abstract Introduction Conclusions References Tables Figures J I J I Back Close
Full Screen / Esc
Printer-friendly Version Interactive Discussion
EGU 3.3 Estimated contribution of the North Sea Water inflow to the production of N2O
The North Sea Water inflow consisted of a water volume of 200 km3 (Feistel and Nausch, 2003). With an assumed N2O concentration of 10±2 nmol L−1 (Law and Owens, 1990), the North Sea Water transported approximately 88±18 tons N2O into the Baltic Sea.
5
Before the North Sea Water inflow, the deep waters below the halocline were anoxic, not only in the western but also in the eastern Gotland Basin and the Bornholm Basin (Schmidt, 2002). Thus, N2O concentrations near zero similar to measured profiles in the western Gotland Basin in October 2003 (Fig. 7a) can be assumed. This is sup-ported by the drop in concentration at station 286 (Fig. 7a, lower profile), which is 10
assumed to be related to the previously anoxic bottom water. The mean N2O concen-tration in the western Gotland Basin was 0.97±0.34 nmol L−1, on the basis of these values the calculated N2O content of the Bornholm Basin and the eastern Gotland Basin was approximately 64±23 tons before the inflow (Table 1).
After the inflow event the Bornholm Basin and the eastern Gotland Basin are clearly 15
influenced by the North Sea Water, whereas the western Gotland Basin was still un-affected (Nausch, 2003a, b, c; Nagel, 2003; Feistel, 2003; Wasmund, 2003). The N2O content of the Bornholm Basin and the eastern Gotland Basin, calculated with the mean of measured N2O concentrations below the halocline in these basins, was about 1194±256 tons (Table 1).
20
4 Discussion
Over the past two decades the previously frequent inflows of North Sea Water be-came rather rare (Feistel and Nausch, 2003), and oxygen levels in deep waters de-creased. Thus, oxygen conditions in the Baltic Sea deep water cover a continuum from almost permanently oxic (i.e. Arkona Basin) to almost permanently anoxic conditions 25
BGD
3, 729–764, 2006
Nitrous oxide in the Baltic Sea S. Walter et al. Title Page Abstract Introduction Conclusions References Tables Figures J I J I Back Close
Full Screen / Esc
Printer-friendly Version Interactive Discussion
EGU oxic (i.e. Bornholm Basin, eastern Gotland Basin) (Feistel, 2003; Nausch, 2003a, b, c;
Nagel, 2003; Wasmund, 2003).
The inflow event in January 2003 rapidly changed the environmental conditions of the deep basins. With respect to the oxygen dependent production of N2O, our measured N2O concentrations reflect the continuum of unaffected and changing oxygen condi-5
tions quite well. In oxic and well mixed waters, vertical N2O profiles were homogenous, with concentrations near equilibrium (Fig. 3a). Anoxic deep water layers, unaffected by North Sea Water (i.e. in the western Gotland Basin), had N2O concentrations near zero (Fig. 7a). Therefore, in both cases no correlations between N2O and either oxy-gen or nitrate were found (Figs. 3b–c, Figs. 7b–c). In contrast, stratified and recently 10
ventilated water bodies in the Bornholm and eastern Gotland Basin revealed N2O dis-tributions that were clearly correlated with oxygen and nitrate (Figs. 5b–c, Figs. 6b–c). These vertical N2O distributions are in general agreement with the few previ-ously published N2O profiles from the central Baltic Sea (R ¨onner, 1983; R ¨onner and S ¨orensson, 1985; Brettar and Rheinheimer, 1992). However, the past environmen-15
tal settings of the deep central Baltic Sea basins were different: N2O profiles from the central Baltic Sea reported by (R ¨onner, 1983) were measured when oxic condi-tions prevailed during August–September 1977 after a strong inflow event in 1976/1977 (Schinke and Matth ¨aus, 1998). Their N2O profiles are comparable to our profiles, mea-sured in the completely oxygenated Bornholm Basin during October 2003 (Fig. 5a). 20
Anoxic conditions were re-established in July 1979 and May–June 1980. The shape of the N2O profiles from the then anoxic Gotland Deep, measured by R ¨onner and S ¨orensson (1985) is comparable to the N2O profiles measured in the western Gotland Basin (e.g., the Landsort Deep, Fig. 7a). This is the same for profiles measured by Brettar and Rheinheimer (1991) in August 1986 and July 1987 during the 1983–1993 25
stagnation periods (Schinke and Matth ¨aus, 1998).
In the following sections we discuss the processes that may cause the observed distributions of N2O in the different basins.
BGD
3, 729–764, 2006
Nitrous oxide in the Baltic Sea S. Walter et al. Title Page Abstract Introduction Conclusions References Tables Figures J I J I Back Close
Full Screen / Esc
Printer-friendly Version Interactive Discussion
EGU 4.1 Non-biological aspects
In surface layers and well-mixed water bodies of shallow stations, observed N2O con-centrations were near the equilibrium due to exchange with the atmosphere. In the Winter Water N2O concentrations were also near equilibrium, however with higher ab-solute values than in the surface layer (see Figs. 5a–7a). Mainly hydrographic aspects 5
were here responsible for the observed N2O distribution. This water mass is formed during winter convection, when N2O concentrations were in equilibrium with the atmo-sphere and this signal is conserved during stratification of the upper layer in summer. The lower temperature and hence higher N2O solubility during formation of the Winter Water are the reason for the enhanced N2O concentrations in this layer.
10
A non-biological factor affecting N2O in the deep water of the Baltic Sea might be advection with inflowing North Sea Water. Intrusion of N2O by North Sea Water should be detectable at stratified stations, where the inflow of North Sea Water was clearly identified. In the Arkona Basin (station 109 and 113) this inflow was detectable at the bottom by lower temperature and higher oxygen concentrations; however, N2O 15
concentrations did not increase and remained close to equilibrium (Figs. 4a–b). These results point to only low advection of N2O by North Sea Water, and are supported by measurements of (Law and Owens, 1990). They found N2O concentrations close to equilibrium up to approximately 10 nmol L−1in the North Sea. Thus, the enhanced N2O values detected in layers affected by North Sea Water, for example in the Bornholm 20
Basin (station 200 and 213), must originate from biological in situ production since the inflow, rather than advection.
4.2 Biological aspects
Previous studies demonstrated the existence of N2O producing bacteria and investi-gated the biological pathways, namely nitrification and denitrification in the Baltic Sea 25
(Bauer, 2003; Brettar and H ¨ofle, 1993; Brettar et al., 2001). Both processes are com-monly inferred by correlations between N2O and oxygen or nitrate (Yoshinari, 1976;
BGD
3, 729–764, 2006
Nitrous oxide in the Baltic Sea S. Walter et al. Title Page Abstract Introduction Conclusions References Tables Figures J I J I Back Close
Full Screen / Esc
Printer-friendly Version Interactive Discussion
EGU Yoshida et al., 1989; Cohen and Gordon, 1978; Butler et al., 1989).
4.2.1 Anoxic waters
In general, in anoxic and H2S containing bottom waters N2O concentrations were con-stantly near zero, and therefore no correlation with either O2 or NO−3 was found. The N2O production by nitrification and denitrification might probably be inhibited by the 5
presence of H2S (Joye and Hollibaugh, 1995; Knowles, 1982; Sørensen et al., 1980), and while changing to anoxic conditions, N2O can be consumed during denitrification as an electron acceptor instead of oxygen (Elkins et al., 1978; Cohen and Gordon, 1978). However, in contrast to other authors (R ¨onner et al., 1983; Brettar and Rhein-heimer, 1992) we found low and uniformly distributed concentrations of N2O (up to 10
1.7 nmol L−1) in the anoxic water masses, which may have been residuals of a previ-ous production process during oxic conditions.
4.2.2 Suboxic waters
In suboxic waters and at the boundary to anoxic water masses N2O is expected to be mainly produced by denitrification processes (Codispoti et al., 2001), usually indicated 15
by decreasing NO−3 concentrations and a secondary NO−2 peak (Wrage et al., 2001; Kristiansen and Schaanning, 2002). These indicators for denitrification were found only at the Far ¨o Deep (station 286, 90 m). However, no accumulation of N2O was observed, rather a local minimum of N2O was found (Fig. 6a, indicated by arrows). Hannig et al. (2005) investigated denitrification associated microorganisms in the Gotland Basin 20
(station 271 and 286) in October 2003. They did not find denitrification activities in suboxic water masses, but a high denitrifying potential restricted to a narrow depth range at the oxic-anoxic interface and the sulfidic zone. However, in these depths an accumulation of N2O was not found either.
The local minimum of N2O was observed not only at the Far ¨o Deep, but also at the 25
BGD
3, 729–764, 2006
Nitrous oxide in the Baltic Sea S. Walter et al. Title Page Abstract Introduction Conclusions References Tables Figures J I J I Back Close
Full Screen / Esc
Printer-friendly Version Interactive Discussion
EGU residual signal of the small inflow event in August 2002 could be observed at these
depths between 90 and 110 m (Feistel et al., 2003). We assume that this minimum of N2O is a previous signal of former anoxic bottom water, pushed up by the small inflow event in August 2002. The restriction of denitrification activity to a narrow depth range at anoxic-oxic boundaries was not only reported by Hannig et al. (2005) but also by 5
Brettar et al. (2001). Therefore, the lack of denitrification signals leads to the question, which processes might cause the measured N2O concentrations.
4.2.3 Correlation between N2O and O2
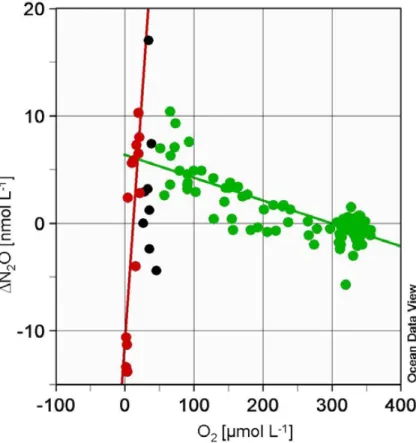
In general, in oxic waters N2O is positively correlated with nitrate, negatively with oxygen, indicating a production by nitrification. However, below a distinct thresh-10
old of oxygen concentration a clear inversion of relationship was found. Figure 8 shows the correlation between∆N2O and O2 in the Baltic Sea. At O2 concentrations >50 µmol L−1∆N2O is clearly negatively correlated with O2, indicating production by ni-trification (see Fig. 8, green data points). At O2concentrations <20 µmol L−1∆N2O and O2 were significantly positively correlated (see Fig. 8, red data points), data between 15
20 µmol L−1 and 50 µmol L−1 were extremely scattered (see Fig. 8, black data points). These findings suggest a change in N2O converting processes. Particularly in envi-ronments with rapidly changing conditions it is advantageous for microorganisms to be able to switch between different metabolic pathways. The change between aerobic and anaerobic metabolism and thus the yield of N2O during these processes is probably 20
controlled particularly by the O2 concentration, although little is known about the de-tailed mechanisms (Baumann et al., 1996; John, 1977; Sørensen, 1987). Our results suggest a production of N2O during nitrification until an oxygen threshold of around 20–50 µmol L−1, whereas the exact concentration is not to be determined due to the scattered data. Below this threshold N2O seemed to be degraded; probably used as an 25
electron acceptor instead of oxygen and thereby reduced to N2(Elkins et al., 1978; Co-hen and Gordon, 1978). In the literature, threshold values of 2 µmol L−1 for nitrification
BGD
3, 729–764, 2006
Nitrous oxide in the Baltic Sea S. Walter et al. Title Page Abstract Introduction Conclusions References Tables Figures J I J I Back Close
Full Screen / Esc
Printer-friendly Version Interactive Discussion
EGU are reported (Carlucci and McNally, 1969; Gundersen et al., 1966). For several nitrifiers
the ability to switch between “classical” nitrification, nitrifier-denitrification and aerobic denitrification was shown (Wrage et al., 2001; Whittaker et al., 2000; Zart et al., 2000; Zehr and Ward, 2002). The oxygen sensitivity is species-specific and also enzyme-specific; therefore the scatter of data might reflect the variety of involved species and 5
enzymes (Jiang and Bakken, 2000; Goreau et al., 1980; Wetzel, 1983; Robertson et al., 1988; Richardson, 2000). Bauer (2003) investigated NH+4 oxidizing bacteria in the eastern Gotland Basin, and found similar bacterial communities at different depths; their nitrification activities however depended on O2concentrations.
Therefore, the ability of nitrifiers to perform denitrifying processes and the lack of 10
“classical” denitrifying signals, a switch of N2O producing processes by nitrifiers can be assumed. These findings are in agreement with the assumptions of R ¨onner (1983), who also assumed, that nitrification is the main N2O production pathway in the Baltic Sea.
Alternatively, it is also possible to interpret the data from the hydrographical or tem-15
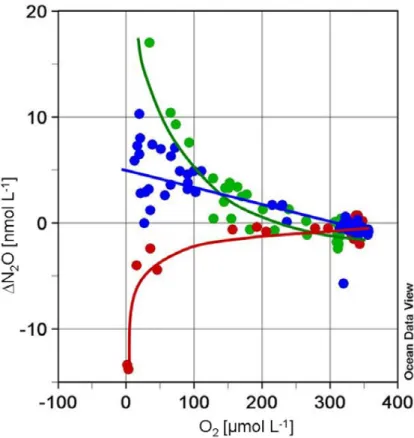
poral point of view. Figure 9 shows the same data set as shown in Fig. 8. This time the data set is grouped not according to the oxygen concentrations but to the affiliation to different basins. Station 286 was excluded due to its transitional character. At this station anoxic conditions in the deep waters were found similar to other stations in the western Gotland Basin, but H2S concentrations were decreasing towards the bottom. 20
This indicates beginning ventilation, however still too weak to lead to oxic conditions. In the stratified basins such as the Bornholm Basin, and the eastern and western Gotland Basin correlations of∆N2O and O2 were regionally different and not always linear (Figs. 5b–c, 6b–c, 7a, 9). Particularly in the Bornholm Basin, N2O and oxygen as well as N2O and nitrate showed significant non-linear relationships (Figs. 5b–c, 9). The 25
Bornholm Basin, which was anoxic before the inflow (Schmidt, 2002), was ventilated by North Sea Water in January 2003, months before the northern part of the eastern Gotland Basin was affected by the inflow (Nausch, 2003a; Nausch et al., 2004). In October 2003 the oxygen conditions were already switching back to suboxic
condi-BGD
3, 729–764, 2006
Nitrous oxide in the Baltic Sea S. Walter et al. Title Page Abstract Introduction Conclusions References Tables Figures J I J I Back Close
Full Screen / Esc
Printer-friendly Version Interactive Discussion
EGU tions (Nausch, 2003c; Wasmund, 2003), visible by decreasing oxygen concentrations
compared to the beginning of the year. Accordingly the duration of elevated oxygen concentration in the respective basins may contribute to the observed accumulation of N2O. In the eastern Gotland Basin (Figs. 6b–c, 9) the anoxic conditions changed a few months after the Bornholm Basin: the Gotland Deep was ventilated by North Sea 5
Water in May 2003 (Nausch, 2003b). Thus, there was less time for N2O accumulation. For various communities of NH+4 oxidizing bacteria different lag times after switching from anoxic to oxic incubations were shown and the production of N2O might not have started directly after the ventilation by North Sea Water (Bodelier et al., 1996). In the western Gotland Basin (Figs. 7b–c, 9) no ventilation by North Sea Water had occurred 10
by October 2003, therefore degradation of N2O at the oxic-anoxic interface was found. We suspect that the correlation between∆N2O and O2in the Bornholm Basin and the eastern Gotland Basin will become similar to those of the western Gotland Basin with time, when the conditions change to anoxic.
Summarizing, we assume a conversion of N2O mainly by nitrifiers, depending on 15
oxygen concentration and with significant spatial and temporal characteristics. 4.3 Estimated contribution of the North Sea Water inflow to the production of N2O The estimated N2O content in the stratified basins showed distinctly higher values after the inflow of the North Sea Water than before. The N2O concentration in the North Sea Water was assumed to be near equilibrium, so there was no significant advection of 20
N2O from the North Sea. Thus, the observed elevated N2O concentrations in the Baltic Sea basins result from a stimulation of N2O production by the inflow, most likely by advection of oxygen (see Table 1).
Although more than 1000 tons of N2O were produced, it is questionable whether the North Sea Water inflow makes the Baltic Sea a source of atmospheric N2O. Due to the 25
strong salinity stratification, it can be assumed that the formed N2O stays below the permanent halocline, and therefore it will not reach the atmosphere. Commonly N2O budgets were modelled as a function of nitrification and denitrification. Seitzinger and
BGD
3, 729–764, 2006
Nitrous oxide in the Baltic Sea S. Walter et al. Title Page Abstract Introduction Conclusions References Tables Figures J I J I Back Close
Full Screen / Esc
Printer-friendly Version Interactive Discussion
EGU Kroeze (1998) modelled the distribution of N2O production, amongst others based on
the input of nitrogen compounds into estuaries by rivers. However, estimations of global N2O emissions do not or only to a small extent take into account the hydrographic aspects. The stratification of the water column probably lead to a reduced release of calculated amounts, and accordingly to an overestimation of N2O emissions.
5
The assumption of remaining N2O below the halocline leads to the question, whether and to what extent the nitrogen cycle might be influenced.
Based on the calculated N2O content of the basins and the assumption of nitrifica-tion as the main producnitrifica-tion pathway N2O production rates and nitrification rates were estimated (Table 2). These nitrification rates are in good agreement with previously 10
published rates for the Baltic Sea (Enoksson, 1986; Bauer 2003). Bauer (2003) cal-culated for the eastern Gotland Basin mean nitrification rates of 21.6±11.1 nmol L−1 at 60 m depth, respectively 44.3±33.1 nmol L−1 at 100 m depth.
These rates are comparably low (e.g. Bianchi et al., 1999); therefore the influence on the nitrogen cycle in the Baltic Sea might be small, too. N2O might play a minor role 15
as a reserve- or buffer-molecule during the change to anoxic conditions, preserving nitrifying processes in exchange for oxygen for a short while.
5 Conclusions
In January 2003 a major inflow of cold, highly saline and oxygen-rich North Sea Water was observed, terminating the ongoing stagnation period in parts of the central Baltic 20
Sea.
– In agreement with previous studies, we found N2O production mainly in oxic water masses below the Winter Water layer.
– We found no indication for advection of N2O by North Sea Water; however, the environmental conditions for N2O production were clearly changed due to the 25
BGD
3, 729–764, 2006
Nitrous oxide in the Baltic Sea S. Walter et al. Title Page Abstract Introduction Conclusions References Tables Figures J I J I Back Close
Full Screen / Esc
Printer-friendly Version Interactive Discussion
EGU
– The inflow leads to a stimulation of N2O production below the permanent halo-cline, but due to the halohalo-cline, the Baltic Sea is not a significant source of N2O to the atmosphere.
– There was no indication for an accumulation of N2O during denitrification. In oxic and suboxic water masses nitrification seems to be the main production pathway. 5
The occurrence of nitrifier-denitrification and aerobic denitrification is possible, but needs further investigations.
Acknowledgements. We thank the officers and crew of R/V Gauss for their excellent
sup-port. We especially thank R. Hoffmann (MPI for Chemistry, Mainz) for the calibration of the standard gas mixtures, and the colleagues from the IOW for providing the CTD data and the
10
nutrients. The investigations were financially supported by the Deutsche Forschungsgemein-schaft through grant WA1434/1. The German part of the HELCOM COMBINE program is conducted by the Leibniz Institut f ¨ur Ostseeforschung Warnem ¨unde on behalf of the Bunde-samt f ¨ur Seeschiffahrt und Hydrographie, Hamburg and is funded by the Bundesministerium f ¨ur Verkehr, Bau und Stadtentwicklung, Berlin.
15
References
Bange, H. W., Rapsomanikis, S., and Andreae, M. O.: Nitrous oxide in coastal waters, Glob. Biogeochem. Cycles, 10(1), 197–207, 1996.
Bange, H. W., Rapsomanikis, S., and Andreae, M. O.: Nitrous oxide cycling in the Arabian Sea, J. Geophys. Res.-Oceans, 106(C1), 1053–1065, 2001.
20
Bauer, S.: Structure and function of nitrifying bacterial communities in the Eastern Gotland Basin (Central Baltic Sea), Rostock, Univ., Diss., 2003, H 2003 B 4373, 2003.
Baumann, B., Snozzi, M., Zehnder, A. J. B., and van der Meer, J. R.: Dynamics of denitrification activity of Paracoccus denitrificans in continuous culture during aerobic-anaerobic changes, J. Bacteriol., 178(15), 4367–4374, 1996.
25
Bianchi, M., Fosset, C., and Conan, P.: Nitrification rates in the NW Mediterranean Sea, Aquatic Microbial Ecology, 17(3), 267–278, 1999.
BGD
3, 729–764, 2006
Nitrous oxide in the Baltic Sea S. Walter et al. Title Page Abstract Introduction Conclusions References Tables Figures J I J I Back Close
Full Screen / Esc
Printer-friendly Version Interactive Discussion
EGU
Bodelier, P. L. E., Libochant, J. A., Blom, C. W. P., and Laanbroek, H. J.: Dynamics of nitrifica-tion and denitrificanitrifica-tion in root-oxygenated sediments and adaptanitrifica-tion of ammonia-oxidizing bacteria to low-oxygen or anoxic habitats, Appl. Environ. Microbiol., 62, 4100–4107, 1996. Brettar, I. and H ¨ofle, M. G.: Nitrous oxide producing heterotrophic bacteria from the water
column of the central Baltic: abundance and molecular identification, Mar. Ecol. Prog. Ser.,
5
94, 253–265, 1993.
Brettar, I., Moore, E. R. B., and H ¨ofle, M. G.: Phylogeny and abundance of novel denitrifying bacteria isolated from the water column of the central Baltic Sea, Microb. Ecol., 42(3), 295– 305, 2001.
Brettar, I. and Rheinheimer, G.: Denitrification in the central Baltic: evidence for hydrogen
10
sulfide oxidation as motor of denitrification at the oxic-anoxic interface, Mar. Ecol. Prog. Ser., 77(2–3), 157–169, 1991.
Brettar, I. and Rheinheimer, G.: Influence of carbon availability on denitrification in the Central Baltic Sea, Limnol. Oceanogr., 37(6), 1146–1163, 1992.
Butler, J. H., Elkins, J. W., Thompson, T. M., and Egan, K. B.: Tropospheric and dissolved N2O
15
of the West Pacific and East Indian Oceans during the El-Nino Southern Oscillation event of 1987, J. Geophys. Res.-Atmos., 94(D12), 14 865–14 877, 1989.
Carlucci, A. F. and McNally, P. M.: Nitrification by marine bacteria in low concentrations of substrate and oxygen, Limnol. Oceanogr., 14, 736–739, 1969.
Codispoti, L. A., Brandes, J. A., Christensen, J. P., Devol, A. H., Naqvi, S. W. A., Paerl, H. W.,
20
and Yoshinari, T.: The oceanic fixed nitrogen and nitrous oxide budgets: Moving targets as we enter the anthropocene?, Sci. Mar., 65, 85–105, 2001.
Codispoti, L. A., Yoshinari, T., and Devol, A. H.: Suboxic respiration in the oceanic water col-umn, in: Respiration in aquatic ecosystems, edited by: Del Giorgio, P. A. and Williams, P. J. l. B., p. 225–247, Oxford University Press, Oxford, 2005.
25
Cohen, Y. and Gordon, L. I.: Nitrous oxide in the oxygen minimum of the eastern tropical North Pacific: Evidence for its consumption during denitrification and possible mechanisms for its production, Deep-Sea Res., 25(6), 509–524, 1978.
Dahlke, S., Wolff, S., Meyer-Reil, L.-A., Bange, H. W., Ramesh, R., Rapsomanikis, S., and Andreae, M. O.: Bodden waters (southern Baltic Sea) as a source of methane and nitrous
30
oxide, in: Proceedings in Marine Sciences, Volume 2: Muddy Coast Dynamics and Resource Management, edited by: Flemming, B. W., Delafontaine, M. T., and Liebezeit, G., p. 137–148, Elsevier Science, Amsterdam, 2000.
BGD
3, 729–764, 2006
Nitrous oxide in the Baltic Sea S. Walter et al. Title Page Abstract Introduction Conclusions References Tables Figures J I J I Back Close
Full Screen / Esc
Printer-friendly Version Interactive Discussion
EGU
Elkins, J. W., Wofsy, S. C., McElroy, M. B., Kolb, C. E., and Kaplan, W. A.: Aquatic sources and sinks for nitrous oxide, Nature, 275(5681), 602–606, 1978.
Enoksson, V.: Nitrification rates in the Baltic Sea: Comparison of three isotope techniques, Appl. Environ. Microbiol., 51(2), 244–250, 1986.
Feistel, R.: IOW Cruise report 11/03/02, March 2003,http://www.io-warnemuende.de/projects/
5
monitoring/documents/cr110302.pdf, 2003.
Feistel, R., Nausch, G., Matth ¨aus, W., and Hagen, E.: Temporal and spatial evolution of the Baltic deep water renewal in spring 2003, Oceanol., 45(4), 623–642, 2003.
Feistel, R. and Nausch, G.: Water exchange between the Baltic Sea and the North Sea and conditions in the deep basins, HELCOM indicator fact sheets/Baltic Marine
Envi-10
ronment Protection Commission – Helsinki Commission,http://www.helcom.fi/environment/
indicators2003/inflow.html, 2003.
Goreau, T. J., Kaplan, W. A., Wofsy, S. C., McElroy, M. B., Valois, F. W., and Watson, S. W.: Production of nitrite and nitrous oxide by nitrifying bacteria at reduced concentrations of oxygen, Appl. Environ. Microbiol., 40(3), 526–532, 1980.
15
Gundersen, K., Carlucci, A. F., and Bostr ¨om, K.: Growth of some chemoautotrophic bacteria at different oxygen tensions, Experientia, 22, 229–230, 1966.
Hannig, M., Braker, G., Lavik, G., Kuypers, M., Dippner, J. W., and J ¨urgens, K.: Structure and activity of denitrifying bacteria in the water column of the Gotland Basin (Baltic Sea), Abstract presented at the SPOT-ON conference 2005, Warnem ¨unde, 26 June–1 July 2005.
20
HELCOM: Third periodic assessment of the state of the marine environment of the Baltic Sea 1989–1993, Balt. Sea Environ. Proc. no. 64b, p75, http://www.baltic.vtt.fi/balticinfo/index.
html, 1996.
Jiang, Q. Q. and Bakken, L. R.: Nitrous oxide production and methane oxidation by different ammonia-oxidizing bacteria, Appl. Environ. Microbiol., 65, 2679–2684, 2000.
25
Jørgensen, B. B. and Sørensen, J.: Seasonal cycles of O2, NO−3 and SO2−4 reduction in estu-arine sediments: The significance of a NO−3 reduction maximum in spring, Mar. Ecol. Prog. Ser., 24, 65–74, 1985.
John, P.: Aerobic and anaerobic bacterial respiration monitored by electrodes, J. Gen. Micro-biol., 98, 231–238, 1977.
30
Joye, S. B. and Hollibaugh, J. T.: Influence of sulfide inhibition of nitrification on nitrogen regen-eration in sediments, Science, 270, 623–625, 1995.
BGD
3, 729–764, 2006
Nitrous oxide in the Baltic Sea S. Walter et al. Title Page Abstract Introduction Conclusions References Tables Figures J I J I Back Close
Full Screen / Esc
Printer-friendly Version Interactive Discussion
EGU
Kristiansen, S. and Schaanning, M. T.: Denitrification in the water column of an intermittently anoxic fjord, Hydrobiologia, 469, 77–86, 2002.
Law, C. S. and Owens, N. J. P.: Denitrification and nitrous oxide in the North Sea, Neth. J. Sea Res., 25(1–2), 65–74, 1990.
Meier, M. H. E.: Modelling the age of Baltic seawater masses: Quantification and steady
5
state sensitivity experiments, J. Geophys. Res., 110(C02006), doi:10.1029/2004JC002607, 2005.
Nagel, K.: IOW Cruise report 11/03/01, February 2003, http://www.io-warnemuende.de/
projects/monitoring/documents/cr110301.pdf, 2003.
Naqvi, S. W. A., Jayakumar, D. A., Narvekar, P. V., Naik, H., Sarma, V., D’Souza, W., Joseph,
10
S., and George, M. D.: Increased marine production of N2O due to intensifying anoxia on the Indian continental shelf, Nature, 408(6810), 346–349, 2000.
Nausch, G.: IOW Cruise Report 40/03/22, January 2003, http://www.io-warnemuende.de/
projects/monitoring/documents/cr400322.pdf, 2003a.
Nausch, G.: IOW Cruise Report 44/03/03, May 2003,http://www.io-warnemuende.de/projects/
15
monitoring/documents/cr440303.pdf, 2003b.
Nausch, G.: Cruise report 11/03/04, October 2003,http://www.io-warnemuende.de/projects/
monitoring/documents/cr110304.pdf, 2003c.
Nausch, G., Feistel, R., Lass, H.-U., Nagel, K., and Siegel, H.: Hydrographisch-chemische Zustandseinsch ¨atzung der Ostsee 2003, Meereswissenschaftliche Berichte, 59(1), 1–80,
20
2004.
Nausch, G., Matth ¨aus, W., and Feistel, R.: Hydrographic and hydrochemical conditions in the Gotland Deep area between 1992 and 2003, Oceanologia, 45(4), 557–569, 2003.
Ostrom, N. E., Russ, M. E., Popp, B., Rust, T. M., and Karl, D. M.: Mechanisms of nitrous oxide production in the subtropical North Pacific based on determinations of the isotopic
25
abundances of nitrous oxide and di-nitrogen, Chemosphere, Global Change Science, 2(3– 4), 281–290, 2000.
Popp, B. N., Westley, M. B., Toyoda, S., Miwa, T., Dore, J. E., Yoshida, N., Rust, T. M., Sansone, F. J., Russ, M. E., Ostrom, N. E., and Ostrom, P. H.: Nitrogen and oxygen isotopomeric constraints on the origins and sea-to-air flux of N2O in the oligotrophic subtropical North
30
Pacific gyre, Global Biogeochem. Cycles, 16(4), doi:10.1029/2001GB001806, 2002.
Prather, M., Ehhalt, D., Dentener, F., Derwent, R., Dlugokencky, E., Holland, E., Isaksen, I., Katima, J., Kirchhoff, V., Matson, P., Midgley, P., and Wang, M.: Atmospheric chemistry and
BGD
3, 729–764, 2006
Nitrous oxide in the Baltic Sea S. Walter et al. Title Page Abstract Introduction Conclusions References Tables Figures J I J I Back Close
Full Screen / Esc
Printer-friendly Version Interactive Discussion
EGU
greenhouse gases, in: Climate Change 2001: The Scientific Basis. Contribution of Working Group I to the Third Assessment Report of the Intergovernmental Panel on Climate Change, edited by: Houghton, J. T., Ding, Y., Griggs, D. J., Noguer, M., Van der Linden, P. J., Dai, X., Maskell, K., and Johnson, C. A., p. 239–287, Cambridge University Press, Cambridge, UK, 2001.
5
Richardson, D. J.: Bacterial respiration: A flexible process for a changing environment, Micro-biology, 146, 551–571, 2000.
Robertson, L. A. and Kuenen, J. G.: Aerobic denitrification – Old wine in new bottles, Anton Leeuwenhoek, J. Microbiol., 50(5–6), 525–544, 1984.
Robertson, L. A., Vanniel, E. W. J., Torremans, R. A. M., and Kuenen, J. G.: Simultaneous
10
nitrification and denitrification in aerobic chemostat cultures of Thiosphaera pantotropha, Appl. Environ. Microbiol., 54(11), 2812–2818, 1988.
R ¨onner, U.: Distribution, production and consumption of nitrous oxide in the Baltic Sea, Geochim. Cosmochim. Acta, 47, 2179–2188, 1983.
R ¨onner, U., S ¨orensson, F., and Holmhansen, O.: Nitrogen assimilation by phytoplankton in the
15
Scotia Sea, Polar Biol., 2(3), 137–147, 1983.
R ¨onner, U. and S ¨orensson, F.: Denitrification rates in the low-oxygen waters of the stratified Baltic Proper, Appl. Environ. Microbiol., 50, 801–806, 1985.
Schinke, H. and Matth ¨aus, W.: On the causes of major Baltic inflows – an analysis of long time series, Continental Shelf Research, 18, 67–97, 1998.
20
Schmidt, M.: IOW Cruise Report 11/02/03, October 2002, http://www.io-warnemuende.de/
projects/monitoring/documents/cr110203.pdf, 2002.
Seitzinger, S. P. and Kroeze, C.: Global distribution of nitrous oxide production and N inputs in freshwater and coastal marine ecosystems, Global Biogeochem. Cycles, 12(1), 93–113, 1998.
25
Seitzinger, S. P., Kroeze, C., and Styles, R. V.: Global distribution of N2O emissions from aquatic systems: Natural emissions and anthropogenic effects, Chemosphere: Global Sci-ence Change, 2, 267–279, 2000.
Sørensen, J.: Nitrate reduction in marine sediment: Pathways and interactions with iron and sulfur cycling, Geomicrobiology Journal, 5(3–4), 401–422, 1987.
30
Sørensen, J., Tiedje, J. M., and Firestone, R. B.: Inhibition by sulfide of nitric and nitrous oxide reduction by denitrifying Pseudomonas fluorescens, Appl. Environ. Microbiol., 39(1), 105– 108, 1980.
BGD
3, 729–764, 2006
Nitrous oxide in the Baltic Sea S. Walter et al. Title Page Abstract Introduction Conclusions References Tables Figures J I J I Back Close
Full Screen / Esc
Printer-friendly Version Interactive Discussion
EGU
Vollack, K. U. and Zumft, W. G.: Nitric oxide signaling and transcriptional control of denitrifica-tion genes in Pseudomonas stutzeri, J. Bacteriol., 183(8), 2516–2526, 2001.
Wasmund, N.: IOW Cruise Report 44/03/07, July–August 2003,http://www.io-warnemuende.
de/projects/monitoring/documents/cr440307.pdf, 2003.
Weiss, R. F.: The solubility of nitrogen, oxygen and argon in water and seawater, Deep-Sea
5
Res., 17, 721–735, 1970.
Weiss, R. F. and Price, B. A.: Nitrous oxide solubility in water and seawater, Mar. Chem., 8, 347–359, 1980.
Wetzel, R. G.: Limnology, Saunders College Publishing, Philadelphia, Pa., 1983.
Whittaker, M., Bergnamm, D., Arciero, D., and Hooper, A. B.: Electron transfer during the
10
oxidation of ammonia by the chemolithotrophic bacterium Nitrosomonas europaea, Biochim. Biophys. Acta, 1459, 346–355, 2000.
WMO: Scientific assessment of ozone depletion: 2002, pp. 498, WMO (World Meteorological Organization), Geneva, 2003.
Wrage, N., Velthof, G. L., van Beusichem, M. L., and Oenema, O.: Role of nitrifier denitrification
15
in the production of nitrous oxide, Soil Biol. Biochem., 33(12–13), 1723–1732, 2001.
Yamagishi, H., Yoshida, N., Toyoda, S., Popp, B. N., Westley, M. B., and Watanabe, S.: Contri-butions of denitrification and mixing on the distribution of nitrous oxide in the North Pacific, Geophys. Res. Lett., 32(4), LO4603, doi:10.1029/2004GLO21458, 2005.
Yoshida, N., Morimoto, H., Hirano, M., Koike, I., Matsuo, S., Wada, E., Saino, T., and Hattori, A.:
20
Nitrification rates and15N abundances of N2O and NO−3 in the western North Pacific, Nature, 342, 895–897, 1989.
Yoshinari, T.: Nitrous oxide in the sea, Mar. Chem., 4, 189–202, 1976.
Yoshinari, T., Altabet, M. A., Naqvi, S. W. A., Codispoti, L., Jayakumar, A., Kuhland, M., and De-vol, A.: Nitrogen and oxygen isotopic composition of N2O from suboxic waters of the eastern
25
tropical North Pacific and the Arabian Sea – Measurement by continuous-flow isotope-ratio monitoring, Mar. Chem., 56(3–4), 253–264, 1997.
Zart, D., Schmidt, I., and Bock, E.: Significance of gaseous NO for ammonia oxidation by
Nitrosomonas eutropha, Antonie van Leeuwenhoek, 77, 49–55, 2000.
Zehr, J. P. and Ward, B. B.: Nitrogen cycling in the ocean: New perspectives on processes and
30
BGD
3, 729–764, 2006
Nitrous oxide in the Baltic Sea S. Walter et al. Title Page Abstract Introduction Conclusions References Tables Figures J I J I Back Close
Full Screen / Esc
Printer-friendly Version Interactive Discussion
EGU
Table 1. Estimated N2O content of single basins in the Baltic Sea below the halocline, before
and after the inflow of North Sea Water in January 2003.
mean N2O conc. below the halocline (nmol L−1)
Water vol-ume (km3)
N2O content before
the inflow event (tons)
N2O content after
the inflow event (tons) Bornholm Basin >50 m 16.59±5.61 306 13±5 223±76 eastern Gotland Basin >70 m 18.46±3.43 1195 51±18 971±180 Σ 1501 64±23 1194±256 western Gotland Basin >70 m 0.97±0.34 657 28±10 28±10
BGD
3, 729–764, 2006
Nitrous oxide in the Baltic Sea S. Walter et al. Title Page Abstract Introduction Conclusions References Tables Figures J I J I Back Close
Full Screen / Esc
Printer-friendly Version Interactive Discussion
EGU
Table 2. Estimated nitrification rates in the Bornholm Basin and the eastern Gotland Basin,
based on the assumption of 0.3% N2O release during nitrification (Seitzinger and Kroeze, 1998).
∆mN2O dbasin Water volume N2O production rate nitrification rate
(tons) (day) (km3) (nmol L−1d−1) (nmol L−1d−1) Bornholm Basin 220±81 265 306 0.059±0.023 19.62±7.57 eastern
Gotland Basin
BGD
3, 729–764, 2006
Nitrous oxide in the Baltic Sea S. Walter et al. Title Page Abstract Introduction Conclusions References Tables Figures J I J I Back Close
Full Screen / Esc
Printer-friendly Version Interactive Discussion
EGU
Fig. 1. Map of the western, southern and central Baltic Sea with locations of the stations. The
stations were grouped as follows: well-mixed stations are number 10, 12, 22, 30, 41, 46, 121, 130, 133, 360, OB Boje and OB 4; the Arkona Basin is represented by station 109 and 113; the Bornholm Basin is represented by station 140, 200, 213 and 222; in the eastern Gotland Basin station 250, 259, 260, 271 and 286 were grouped; and the western Gotland Basin is represented by station 240, 245 and 284. The arrow indicates the main flow direction of North Sea Water.
BGD
3, 729–764, 2006
Nitrous oxide in the Baltic Sea S. Walter et al. Title Page Abstract Introduction Conclusions References Tables Figures J I J I Back Close
Full Screen / Esc
Printer-friendly Version Interactive Discussion EGU
Figures
f01 f02Fig. 2. Characterization of different water masses in the Baltic Sea, for example at station 271
in the Eastern Gotland Basin (triangles: temperature (◦C), circles: salinity, squares: oxygen (µmol 101L−1).
BGD
3, 729–764, 2006
Nitrous oxide in the Baltic Sea S. Walter et al. Title Page Abstract Introduction Conclusions References Tables Figures J I J I Back Close
Full Screen / Esc
Printer-friendly Version Interactive Discussion EGU (a) (b) (c) f03 a) b) c)
Fig. 3. Well mixed basins; (a) left plot with profiles of N2O, calculated N2O equilibrium
con-centration, NO−3, NO−2 at station 41 in the Mecklenburg Bight and right plot with profiles of tem-perature, salinity and oxygen at station 41 in the Mecklenburg Bight;(b)∆N2O plotted against oxygen at all stations <30 m;(c)∆N2O plotted against NO−3 at all stations <30 m.
BGD
3, 729–764, 2006
Nitrous oxide in the Baltic Sea S. Walter et al. Title Page Abstract Introduction Conclusions References Tables Figures J I J I Back Close
Full Screen / Esc
Printer-friendly Version Interactive Discussion EGU a) b) c) f03 (a) (b) (c) f04
Fig. 4. Arkona Basin; (a) station 113 (Arkona Deep): left plot with profiles of N2O, N2O
equilib-rium concentration, NO−3, NO−2, right plot with profiles of temperature, salinity and oxygen, the arrow indicates the influence of North Sea Water; abbreviations see Fig. 2.;(b)∆N2O plotted against oxygen (at all stations in the Arkona Basin, y=−0.011 x+3.132, R2=0.67); (c) ∆N
2O
BGD
3, 729–764, 2006
Nitrous oxide in the Baltic Sea S. Walter et al. Title Page Abstract Introduction Conclusions References Tables Figures J I J I Back Close
Full Screen / Esc
Printer-friendly Version Interactive Discussion EGU (a) (b) (c) f05
Fig. 5. Central Bornholm Basin; (a) station 213 (Bornholm Deep): left plot with profiles of
N2O, N2O equilibrium concentration, NO − 3, NO
−
2, right plot with profiles of temperature, salinity
and oxygen, abbreviations see Fig. 2;(b)∆N2O plotted against oxygen (at all stations in the Bornholm Basin, y=0.0003 x2−0.1531 x+19.517, R2=0.88); (c) ∆N
2O plotted against NO − 3 (at
all stations in the Bornholm Basin, y=0.0585 x2+0.1438 x−0.6155, R2=0.90).
BGD
3, 729–764, 2006
Nitrous oxide in the Baltic Sea S. Walter et al. Title Page Abstract Introduction Conclusions References Tables Figures J I J I Back Close
Full Screen / Esc
Printer-friendly Version Interactive Discussion
EGU
(a) station 271 (eastern Gotland Deep)
station 286 (Farö Deep)
(b) (c)
f06
Fig. 6. Eastern Gotland Basin; (a) station 271 (Gotland Deep, upper plots) and 286 (Far ¨o
Deep, lower plots): left plots with profiles of N2O, N2O equilibrium concentration, NO−3, NO−2; right plots with profiles of temperature, salinity and oxygen, the arrows indicate local N2O min-ima, abbreviations see Fig. 2;(b)∆N2O plotted against oxygen (at all stations in the Eastern Gotland Basin, y=−0.019 x+5.625, R2=0.67 (except for O2<3 µmol L−1)); (c) ∆N2O plotted against NO−3 (at all stations in the Eastern Gotland Basin, y=0.639 x−0.459, R2=0.62 (except for O2<3 µmol L−1)).
BGD
3, 729–764, 2006
Nitrous oxide in the Baltic Sea S. Walter et al. Title Page Abstract Introduction Conclusions References Tables Figures J I J I Back Close
Full Screen / Esc
Printer-friendly Version Interactive Discussion EGU (a) (b) (c) f07 f08
Fig. 7. Western Gotland Basin; (a) station 284 (Landsort Deep): left plot with profiles of N2O,
N2O equilibrium concentration, NO−3, NO−2, right plot with profiles of temperature, salinity and oxygen, abbreviations see Fig. 2;(b)∆N2O plotted against oxygen (at all stations in the West-ern Gotland Basin; y=2.2467 Ln (x)−13.322, R2=0.86, (with exception of O2<0 µmol L−1));(c)
∆N2O plotted against NO −
3 (at all stations in the Western Gotland Basin).
BGD
3, 729–764, 2006
Nitrous oxide in the Baltic Sea S. Walter et al. Title Page Abstract Introduction Conclusions References Tables Figures J I J I Back Close
Full Screen / Esc
Printer-friendly Version Interactive Discussion EGU a) b) c)
f07
f08
Fig. 8. Correlation between ∆N2O and O2 in the Baltic Sea. Correlations were
calcu-lated for oxic waters with O2concentrations >50 µmol L−1(green coloured, y=−0.019 x+5.41, R2=−0.70) and <20 µmol L−1 (red coloured, y=1.038 x−11.36, R2=0.81). These concentra-tions were empirically tested and gave the best fittings for both correlaconcentra-tions.
BGD
3, 729–764, 2006
Nitrous oxide in the Baltic Sea S. Walter et al. Title Page Abstract Introduction Conclusions References Tables Figures J I J I Back Close
Full Screen / Esc
Printer-friendly Version Interactive Discussion
EGU
f09
Fig. 9. Correlation between ∆N2O and O2 in the Baltic Sea; Correlations were calculated
for the Bornholm Basin (station 140, 200, 213, 222, green coloured, y=−6.83 Ln(x)+37.88, R2=0.86), the eastern Gotland Basin (station 259, 250, 260, 271, blue coloured, y=−0.02 x+5.88, R2=0.70) and the western Gotland Basin (station 284, 240, 245, red coloured, y=2.25 Ln(x)−13.32, R2=0.86). Anoxic data and station 286 were excluded.