HAL Id: hal-02123348
https://hal.archives-ouvertes.fr/hal-02123348
Submitted on 1 Apr 2021
HAL is a multi-disciplinary open access
archive for the deposit and dissemination of
sci-entific research documents, whether they are
pub-lished or not. The documents may come from
teaching and research institutions in France or
abroad, or from public or private research centers.
L’archive ouverte pluridisciplinaire HAL, est
destinée au dépôt et à la diffusion de documents
scientifiques de niveau recherche, publiés ou non,
émanant des établissements d’enseignement et de
recherche français ou étrangers, des laboratoires
publics ou privés.
Comment on “Earthquake-induced prompt gravity
signals identified in dense array data in Japan” by
Kimura et al.
Martin Vallée, Jean Paul Ampuero, Kévin Juhel, Pascal Bernard, Jean-Paul
Montagner, Matteo Barsuglia
To cite this version:
Martin Vallée, Jean Paul Ampuero, Kévin Juhel, Pascal Bernard, Jean-Paul Montagner, et al..
Com-ment on “Earthquake-induced prompt gravity signals identified in dense array data in Japan” by
Kimura et al.. Earth Planets Space, 2019, 71 (1), pp.51. �10.1186/s40623-019-1030-x�. �hal-02123348�
COMMENT
Comment on “Earthquake-induced prompt
gravity signals identified in dense array data
in Japan” by Kimura et al.
Martin Vallée
1*, Jean Paul Ampuero
2, Kévin Juhel
1,3, Pascal Bernard
1, Jean‑Paul Montagner
1and Matteo Barsuglia
3Abstract
A recent work by Kimura et al. (Earth Planets Space 71:27, 2019. https ://doi.org/10.1186/s4062 3‑019‑1006‑x) (hereaf‑ ter referred to as K19) claims to provide the first observational constraints on the prompt elastogravity signals (PEGS) induced by an earthquake. To make their claim, the authors argue that the observations shown in Vallée et al. (Sci‑ ence 358:1164–1168, 2017. https ://doi.org/10.1126/scien ce.aao07 46) (hereafter referred to as V17) are spurious and their modeling inaccurate. Here we show that K19’s claim is invalid because it is based on flawed data processing. In fact, K19’s analysis involves an incomplete correction of the instrument response of broadband seismic sensors, which essentially dismisses low‑frequency components of the data that are critical for the detection of intrinsically low‑frequency signals such as PEGS. As a direct consequence, signals are much more difficult to observe than in V17, where the low part of the signal spectrum is carefully taken into account. This deficient data processing also explains why the signal amplitude reported by K19 after stacking data from multiple stations is lower than the individual signals reported by V17. Moreover, failing to take appropriate measures of data quality control, K19 used signals from low‑quality sensors to call into question the signals detected by high‑quality sensors. Finally, K19 use an inadequate simulation approach to model PEGS, in which the important effect of the ground acceleration induced by gravity changes is ignored. In summary, K19 do not show any viable arguments to question the observations and modeling of PEGS presented in V17.
Keywords: Prompt elastogravity signals, Tohoku earthquake, Instrument response, Noise levels
© The Author(s) 2019. This article is distributed under the terms of the Creative Commons Attribution 4.0 International License (http://creat iveco mmons .org/licen ses/by/4.0/), which permits unrestricted use, distribution, and reproduction in any medium, provided you give appropriate credit to the original author(s) and the source, provide a link to the Creative Commons license, and indicate if changes were made.
Introduction
The study of prompt elastogravity signals (PEGS) gener-ated by earthquakes is now becoming a mature research area. After the pioneering works in modeling (Harms et al. 2015; Harms 2016; Heaton 2017) and observa-tion (Montagner et al. 2016), PEGS have been directly observed, understood and modeled in the last 2 years (Vallée et al. 2017; Juhel et al. 2018, 2019; Vallée and Juhel 2019). In particular, Vallée et al. (2017) (hereafter referred to as V17) showed that the data from regional high-quality broadband sensors recording the 2011
Tohoku earthquake exhibit the distinctive features of PEGS. A downward acceleration trend is clearly observed before the P-waves arrival (Fig. 1 of V17), and its shape and amplitude at each station is consistent with modeling that includes both the coseismic gravity perturbations and their induced elastic Earth response (Fig. 3 of V17). Juhel et al. (2019) confirmed, with a normal-mode mod-eling approach, the accuracy of the results of V17. Finally, PEGS observation is not restricted to earthquakes with magnitude larger than 9, as shown by recent observations made for earthquakes with magnitudes between 7.9 and 8.8 (Vallée and Juhel 2019).
In this context, Kimura et al. (2019) (hereafter referred to as K19) re-examined the data of the 2011 Tohoku earthquake and claimed, to our surprise, that their study “provides the first constraint of prompt
Open Access
*Correspondence: vallee@ipgp.fr
1 Institut de Physique du Globe de Paris, Sorbonne Paris Cité, Université Paris Diderot, CNRS, Paris, France
Page 2 of 6 Vallée et al. Earth, Planets and Space (2019) 71:51
elastogravity signals by observation.” These authors argued that observations made by V17 are not con-firmed by analysis of data from neighboring stations and “were only local noises,” “outliers,” or artifacts due to signal processing. Here, we will show that all the arguments of K19 against the soundness of the analysis by V17 and the claim of originality of PEGS observation made by K19 are invalid. We will focus on showing the following:
1. The reasons why K19 failed to confirm the observa-tions by V17 are trivial (“Biased observational analy-sis made by K19” section). We show that the data processing used by K19 involves an incomplete cor-rection for instrument response that de-emphasizes the low-frequency components of the data. However, PEGS are intrinsically low-frequency signals. The very clear signals shown by V17 are weaker or even unobservable in the analysis of K19 because the lat-ter did not consider a suitable frequency band. In this section, we will also demonstrate the robustness of the V17 data processing.
2. In addition to their inappropriate data processing, K19 do not take into account station quality and erroneously discard high-quality signals on the basis of noisy signals from neighboring stations. If K19 had used appropriate data processing and quality control criteria, their study would have simply confirmed the V17 observations.
3. The claims of originality by K19 are invalid because they are based on inappropriate data processing. Fail-ing to detect PEGS on data from individual stations (with incorrect processing), K19 showed that PEGS are detected after stacking data from multiple sta-tions. But by doing so, the detection significance of their stack remains lower than even only one of the individual signals shown in V17. Based on this stack-ing of incorrectly processed data, K19 incorrectly claimed their result provides the first reliable PEGS observation.
4. Inappropriate data processing also misled K19 into questioning the PEGS modeling made in V17. The argument put forward by K19 is that the amplitude of their stack (of incorrectly processed data) is smaller than the signals observed and modeled by V17. We will show (in the “Erroneous conclusions about PEGS amplitudes” section) that stacking the same data as K19, but after instrument response correction fol-lowing V17’s procedure, results in a signal stack with the same amplitude as predicted by V17’s model and with a much higher significance than K19’s sub-opti-mal stack.
Biased observational analysis made by K19
Inappropriate data processing with incomplete instrument response correction
K19 used the following data preprocessing steps: (1) Raw data were divided by the sensitivity coefficient of the broadband seismometers, which is defined as the veloc-ity-to-counts conversion factor in the frequency band where the instrument response is flat, and (2) the result was converted into acceleration by differentiation. The frequency-independent conversion factor applied in step 1 is adequate for signals whose frequencies of interest are between a few 0.01 Hz to ~ 10 Hz, but is insufficient for PEGS observation. As shown in the theoretical study of Harms et al. (2015), the accelerations in PEGS are related to the second time integral of the seismic moment func-tion, and thus their spectrum behaves as 1/f3 at
frequen-cies f lower than the earthquake corner frequency. PEGS are therefore low-frequency signals, and the potential to observe them with seismometers is maximized when the lowest reliable frequencies are fully used. That is why V17 deconvolved the raw data by the instrument response and carefully used a causal high-pass filter at 0.002 Hz to mit-igate the instrumental noise at even lower frequencies.
Figure 1 shows how much of the low-frequency sig-nal in the asig-nalysis frequency band (0.002–0.03 Hz) is damped by the K19 processing compared to the V17 processing. The low-frequency signal loss induced by the K19 processing is very large for STS2 sensors (more than
Frequency (Hz)
K19 low frequency deficit
for STS2 sensors
K19 low frequency deficit for STS1 sensors
Fig. 1 Low‑frequency deficit induced by the instrument correction
made by K19. Black lines show how an acceleration signal with flat spectrum is recorded by several sensors as a function of frequency (modified from Fig. S1 of K19). The V17 correction uses the complete instrument response of the STS1 and STS2 sensors (dashed and dotted lines, respectively) while the K19 correction uses a frequency‑independent counts‑to‑velocity conversion factor (blue and red lines, respectively. The blue and red areas (for STS1 and STS2, respectively) highlight the difference between the two procedures in the analyzed frequency range, 0.002–0.03 Hz
a factor of 15 of reduction at 0.002 Hz), and is significant even for STS1 sensors (a factor larger than 2 at 0.002 Hz). Importantly, although it is not highlighted in K19 study, most of the sensors they used (9 out of 11 stations shown in their Fig. 2 and 22 out of the 27 sensors used in their stacking analysis) are STS2 sensors. Not surprisingly, the only two sensors in which a signal is visible in their Fig. 2, FUK and SBR, are the STS1 sensors.
It is therefore obvious that the K19 processing lowers the PEGS detection potential, but it is much less clear why they used such an observational strategy. K19 justify their processing strategy as a way to avoid the non-cau-sality of the instrument response deconvolution. Such a non-causality effect indeed exists, but is a problem only if the deconvolution is applied to a time series contain-ing an undesirable subsequent signal. That is why it is crucial to cut the signals at the P-wave arrival, as done in the V17 procedure, to avoid any contamination. Once this operation is done, it is difficult to imagine how a sig-nal removed from the asig-nalysis (i.e., the P direct wave) could still have an adverse role. As K19 possibly worried about an influence of the limits of the original time win-dows, we show in Fig. 2 that their arbitrary choice does not have any role on the obtained accelerations: As long as a sufficiently long pre-origin time signal is used and the P-wave is not included, the V17 procedure gives the same acceleration signals in the 0.002–0.03 Hz frequency
range regardless of the choice of time window. We also recall that V17 provided in their Supplementary Mate-rial (Additional data) their exact data processing proce-dure (using Seismic Analysis Code—SAC), so that every reader can assess its robustness.
The V17 procedure is not affected by spurious effects and restores the signal with higher fidelity than the K19 procedure. Thus any claim of non-detection using the K19 procedure is highly dubious, especially if the signals are readily apparent with the V17 approach. For instance, at station NE93, K19 consider the signal (see their Fig. 3b) as noise, whereas V17 observe a signal with ampli-tude ~ − 1 nm/s2. NE93 is equipped with a CMG3T
sen-sor, a broadband sensor with a response similar to that of an STS2, thus the K19 procedure eliminates a large part of the PEGS recorded at this station.
Mixing high‑quality with low‑quality sensors
PEGS are not equally well recorded by all sensors, because of their intrinsic characteristics combined with differences in site quality. However, K19 used in their Figs. 2 and 3 all the existing broadband sensors in a given area, regardless of their quality, as an argument to dis-card the direct PEGS observations. They made the same error when they directly compared the signals recorded by the Matsushiro gravimeter and by the collocated MAJO seismometer, without acknowledging that the pre-event seismic noise at MAJO is much lower (see V17). Their Figure 3a, b is also particularly misleading because signals are not shown with the same vertical scale. Finally, in Fig. 3a of K19, despite the deficient data processing, a signal is still visible at the excellent STS1 sensor of station MDJ. K19 reject this evidence by judging it is inconsist-ent with data at neighboring stations. However, the dif-ference is simply explained by the much lower noise at MDJ.
In contrast, the V17 study considered all the signals that satisfy an objective quality control criterion: their amplitude in the 1800 s preceding the earthquake had to be below a given amplitude threshold. This threshold was set at ± 0.8 nm/s2 so that a signal with an amplitude
of − 1 nm/s2 occurring just before the P arrival time is
unlikely to be random noise. All the sensors shown in Fig. 3 of K19, except for the NE93 and MDJ sensors used by V17, have pre-event noise amplitude levels of more than ± 2 nm/s2, and often much more. Such noisy data
were not shown in the V17 study, and they are of little use to invalidate PEGS observations.
At this stage, it is interesting to mention a specific point about the MDJ station. If K19 had used the V17 data processing, they would have obtained the clear MDJ sig-nals that can be seen in Figs. 1, 2, and 3 of V17. When quantified by the signal-to-noise ratio (SNR) criterion
²
²
Fig. 2 Robustness of the V17 data processing illustrated for two
stations of the F‑net network. FUK (top) and INN (bottom) are STS1 and STS2 sensors, respectively. For each sensor, the curves show the obtained vertical acceleration signals for different choices of the original time window. These choices can be read in the name given to each curve: the negative number following “OT” gives the starting time (in s) of the window relative to the Tohoku earthquake origin time; the negative number following “TP” gives the ending time (in s) of the window relative to the P‑wave arrival time at each station. No differences can be observed in the resulting accelerations in the 0.002–0.03 Hz frequency band
Page 4 of 6 Vallée et al. Earth, Planets and Space (2019) 71:51
that K19 used to evaluate the stack significance (i.e., the ratio between the amplitude at the P arrival time and the standard deviation σ of the seismic noise), the SNR reaches ~ 9 at station MDJ. When properly processed, this unique sensor has a better SNR than the stack of 27 stations considered by K19, whose SNR is only 7. The V17 study did not require any stacking because it was based on signals that could be directly observed at sev-eral stations (and confirmed by signal modeling).
Objective comparisons confirm V17 observations
Based on the aforementioned considerations, Figs. 2 and 3 of K19 do not bring any valid argument to question the observations made by V17. On the contrary, the sensors in Southwest Japan used in Fig. 2 of K19 confirm the V17 observations. Some of these sensors, in addition to FUK also used in V17, indeed meet the pre-event noise quality criterion required by V17. This is expected because V17 explicitly mentioned that, to avoid redundant signals at similar locations, not all the high-quality F-net sensors were used in their analysis.
In practice, after application of the V17 data processing, four stations (FUK, SBR, IZH, and INN) have pre-event
noise whose absolute values remain below 0.8 nm/s2, and
therefore offer an unbiased opportunity to validate the FUK observations shown in V17. Not surprisingly, these four signals, shown in Fig. 3, strongly support the FUK observations: They all exhibit a clear downward trend after the earthquake origin time (with an optimal SNR at the STS1 sensors FUK and SBR), with consistent ampli-tudes reaching values of ~ − 1 nm/s2 at the P arrival time.
Erroneous conclusions about signal amplitudes The K19 study does not provide any valid modeling of the expected PEGS amplitudes. Although, based on the works of Heaton (2017) and V17, K19 correctly described that PEGS originate from two effects, a direct gravity per-turbation and an induced ground acceleration, they only modeled the first effect. In their Fig. 1, K19 only show the direct gravity term, in the very crude approximation of an infinite space. The values shown in their Fig. 1 differ by a factor of ~ 100 compared to the amplitudes of their stack (their Fig. 7a), but K19 did not comment on why it is so.
Despite being unable to model their own observations, K19 try to discard the modeling made by V17. While K19 correctly noted that the signals simulated by V17 were
²
Fig. 3 Objective comparison between PEGS signals observed in Southwest Japan. All signals have been processed using the V17 procedure and
the FUK signal (top row) is therefore exactly the same as the one shown in Figs. 1 and 3 of V17. The other three signals are the only other ones among the stations shown in Fig. 2 of K19 that meet the quality criterion of V17. All signals show consistent PEGS, supporting the use of only one of them (FUK) in the V17 study. Due to its correct data processing and appropriate noise considerations, this figure is the logical alternative to Fig. 2b of K19
on the order of − 1 nm/s2, they compared these
ampli-tudes obtained in the 0.002–0.03 Hz frequency band with their observed stack amplitude (− 0.25 nm/s2), which
suf-fers from strong deficit in this frequency band (Fig. 1 and previous sections). K19 therefore appear unaware that meaningful comparisons between two signals can only be done if they have been processed in the same way.
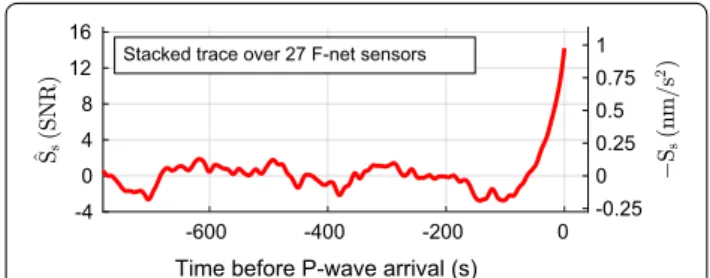
Observations and theory are fortunately in much bet-ter agreement when comparisons are properly made in the same frequency band. In Fig. 4, we show the stacked trace of the same 27 stations used by K19, but apply-ing the instrument response correction used by V17. The observed stack amplitude confirms that the PEGS in Southwest Japan in the 0.002–0.03 Hz frequency band reach an amplitude of the order of − 1 nm/s2 at
the P-wave arrival time, consistently with the V17 mod-eling. Moreover, the SNR of the stack reaches a value of 14 with the V17 processing, whereas K19 obtained a smaller value of 7 with their processing. Thus, the appro-priate data processing strongly increases the significance of the stack. In more challenging observation configura-tions than the Tohoku earthquake case, this difference is clearly key for PEGS detection.
Contrary to the opinion expressed by K19, there is no urgent need to improve the V17 modeling approach and to develop a “better theoretical model […] that addresses the fully coupled equations between the elas-tic deformation and gravity”. The adequacy of the V17 and Juhel et al. (2019) approaches is not only supported by their agreement with the observations, but V17 showed that the error made by neglecting the full cou-pling (i.e., by neglecting that gravity-induced motion itself creates a gravity perturbation, and so on) is only a few percent. Additionally, Juhel et al. (2019) numerically modeled the direct gravity perturbation with and without
self-gravitation and found only minor differences in the 0.002–0.03 Hz frequency band of interest. Solving the fully coupled equations is therefore a numerical challenge that would offer a more elegant solution, but is not a pre-requisite to model the PEGS observations.
Conclusion
K19’s study illustrates the difficulties to observe a small-amplitude signal when using non-optimal data process-ing or non-optimal sensors. This trivial findprocess-ing does not provide any valid argument to challenge previous obser-vations made by V17 using a better processing applied to objectively selected data. K19’s claims to discard previ-ous PEGS modeling is based on an obviprevi-ously biased use of their observations. In light of these two major errors, their claims of pioneering findings are invalid.
The K19 study provides only a modest contribution to the recent PEGS observations made by other groups, in particular, by the V17 study. Recent progress in the research on PEGS has yielded new advances that go far beyond the K19 study. Readers interested in how PEGS can be optimally observed may refer to the more sophis-ticated stacking approaches described by Montagner et al. (2016) and Vallée and Juhel (2019). Vallée and Juhel (2019) also show how multiple PEGS observations made for earthquakes of different focal mechanisms and depths are accurately modeled by the methods described by V17 and Juhel et al. (2019). Therefore, the remaining challenges today are no longer to show that PEGS are well understood, modeled, and observed for magnitudes larger than 8, but to lower this magnitude threshold and to reduce the detection delay, in order to make PEGS even more valuable for early warning systems.
Abbreviations
FUK: Fukue; F‑net: full‑range seismograph network of Japan; INN: Nakatsu; IZH: Izuhara; K19: Kimura et al. (2019); MAJO: Matsushiro; MDJ: Mudanjiang; NE93: Zhalaiteqi Badaerhuzhen; PEGS: prompt elastogravity signals; SAC: Seismic Analysis Code; SNR: signal‑to‑noise ratio; SBR: Sefuri; V17: Vallée et al. (2017).
Authors’ contributions
MV designed this comment, with inputs from KJ and JPA. MV performed the data analysis, produced the associated figures and wrote the text with JPA. KJ, JPM, MB, and PB commented the initial versions of the manuscript. All authors read and approved the final manuscript.
Author details
1 Institut de Physique du Globe de Paris, Sorbonne Paris Cité, Université Paris Diderot, CNRS, Paris, France. 2 Université Côte d’Azur, IRD, CNRS, Observa‑ toire de la Côte d’Azur, Géoazur, Sophia Antipolis, France. 3 AstroParticule et Cosmologie, Université Paris Diderot, CNRS/IN2P3, Sorbonne Paris Cité, Paris, France.
-600 -400 -200 0
Time before P-wave arrival (s)
-4 0 4 8 12 16 -0.25 0 0.25 0.5 0.75 1
Stacked trace over 27 F-net sensors
Fig. 4 Consistency between observed PEGS amplitudes and V17
modeling. Stacked trace (station‑averaged vertical acceleration) of the same 27 sensors considered in Fig. 7a of K19, but deconvolving the data by the instrument response (as done in V17) before stacking. Note that the stacked trace Ss is shown with an opposite sign (scale to the right). The stack SNR (scale to the left) is defined as the ratio between |Ss| and the standard deviation of noise calculated in the 10 min preceding earthquake origin time. At the P wave arrival, Ss ~ − 1 nm/s2 and SNR ~ 14
Page 6 of 6 Vallée et al. Earth, Planets and Space (2019) 71:51
Acknowledgements
The SAC (http://ds.iris.edu/ds/nodes /dmc/softw are/downl oads/sac/) free software was used for data processing. Most numerical computations were performed on the S‑CAPAD platform, Paris, France.
Competing interests
The authors declare no competing interests.
Availability of data and materials
Data from the F‑net network are publicly available at the NIED F‑net server: http://www.fnet.bosai .go.jp. MAJO station belongs to the GSN network (https ://doi.org/10.7914/SN/IU), MDJ station to the NCDSN network (https ://doi.org/10.7914/SN/IC), and NE93 to the NECESS/UT network (https ://doi. org/10.7914/SN/YP_2009). Data from the GSN, NCDSN and NECESS/UT net‑ works are publicly available at the IRIS data management center (http://ds.iris. edu/ds/nodes /dmc/).
Consent for publication
Not applicable.
Ethics approval and consent to participate
Not applicable.
Funding
We acknowledge the financial support from the UnivEarthS Labex program at Sorbonne Paris Cité (ANR‑10‑LABX‑0023 and ANR‑11‑IDEX‑0005‑02) and from the Agence Nationale de la Recherche (Grant ANR‑14‑CE03‑0014‑01).
Publisher’s Note
Springer Nature remains neutral with regard to jurisdictional claims in pub‑ lished maps and institutional affiliations.
Received: 3 April 2019 Accepted: 20 April 2019
References
Harms J (2016) Transient gravity perturbations from a double‑couple in a homogeneous half‑space. Geophys J Int 205:1153–1164. https ://doi. org/10.1093/gji/ggw07 6
Harms J, Ampuero J‑P, Barsuglia M, Chassande‑Mottin E, Montagner J‑P, Somala SN, Whiting BF (2015) Transient gravity perturbations induced by earthquake rupture. Geophys J Int 201:1416–1425. https ://doi. org/10.1093/gji/ggv09 0
Heaton TH (2017) Correspondence: response of a gravimeter to an instantane‑ ous step in gravity. Nat Commun 8:966. https ://doi.org/10.1038/s4146 7‑01701 348‑z
Juhel K, Ampuero JP, Barsuglia M, Bernard P, Chassande‑Mottin E, Fiorucci D, Harms J, Montagner J‑P, Vallée M, Whiting BF (2018) Earthquake early warning using future generation gravity strainmeters. J Geophys Res 123:10889–10902. https ://doi.org/10.1029/2018j b0166 98
Juhel K, Montagner J‑P, Vallée M, Ampuero JP, Barsuglia M, Bernard P, Clévédé E, Harms J, Whiting BF (2019) Normal mode simulation of prompt elastogravity signals induced by an earthquake rupture. Geophys J Int 216:935–947. https ://doi.org/10.1093/gji/ggy43 6
Kimura M, Kame N, Watada S, Ohtani M, Araya A, Imanishi Y, Ando M, Kunugi T (2019) Earthquake‑induced prompt gravity signals identified in dense array data in Japan. Earth Planets Space 71:27. https ://doi.org/10.1186/ s4062 3‑019‑1006‑x
Montagner J‑P, Juhel K, Barsuglia M, Ampuero JP, Chassande‑Mottin E, Harms J, Whiting BF, Bernard P, Clévédé E, Lognonné P (2016) Prompt gravity sig‑ nal induced by the 2011 Tohoku‑Oki earthquake. Nat Commun 7:13349. https ://doi.org/10.1038/ncomm s1334 9
Vallée M, Juhel K (2019) Multiple observations of the prompt elastogravity signals heralding direct seismic waves. J Geophys Res 124:2970–2989. https ://doi.org/10.1029/2018j b0171 30
Vallée M, Ampuero JP, Juhel K, Bernard P, Montagner J‑P, Barsuglia M (2017) Observations and modeling of the elastogravity signals preceding direct seismic waves. Science 358:1164–1168. https ://doi.org/10.1126/scien ce.aao07 46