Publisher’s version / Version de l'éditeur:
Vous avez des questions? Nous pouvons vous aider. Pour communiquer directement avec un auteur, consultez la
première page de la revue dans laquelle son article a été publié afin de trouver ses coordonnées. Si vous n’arrivez pas à les repérer, communiquez avec nous à [email protected].
Questions? Contact the NRC Publications Archive team at
[email protected]. If you wish to email the authors directly, please see the first page of the publication for their contact information.
https://publications-cnrc.canada.ca/fra/droits
L’accès à ce site Web et l’utilisation de son contenu sont assujettis aux conditions présentées dans le site LISEZ CES CONDITIONS ATTENTIVEMENT AVANT D’UTILISER CE SITE WEB.
The Genetic and Evolutionary Computation Conference (GECCO-2007), 2007
READ THESE TERMS AND CONDITIONS CAREFULLY BEFORE USING THIS WEBSITE.
https://nrc-publications.canada.ca/eng/copyright
NRC Publications Archive Record / Notice des Archives des publications du CNRC :
https://nrc-publications.canada.ca/eng/view/object/?id=256ae103-7637-4986-b94c-ab3d1c53314d
https://publications-cnrc.canada.ca/fra/voir/objet/?id=256ae103-7637-4986-b94c-ab3d1c53314d
NRC Publications Archive
Archives des publications du CNRC
This publication could be one of several versions: author’s original, accepted manuscript or the publisher’s version. / La version de cette publication peut être l’une des suivantes : la version prépublication de l’auteur, la version acceptée du manuscrit ou la version de l’éditeur.
Access and use of this website and the material on it are subject to the Terms and Conditions set forth at
Exploring medical data using visual spaces with genetic programming
and implicit functional mappings
Exploring Medical Data using Visual Spaces
with Genetic Programming and Implicit
Functional Mappings *
Valdés, J., Orchard, R., and Barton, A.
July 7-11, 2007
* proceedings of GECCO Late-Breaking Paper. GECCO 2007
Conference. London, England. July 7-11, 2007. NRC 49294.
Copyright 2007 by
National Research Council of Canada
Permission is granted to quote short excerpts and to reproduce figures and tables from this report, provided that the source of such material is fully acknowledged.
Exploring Medical Data using Visual Spaces with Genetic
Programming and Implicit Functional Mappings
Julio J. Valdes
julio.valdes@
nrc-cnrc.gc.ca
Robert Orchard
robert.orchard@
nrc-cnrc.gc.ca
Alan J. Barton
alan.barton@
nrc-cnrc.gc.ca
National Research Council Canada Institute for Information Technology
M50, 1200 Montreal Rd. Ottawa, ON K1A 0R6
ABSTRACT
Two medical data sets (Breast cancer and Colon cancer) are investigated within a visual data mining paradigm through the unsupervised construction of virtual reality spaces using genetic programming and classical optimization (for com-parison purposes). The desired visual spaces are such that a modified genetic programming approach was proposed in order to generate programs representing vector functions. The extension leads to populations that are composed of forests, instead of single expression trees. No particular kind of genetic programming algorithm is required due to the generic nature of the approach taken in the paper. The results (visual spaces) show that the relationships between the data objects and their classes can be appreciated in all of the obtained spaces regardless of the mapping error. In addition, the spaces obtained with genetic programming re-sulted in lower mapping errors than a classical optimizer and produced relatively simple equations. Further, the set of obtained equations can be statistically analyzed in terms of the original attributes in order to further the understand-ing of the derivation of the new nonlinear features that are constructed. Thus, explicit mappings provided by genetic programming can be used for feature selection and gener-ation in data mining where scalar and/or vector functions are involved.
Categories and Subject Descriptors
I.5 [Computing Methodologies]: Pattern Recognition; E.0 [Data]: General; I.1 [Computing Methodologies]: Symbolic and Algebraic Manipulation; J.3 [Computer Ap-plications]: Life and Medical Sciences
General Terms
AlgorithmsCopyright 2007 Crown in Right of Canada.
This article was authored by employees of the National Research Council of Canada. As such, the Canadian Government retains all interest in the copyright to this work and grants to ACM a nonexclusive, royalty-free right to publish or reproduce this article, or to allow others to do so, provided that clear attribution is given both to the NRC and the authors.
GECCO’07,July 7–11, 2007, London, England, United Kingdom. ACM 978-1-59593-697-4/07/0007.
Keywords
vector functions, virtual reality, genetic programming, breast cancer, colon cancer
1.
INTRODUCTION
Proper exploration and understanding of medical data re-quires significant domain knowledge. To begin such an in-vestigation, many approaches may be considered possible avenues for research. This paper takes a visual approach due to the increasing complexity of data analysis procedures that inhibit the user from extracting useful information out of results generated by the various techniques.
This paper explores an extension of genetic programming to vector valued functions; that is, from single expressions to forests of expression trees. The extension is not con-strained to a particular form of genetic programming but is a generic approach that is used for constructing explicit an-alytic mappings for visualization and exploration purposes. This occurs within a visual data mining paradigm using vir-tual reality that enables the decision maker to not only vi-sualize, but also navigate and interact with the presented information. A comparison of the evolutionary technique to classical optimization is also presented and applied to med-ical data for both Breast and Colon cancer.
2.
SPACE VISUALIZATION
There are many possible paradigms for creating visual spaces within data mining. In particular Virtual Reality (VR) is a suitable paradigm for several reasons. It is flex-ible: allows the choice of different ways to represent the objects according to the differences in human perception. VR allows immersion: the user can navigate inside the data and interact with the objects in the world. It creates a living experience: the user is not a passive observer, but an actor in the world. VR is broad and deep: the user may see the VR world as a whole, or concentrate on details. Also very impor-tant is that its use does not require any special background knowledge. A virtual reality technique for visual data min-ing on heterogeneous, imprecise and incomplete information systems was introduced in [14, 15].
One of the steps in the construction of a VR space for data representation is the transformation of the original set of attributes describing the objects under study, often defin-ing a heterogeneous high dimensional space, into another space of small dimension (typically 2-3) with an intuitive
metric (e.g. Euclidean). The operation usually involves a non-linear transformation; implying some information loss. There are basically two kinds of spaces sought: i) spaces preserving the structure of the objects as determined by the original set of attributes, and ii) spaces preserving the dis-tribution of an existing class defined over the set of objects.
2.1
Space Taxonomy
From the point of view of the property(s) which the ob-jects in the space must satisfy, several paradigms can be considered for building a transformed space for construct-ing visual representations [16]:
• Unsupervised : The location of the objects in the space should preserve some structural property of the data, dependent only on the set of descriptor attributes. • Supervised : The goal is to produce a space where the
objects are maximally discriminated w.r.t. a class dis-tribution. The space is distorted in order to maximize class discrimination.
• Mixed : A space compromising the two goals is sought. Very often these two goals are conflicting.
For the purposes of this study, unsupervised spaces are constructed because data structure is one of the most im-portant elements to consider when the location and adja-cency relationships between the objects should give an in-dication of the similarity relationships [3, 2] between the objects as given by the set of original attributes [15]. Let Hn be the space defined by the original n-attributes (not necessarily numeric) and Rm a m-dimensional space given
by a Cartesian product of the reals s.t. m < n. A mapping ϕ : Hn →
Rm creates images of the objects in Hn
in Rm.
The mappings of interest are those which maximize some metric or non-metric structure preservation criteria as has been done for decades in multidimensional scaling [10, 2], or to minimize some error measure of information loss [13]. If δij is a dissimilarity measure between any two objects i, j
(i, j ∈ Hn), and ζ
ivjv is another dissimilarity measure
de-fined on objects iv, jv∈
Rm(iv= ϕ(i), jv= ϕ(j)), examples
of error measures frequently used are:
S stress = s P i<j(δ 2 ij−ζ 2 ij) 2 P i<jδ 4 ij , (1) Sammon error = P 1 i<jδij P i<j(δij−ζij) 2 δij (2) Quadratic Loss = X i<j (δij−ζij) 2 (3)
2.2
Mapping Taxonomy
From the point of view of their mathematical nature, the mappings can be:
• Implicit: the images of the transformed objects are computed directly and the algorithm does not provide a function representation.
• Explicit: the function performing the mapping is found by the procedure and the images of the objects are obtained by applying the function. Two sub-types are:
– analytical functions.
– general function approximators: neural networks, fuzzy systems, or others.
2.3
Mapping Computation
Explicit mappings can be constructed in the form of an-alytical functions (e.g. via genetic programming), or using general function approximators like neural networks or fuzzy systems. An explicit mapping (e.g. ϕ) is useful for both practical and theoretical reasons. On one hand, in dynamic data sets (e.g. systems being monitored or incremental data bases) an explicit transform ϕ will increase the update rate of the VR information system. On another hand, it can give semantics to the attributes of the VR space, thus acting as a general dimensionality reducer.
Classical algorithms have been used for directly optimiz-ing these measures, like Steepest descent, conjugate gradient Fletcher-Reeves, Powell, Levenberg-Marquardt, and others. The number of different similarity, dissimilarity and distance functions definable for the different kinds of source sets is immense. Moreover, similarities and distances can be trans-formed into dissimilarities according to a wide variety of schemes, thus providing a rich framework.
For this study, the Fletcher-Reeves method, which is a well known technique used in deterministic optimization [12] was used. It assumes that the function f is roughly ap-proximated as a quadratic form in the neighborhood of an N dimensional point P and it uses the information given by the partial derivatives of the original function f . This is the conjugate gradient family of minimization methods and requires an initial approximation to the solution (typ-ically random), which is then refined in a sequence of iter-ative steps. The convergence of these methods is reliter-atively fast, but they suffer from the entrapment effect, by means of which the obtained solutions are locally optimal.
3.
MAPPING COMPUTATION USING
GENETIC PROGRAMMING
Genetic programming techniques aim at evolving com-puter programs, which ultimately are functions. Genetic Programming is an extension of the Genetic Algorithm in-troduced in [6] and further elaborated in [7], [8] and [9]. The algorithm starts with a set of randomly created computer programs. This initial population goes through a domain-independent breeding process over a series of generations. It employs the Darwinian principle of survival of the fittest with operations similar to those occurring naturally, like sex-ual recombination of entities (crossover), occasional muta-tion, duplication and gene deletion. A computer program is understood as an entity that receives inputs, performs computations which transform these inputs and produces some output in a finite amount of time. The operations include arithmetic computation (possibly involving many other functions), conditionals, iterations, recursions, code reuse and other kinds of information processing organized into a hierarchy. It is considered that a system for auto-matically creating computer programs should create enti-ties covering the above mentioned features as much as pos-sible. Genetic programming combines the expressive high level symbolic representations of computer programs with the near-optimal search efficiency of the genetic algorithm. For a given problem, this process often results in a computer
program which solves it exactly, or if not, at least provides a fairly good approximation. Those programs which represent functions are of particular interest and can be modeled as y = F (x1, · · · , xn), where (x1, · · · , xn) is the set of
indepen-dent or predictor variables, and y the depenindepen-dent or predicted variable, so that x1, · · · , xn, y ∈ R, where R are the reals.
The function F is built by assembling functional subtrees using a set of predefined primitive functions (the function set), defined beforehand. In general terms, the model de-scribing the program is given by y = F (~x), where y ∈ R and ~x ∈ Rn. Most implementations of genetic programming for
modeling fall within this paradigm.
However, there are problems involving vector functions which require an extension of this paradigm. In these cases the model associated to the evolved programs must be ~y = F (~x). Note that these are not multi-objective problems, but problems where the fitness function depends on vector vari-ables. The mapping problem between vectors of two spaces of different dimension (n and m) is one of that kind. In this case a transformation like ϕ : Rn →
Rm mapping vectors ~x ∈ Rn to vectors ~y ∈ Rm would allow a reformulation of
Eq. 2 (and the others) as in Eq. 4:
Sammon error =P 1 i<jδij P i<j(δij−d(~yi, ~yj)) 2 δij , (4) where ~yi= ϕ(~xi), ~yj= ϕ(~xj).
The implication from the point of view of genetic program-ming is that instead of evolving expression trees, where there is a one-to-one correspondence between an expression tree and a fitness function evaluation (the classical case), the evolution has to consider populations of forests such that the evaluation of the fitness function depends on the set of trees within a forest. In these cases, the cardinality of any forest within the population is equal to the dimension of the target space m.
3.1
Gene Expression Programming
Gene Expression Programming (GEP) [4] is used to build mathematical models. The algorithm starts with a gener-ated population of individuals (i.e. the initial population) that each embody a mathematical model. The individuals in the population are evaluated to determine their fitness (how well they represent the data) and those with the most suitable fitness are chosen to move along to the next gener-ation, with various types of “genetic” operators applied to them. Over a number of generations the population evolves towards better models. In the GEP algorithm, the individu-als are encoded as simple strings of fixed length, referred to as chromosomes. Each chromosome can be composed of one or more genes which hold individual mathematical expres-sions that are linked together to form a larger expression.
To facilitate experimentation with the GEP algorithm, an extension to an existing Java-based Evolution Computing Research System called ECJ [1] from George Mason Univer-sity has been made. ECJ has an infrastructure to support various types of evolutionary computing, including Genetic Programming (GP). The extension, ECJ-GEP, implements almost all of the features of GEP allowing one to tackle four basic types of problem: function finding, classification, time series, and logical. It supports a large set of fitness functions and allows expressions to be created using many types of arithmetic functions in such a way that additions
are straightforward. The problem parameters that deter-mine which functions to use in expressions, how to perform the evolutionary operations, the size of the population, the number of generations to run, etc. are defined within pa-rameter files. The system has been designed so that for most problems no code should need to be written. However, for those other problems, code may be incorporated in order to address the special need (e.g. to generate data, do some-thing special with the fitness calculation, etc). There is a graphical interface that allows for the sequential execution of problems. Batch files may be constructed (outside of ECJ-GEP) for execution upon distributed systems (e.g. Condor: http://www.cs.wisc.edu/condor/) to allow for large scale experimentation.
For the particular research described in this paper, a new idea led to an extension of the GEP algorithm, whereby an individual in the population may have multiple chromo-somes. The chromosomes are independent but evolve to-gether from generation to generation. This supports the population of forests needed for such problems.
3.2
Distributed Computing Environment
Among distributed computing systems for delivering high throughput computing, the Condor system stands out. Condor is a specialized workload management system for compute-intensive jobs in a distributed computing environ-ment, developed by the Condor Research Project at the Uni-versity of Wisconsin-Madison (UW-Madison). Like other full-featured batch systems, Condor provides a job queue-ing mechanism, schedulqueue-ing policy, priority scheme, resource monitoring, and resource management. Users submit their serial or parallel jobs to Condor, Condor places them into a queue, chooses when and where to run the jobs based upon a policy, carefully monitors their progress, and ultimately informs the user upon completion.4.
EXPERIMENTAL SETTINGS
Two data sets (Breast Cancer and Colon Cancer) were used along with both a classical and a genetic programming technique for the construction of visual spaces. The ex-perimental settings associated with each such exex-perimental condition are detailed subsequently.
4.1
Breast Cancer Gene Expression Data
The University of California, Irvine (UCI) maintains an international machine learning (ML) database reposi-tory (http://www.ics.uci.edu/~mlearn/), containing an archive of over 100 databases used specifically for evaluat-ing machine learnevaluat-ing algorithms. As such, a breast cancer database created by Dr. William H. Wolberg of the Uni-versity of Wisconsin Hospitals, Madison, Wisconsin, was obtained from the UCI ML Repository [11]. The database contains 699 objects, 9 integer-valued attributes and is com-posed of 2 classes (241 malignant and 458 benign). In addi-tion, 16 objects contain missing values, which, for the pur-poses of our study, were removed from consideration (leaving 683 objects).4.2
Colon Cancer Gene Expression Data
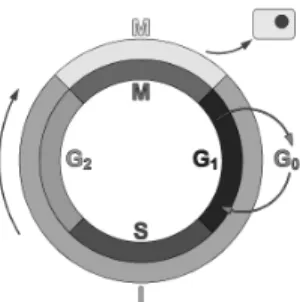
A previous study [17] analyzed a human colon cancer cell line (called EcR-RKO/KLF4) that was treated for up to 24 hours with ponasterone A to induce expression of a full-length, transgenic Kr¨uppel-like factor 4 (KLF4). KLF4 is anFigure 1: Schematic of a cell cycle. Outer Ring: I=Interphase, M=Metaphase; Inner Rring: M=Mitosis. Mitosis duration in relation to the other phases has been exaggerated.
epithelially-enriched, zinc finger transcription factor. The study’s results provide insight into the biochemical function of KLF4. Fig. 1 shows a typical cell cycle [18], with it being known that KLF4 exhibits checkpoint function during the G1/S and G2/M transitions. This cell cycle [18] is the
se-ries of events in a eukaryotic cell between one cell division and the next. Thus, it is the process by which a single-cell fertilized egg develops into a mature organism and the process by which hair, skin, blood cells, and some internal organs are renewed. It consists of four distinct phases: G1 phase, S phase, G2 phase (collectively known as interphase) and M phase. M phase is itself composed of two tightly coupled processes: mitosis, in which the cell’s chromosomes are divided between the two daughter cells, and cytokinesis, in which the cell’s cytoplasm physically divides. Cells that have temporarily or reversibly stopped dividing are said to have entered a state of quiescence called G0 phase, while cells that have permanently stopped dividing due to age or accumulated DNA damage are said to be senescent. The molecular events that control the cell cycle are ordered and directional; that is, each process occurs in a sequential fash-ion and it is impossible to “reverse” the cycle. Data was ob-tained from http://www.ncbi.nlm.nih.gov/geo/gds/gds_ browse.cgi?gds=1942and consists of 44, 566 objects, 8 time points (0h, 1h, 2h, 4h, 6h, 8h, 12h, 24h) (only the last 7 used) and 2 classes (22, 283 control and 22, 283 induced). After application of the classical leader algorithm [5] the class distribution was (224 control and 335 induced for a total of 559 objects).
4.3
Implicit Classical Algorithm Settings
The Fletcher-Reeves-Polak-Ribiere (FRPR) method (a slight modification of this method, believed to improve the original), is the one used here as a standard for comparison. When Eq. 4 is solved for the ~yk ∈ Rm, k ∈ [1, N ], whereN is the number of objects, with this method (or a similar one), the obtained mapping is implicit. In order to reduce the chance of entrapment in local minima, 100 runs of the algorithm were made, that were started with the correspond-ing number of random initial approximations (in this case random 3D matrices). This procedure was applied to each investigated data set. The solutions were used for construct-ing the correspondconstruct-ing virtual reality spaces with which those obtained with vectorial genetic programming are compared.
4.4
Explicit GEP Algorithm Settings
Table 1: Example of a mathematical expression and its respective encoding.
Mathematical expression: b*(c-d) Karva Encoding of Expression: *b-cd/bdaac
The major experimental settings that were used for the ECJ-GEP experiments are listed in Table 2. It can be seen that the mathematical expressions composed for each of the chromosomes in an idividual will be made from 5 gene ex-pressions, each linked by the addition operator. The gene expressions can be formed using constants, the independent variables associated with each problem, and any of the func-tions listed. The weightings for the funcfunc-tions allow us to give a preference to some operators over others. In this case we decided to favour addition, subtraction and multiplication. The number of characters (constants, functions, variables) in each gene is determined by the gene’s head size and the maximum arity of any function being used and consequently is calculated according to Eq.5:
headSize + headSize ∗ (maximumArity − 1) + 1 (5) In this study a head size of 5 and a maximum arity of 2 were used leading to genes that have 11 characters that en-code expressions in a special notation called Karva [4]. Each gene also stores 4 constants randomly chosen between 1 and 10 that can be used in the formation of Karva expressions. A Karva expression with 11 characters and the expression it encodes is shown in Table 1; depending on the expression being encoded, not all characters are part of the expression. The great advantage of the encoding scheme is that it is compact and any combination of the allowed characters will always represent a valid mathematical expression.
The parameters related to evolution determine how the genes (Karva expressions) are transformed from generation to generation. It is beyond the scope of this paper to dis-cuss this in detail but as an example, the mutation rate determines the number of characters that will be mutated (replaced by another character) in the population. If we have 100 individuals in the population and each individual has 1 chromosome with a single gene of size 11 characters, then we would randomly select 100*11*0.044 or 48 charac-ters to mutate. Note that it may be that the character is in a region of the gene that is not part of the expression encoded by the gene and the effect will be no change to the expression. The parameters rnc-mutation rate, dc-mutation rate and dc-inversion rate control how the 4 constants asso-ciated with each gene evolve from generation to generation while the others are related to evolution of the genes.
For each of the three experiments a set of 75 runs was performed with random seeds and varying values for the number of generations and population size.
5.
RESULTS
The mapping errors (Eq. 4) for the best models found for all data sets are shown in Table. 3. For the Breast cancer data, the FRPR method outperformed GP-GEP by a factor of 2.6, but for Colon cancer data, GP-GEP outperformed FRPR by a factor of 10.
Table 2: Experimental Settings used for the investi-gation of the Breast and Colon Cancer data.
GEP Parameter Experimental Values No. Generations 100, 500 and 1000 Population Size 100, 200 and 500 No. Chromosomes / Individual 3
No. Genes / Chromosome 5 Gene Head Size 5 Linking function Addition No. Constants / Gene 4 Bounded Range of Constants [1, 10] Inversion Rate 0.1 Mutation Rate 0.044 is-transposition Rate 0.1 ris-transposition Rate 0.1 One-point Recomb. Rate 0.3 Two-point Recomb. Rate 0.3 Gene Recombination Rate 0.1 Gene Transposition Rate 0.1 rnc-mutation Rate 0.01 dc-mutation Rate 0.044 dc-inversion Rate 0.1
Breast Cancer Data
5 Functions(weight) add(2), sub(2), mult(2), div(1), pow(1)
Breast and Colon Cancer Data
8 Functions(weight) add(2), sub(2), mult(2), div(1), pow(1), exp(1), sin(1), cos(1)
Table 3: Sammon errors for the different datasets and methods.
Dataset Method Sammon Error GP-GEP (5 functions) 0.026616 Breast Cancer GP-GEP (8 functions) 0.027823
FRPR 0.009945
Colon Cancer GP-GEP (8 functions) 0.002874
FRPR 0.024015
It is impossible to represent a VR space on hard media. Snapshots of the visual spaces computed over the Breast Cancer data set using GP-GEP (Fig. 4(b), Fig. 5(a)) and FRPR (Fig. 5(b)) show the similarity structure and the orig-inal classes (benign and malignant tumors). In addition, the classes are wrapped with transparent membranes as an aid and Fig. 4(a) may be compared to Fig. 4(b) to appreciate the enhancement. Both algorithms, GP-GEP and FRPR, succeeded in showing the benign class (light objects) more densely packed and homogeneous than the malignant class. In addition, it can be observed that both classes have an important intersection making it difficult to expect perfect classification of this data with machine learning techniques. The same class structure is exhibited by the FRPR space (Fig. 5(b)) despite its lower mapping error.
The analytical expression for the vector function ϕ (Eq. 6) shows that slight nonlinear combinations of the original vari-ables may achieve a good level of dimensionality reduction. However, increasing the function set with more nonlinear
functions, led to more complex equations (Eq. 7) without improving the error. Not all of the variables appear in the best model equations, suggesting that this technique may help in identifying irrelevant variables.
The best Breast cancer data experiment (No. 4) using 5 functions yielded the vector function mapping (ϕ) of Eq.6:
ϕX = v2 + v6 + v3 + ((v3/v2) − v3) + ((v6 − (v9 + v6))/v5) ϕY = (v7/((v1 + v4) + ky1)) + ((v7 ∗ v3)/(v3 + v3)) + (v4 − v7) + (v7/((v2 + v3) ∗ pow(v6, v4))) + v7 ϕZ= v5 + (v6/(kz1/v9)) + ((v6 + v6)/(v5 + v9)) + (v8 − v5) + (v1 − v6) (6) where ky1= 3.7319260767682723, and kz1= 9.948321752508829.
The best Breast cancer data experiment (No. 28) using 8 functions yielded the vector function mapping (ϕ) of Eq.7:
ϕX= v3 + sin(exp(v6)) + (((v5/v5) + v9)/v8) + cos((sin(v7)/pow(v8, kx1))) + v6 ϕY = ky1+ cos(cos((ky2∗cos(v5)))) + v7 + ky3 + (v4 + (v5/v6)) ϕZ= sin(v4) + v1 + kz1+ v8 + sin((sin(v2)/v9)) (7) where kx1 =8.532346535090838, ky1 =exp(1.4970654475170435), ky2=9.392340674168233, ky3=cos(7.062490411699605), kz1=4.786257036832491.
5.2
Colon Cancer Results
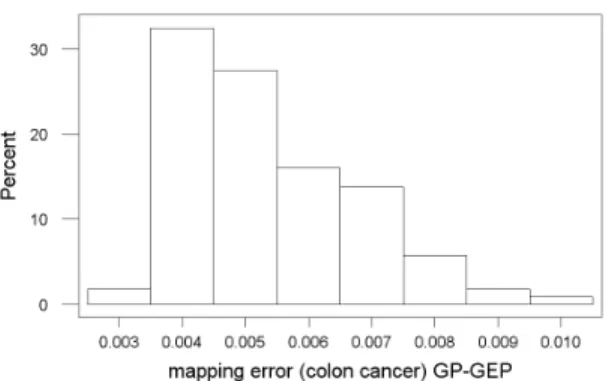
In this case, the best GP-GEP error solution is one order of magnitude better than the one obtained with the FRPR method. In addition, the distribution of GP-GEP errors (when 5 functions were used) is positively skewed (Fig. 2) indicating the tendency of the algorithm to produce low er-ror solutions. But the distribution for FRPR (Fig. 3) is negatively skewed, which is a non-desirable behavior.
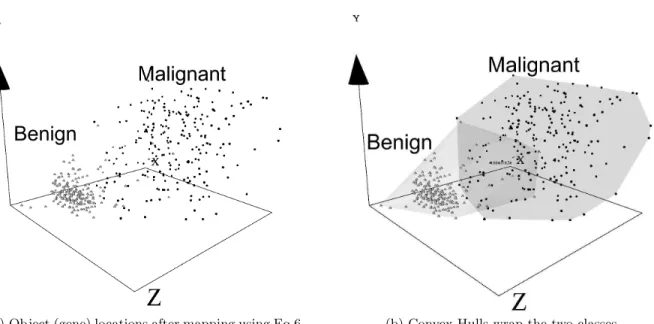
The VR spaces for GP-GEP are shown in Fig. 6(a) and Fig. 6(b) while those for FRPR are shown in Fig. 7(a) and Fig. 7(b). The difference in behavior between the control and the induced classes is clear. The latter is linear (in the non-linear space), whereas the control is not. In addition, the control class is much larger and scattered. The larger error of the FRPR space is visually associated with the scat-tering of the data at one extreme (Fig. 7(a), Fig. 7(b)) and with a general bending of the space (particularly affecting the induced class). The mapping function for the GP-GEP algorithm (Eq. 8) exhibits a more evident nonlinear charac-ter that disregards some of the original attributes.
The best Colon cancer data experiment (No. 94) using 8 functions yielded the vector function mapping (ϕ) of Eq.8:
ϕX = (v6 − ((v2 − v5)/kx1)) + v4 + exp(cos(v1)) + cos(v3) ϕY = ((v5 + v3)/(ky1−v7)) + v1 + cos(v1) + (v2/ky2) + (v2/v1) ϕZ= cos(v5) + kz1+ sin((cos(v7) ∗ (v7 ∗ kz2))) + ((v3 − v6)/kz3) + v3 (8) where kx1=3.651359087092545, ky1=3.2137460764913106,
Figure 2: Error Histogram - Colon Cancer 8 func-tions - GP-GEP
Figure 3: Error Histogram - Colon Cancer 8 func-tions - FRPR
ky2=1.9151269649790634 , kz1=1.2251144232153708,
kz2=6.183231644681386, kz3=6.860155877701824.
6.
CONCLUSIONS
This paper presented a method for computing virtual real-ity spaces for visual data mining based on genetic program-ming, oriented to the generation of programs representing vector functions. Populations composed of forests, instead of single expression trees, are evolved in an generic approach; that is, not associated with a particular kind of genetic pro-gramming algorithm. Virtual reality spaces for representing two medical data sets are constructed and compared with similar ones computed using classical optimization methods. The mapping errors obtained with the genetic programming generated vector functions were similar or much better than their counterparts obtained with classical techniques. The spaces correspond to unsupervised mappings. Nevertheless, the relationships between the data objects and their classes (shown within the paper for comparison) can be appreci-ated in all of the spaces computed regardless of the map-ping error. An additional advantage of the GP approach is the possibility of explicitly examining the role of the data attributes by examining the corresponding vector equations responsible for the mappings. This can be seen as a GP con-tribution to feature selection and generation in data mining. These results are preliminary but also promising.
7.
REFERENCES
[1] Ecj, a java-based evolution computing research system. Accessed online:
http://www.cs.gmu.edu/~eclab/projects/ecj/, March 2007.
[2] I. Borg and J. Lingoes. Multidimensional similarity structure analysis. Springer-Verlag, 1987.
[3] J. L. Chandon and S. Pinson. Analyse typologique. Th´eorie et applications. Masson, Paris, 1981. [4] C. Ferreira. Gene Expression Programming:
Mathematical Modeling by an Artificial Intelligence. Number ISBN-13 978-3-540-327967. Springer, 2006. [5] J. A. Hartigan. Clustering Algorithms. John Wiley &
Sons, Inc., New York, 1975.
[6] J. Koza. Hierarchical genetic algorithms operating on populations of computer programs. In Proceedings of the 11-th International Joint Conference on Artificial Intelligence, volume 1, pages 768–774, 1989.
[7] J. Koza. Genetic Programming: On the Programming of Computers by Means of natural Selection. MIT Press, 1992.
[8] J. Koza. Genetic Programming II: Automatic Discovery of Reusable Programs. MIT Press, 1994. [9] J. Koza, F. B. III, D.Andre, and M. Keane. Genetic
Programming III: Darwinian Invention and Problem Solving. Morgan Kaufmann, 1999.
[10] J. Kruskal. Multidimensional scaling by optimizing goodness of fit to a nonmetric hypothesis.
Psichometrika, 29:1–27, 1964.
[11] O. L. Mangasarian and W. H. Wolberg. Cancer diagnosis via linear programming. SIAM News, 23(5):1–18, September 1990.
[12] W. Pres, B. Flannery, S. Teukolsky, and
W. Vetterling. Numeric Recipes in C. Cambridge University Press, 1992.
[13] J. W. Sammon. A non-linear mapping for data structure analysis. IEEE Trans. Computers, C18:401–408, 1969.
[14] J. J. Vald´es. Virtual reality representation of relational systems and decision rules:. In P. Hajek, editor, Theory and Application of Relational Structures as Knowledge Instruments, Prague, Nov 2002. Meeting of the COST Action 274.
[15] J. J. Vald´es. Virtual reality representation of information systems and decision rules:. In Lecture Notes in Artificial Intelligence, volume 2639 of LNAI, pages 615–618. Springer-Verlag, 2003.
[16] J. J. Vald´es and A. J. Barton. Virtual reality spaces for visual data mining with multiobjective
evolutionary optimization: Implicit and explicit function representations mixing unsupervised and supervised properties. In IEEE Congress of Evolutionary Computation (CEC 2006), pages 5592–5598, Vancouver, July 16-21 2006. IEEE. [17] E. M. Whitney, A. M. Ghaleb, X. Chen, and V. W.
Yang. Transcriptional Profiling of the Cell Cycle Checkpoint Gene Kr¨uppel-Like Factor 4 Reveals a Global Inhibitory Function in Macromolecular Biosynthesis. Gene expression, 13(2):85–96, 2006. [18] Wikipedia. Cell cycle — wikipedia, the free
(a) Object (gene) locations after mapping using Eq.6. (b) Convex Hulls wrap the two classes.
Figure 4: Breast Cancer Data (GP-GEP with 5 functions). Light objects: benign. Dark objects: malignant.
(a) Object (gene) locations after mapping using Eq.7. Convex Hulls wrap the two classes.
(b) Object (gene) locations after implicit mapping. Convex Hulls wrap the two classes.
Figure 5: Breast Cancer Data Left: GP-GEP with 8 functions. Right: FRPR. Light objects: benign. Dark objects: malignant.
(a) Object (gene) locations after mapping using Eq.8. (b) Convex Hulls wrap the two classes.
Figure 6: Colon Cancer Data (GP-GEP with 8 functions). Light objects: control. Dark objects: induced.
(a) Object (gene) locations after implicit mapping. (b) Convex Hulls wrap the two classes. Figure 7: Colon Cancer Data (FRPR). Light objects: control. Dark objects: induced.