Publisher’s version / Version de l'éditeur:
Vous avez des questions? Nous pouvons vous aider. Pour communiquer directement avec un auteur, consultez la
première page de la revue dans laquelle son article a été publié afin de trouver ses coordonnées. Si vous n’arrivez pas à les repérer, communiquez avec nous à PublicationsArchive-ArchivesPublications@nrc-cnrc.gc.ca.
Questions? Contact the NRC Publications Archive team at
PublicationsArchive-ArchivesPublications@nrc-cnrc.gc.ca. If you wish to email the authors directly, please see the first page of the publication for their contact information.
https://publications-cnrc.canada.ca/fra/droits
L’accès à ce site Web et l’utilisation de son contenu sont assujettis aux conditions présentées dans le site LISEZ CES CONDITIONS ATTENTIVEMENT AVANT D’UTILISER CE SITE WEB.
Combustion Institute Canadian Section, 2005 Spring Technical Meeting [Proceedings], pp. 1-6, 2005
READ THESE TERMS AND CONDITIONS CAREFULLY BEFORE USING THIS WEBSITE. https://nrc-publications.canada.ca/eng/copyright
NRC Publications Archive Record / Notice des Archives des publications du CNRC :
https://nrc-publications.canada.ca/eng/view/object/?id=3bd6bcd7-304d-43f8-b8cf-5bb0376fdd89 https://publications-cnrc.canada.ca/fra/voir/objet/?id=3bd6bcd7-304d-43f8-b8cf-5bb0376fdd89
NRC Publications Archive
Archives des publications du CNRC
This publication could be one of several versions: author’s original, accepted manuscript or the publisher’s version. / La version de cette publication peut être l’une des suivantes : la version prépublication de l’auteur, la version acceptée du manuscrit ou la version de l’éditeur.
Access and use of this website and the material on it are subject to the Terms and Conditions set forth at Relative optical density analysis on TEM images for morphology determination of flame generated soot
Tian, Kuo; Thomson, Kevin; Liu, Fengshan; Yang, M.; Snelling, David; Smallwood, Gregory; Wang, D.
RELATIVE OPTICAL DENSITY ANALYSIS ON TEM
IMAGES FOR MORPHOLOGY DETERMINATION OF
FLAME GENERATED SOOT
K. TIAN1, K. A. THOMSON, F. LIU, M. YANG, D. R. SNELLING, G. J. SMALLWOOD, and D. WANG
Institute for Chemical Process and Environment Technology National Research Council Canada
Building M-9, 1200 Montreal Road, Ottawa, Ontario K1A 0R6, Canada
INTRODUCTION
Research on morphology of soot aggregates generated in hydrocarbon/air combustion systems is of great importance to understand the processes of soot formation, growth, and oxidation. Compared with non-intrusive soot diagnostic methods, such as LII (laser-induced incandescence) [1, 2] and LS/E (laser scattering and extinction) [3, 4], the commonly used intrusive method, i.e. the thermophoretic sampling (TS) technique aided by scanning electron microscopy (SEM) or transmission electron microscopy (TEM) imaging and analysis, is considered to be a reliable visual method for determining the soot morphology. In this method, soot particles in a flame deposit on a probe through thermophoresis driven by temperature gradients between the probe and the flame during the probe’s exposure in the flame. Subsequently, soot aggregates sampled on the probe are imaged with TEM or SEM techniques. Soot morphology parameters are derived based on statistical analysis of a large population of soot aggregates from TEM or SEM images. A typical TEM image is shown in Fig.1.
The distribution of the number of primary particles per aggregate, N, is important in describing the morphology of soot aggregates, and can be derived from the statistics of a large population of
soot aggregates. Key parameters, such as Ng (the geometric mean of N), σ2g (the geometric
standard deviation of N), Df (the fractal dimension), kf (the fractal prefactor), and others can be
obtained from this distribution.
However, the accurate estimation on N for each individual aggregate currently relies on an
empirical equation based on the projected area of the aggregate, Ai in the TEM or SEM images:
(
α p i a i k A A N = /)
, (1)where Ni is the number of primary particles in the aggregate, Ai the projected area of the
aggregate, the projected area of a single primary particle with the mean primary
particle diameter, , k 4 / 2 p p d A =π⋅ p
d a the projected area constant, and α the projected area exponent. Several
empirical values of ka and α have been reported [5-7]. The accuracy of this relationship is very
difficult to be evaluated for individual soot aggregates due to the variations in the aggregate’s
structure and its orientation on the mesh. Additionally, non-aggregate soot structures may be included as normal soot aggregates in the image analysis. Efficiently removing these artifacts from thousands of soot aggregates by vision inspection is very impracticable.
In this paper, we introduced a new TEM image analysis method that makes a combined use of the projected areas of soot aggregates and the grey image levels to more accurately determine parameters describing the morphology of soot. As this method utilizes the optical density computed from pixels in the soot aggregate relative to that from background pixels in TEM images, it has been labeled the relative optical density (ROD) method.
FORMULATION OF ROD METHOD
When a monochromatic light wave travels through a homogeneous and amorphous medium, light intensity decreases exponentially with the distance traveled by the light in the medium according to the Bouguer-Lambert Law [8]. The thickness of the media at the direction of incident light could be described as:
) /
log(I I0
l∝− out , (2)
where Iout is the intensity of the optical wave leaving the medium, I0 is the incident wave
intensity, and l the distance propagated by the optical wave through the medium. In TEM, the electron wave intensity attenuation also follows Bouguer-Lambert Law with a minor modification on the definition of the absorption coefficient [9]. In digital TEM imaging, the gray level in TEM images is proportional to the electron wave intensity that arrived at the CCD camera. In the TEM imaging procedure, electron waves travel through soot aggregates and the supporting carbon film. Different grey levels are therefore generated on the projected images, as illustrated in Fig.2.
We define the optical density (OD) of each pixel in a TEM image as:
] / ) , ( log[ ) , (x y I x y Iincident OD =− , (3)
where I(x,y) is the grey level at pixel (x,y) and Iincident the theoretical grey level for the electron
beam if it reached the CCD directly without traveling though soot aggregates and supporting carbon film. We also define the relative optical density (ROD) of each pixel:
] / ) , ( log[ ) , ( ) , (x y OD x y ODbk I x y Ibackground ROD = − =− , (4)
where Ibackground is the grey level of image locations where no soot is present. With the
assumptions of the carbon supporting film having a constant optical density and soot aggregates being amorphous and homogeneous, a quantitative linear relationship between ROD in a TEM image and the thickness of soot in the direction perpendicular to the image can be established. Furthermore, the volume of each soot aggregate can be interpreted based on the integral of ROD within its project area. The ratio of the aggregate volume to that of a standard single soot particle defines the number of primary particles within it:
3 6 p i p i i d K ROD A V V N ⋅ ⋅ ⋅ = = π , (5)
where ROD is the mean ROD within the projected area, and K the linear scaling coefficient
relating ROD to local thickness. Once Ni for all of the aggregates in TEM images is available,
key morphology parameters, i.e. Ng, σ2g, N , Df and kf can be obtained.
Fig.1 A typical TEM image of soot aggregate sampled from an ethylene/air diffusion laminar
Fig.2 Schematic of the TEM imaging process with electron wave traveling though soot
particles and the supporting carbon film To determine the value of K, numerically simulated soot aggregates were analyzed. In this study, soot aggregates were numerically simulated using a tunable cluster-cluster aggregation algorithm
for specified fractal parameters (dp, Df, and kf) [10]. The simulations were performed for soot
aggregates containing 20, 50, or 100 primary particles respectively. The primary particle
diameter used in the simulations was equal to the mean dp measured from TEM images. Normal
distributed errors on particle diameters were applied on the individual particles to simulate the real distribution of primary particle sizes. A supporting film that followed a normal distribution with a mean thickness of zero was also simulated, which is representative of the observed background ROD distribution in TEM images.
The probability histograms of local thickness for the simulated soot aggregates were constructed and compared with the probability histograms of ROD for typical real soot aggregates in TEM images. Fig. 3(a) and (b) show a typical ROD histogram for several soot aggregates with their ambient backgrounds, while Fig. 3(c) and (d) show a typical mass-thickness probability histogram for the numerical simulated soot aggregates. The similarity between the two distributions supports the assumption of a linear relationship between OD/ROD and mass-thickness of soot aggregates. In Fig.3 (a) and (b), the first peak indicates the ROD of background, while the second peak indicates the most probable ROD for soot aggregates. In Fig.3 (c) and (d), the first peak indicates the thickness of supporting film, while the second one indicates the most probable mass thickness of the soot aggregate. Value of K is determined as the ratio of the second peak locations in Fig. 3(b) and (d). Numerical simulations proved that the location of the
second peak in Fig.3 (d) is quite stable for a given Df and kf, and is insensitive to N. In this
research, K is first derived from estimated Df and kf . Subsequently, new Df and kf are derived
based on N calculated with Eq.(5). K, Df and kf can then be recalculated iteratively until the
results converge. It has been found that K converges with only just 1 or 2 iteration with a good
initial estimate of Df and kf. In this research, K = 220 nm/ROD when Df = 1.74 and kf = 2.5.
ROD value R e la tiv e P ro b a b ili ty -0.1 0 0.1 0.2 0.3 0.4 0.5 0 1 2 3 ROD value R e la tiv e P ro b a b ili ty -0.1 0 0.1 0.2 0.3 0.4 0 0.1 0.2 0.3 0.4
(a) (b) (Enlargement of (a))
Thickness at Z direction (nm) R e la tiv e P ro b a b il it y 0 20 40 60 0 0.05 0.1 0.15 0.2 0.25 0.3 Thickness at Z direction (nm) R e la tiv e P ro b a b il it y 0 20 40 60 0 0.01 0.02 0.03 0.04 (c) (d) (Enlargement of (c))
Fig.3 Typical histograms of ROD for real soot aggregates, (a) and (b), and of mass-thickness for
numerical simulated soot aggregate (c) and (d) (Df = 1.74 and kf = 2.5 )
With N determined from Eq.(5), an overlap coefficient can be defined for each object in the TEM image to evaluate the level of overlapping:
p i p i i d K ROD A d N 2 3 4 / 2 = ⋅ ⋅ ⋅ = π φ . (6)
unwanted or ‘false’ aggregate. Ideally, an object in the TEM image is not a valid soot aggregate
structure if φ is less than 1. Practically, however, this criterion should be slightly relaxed to 0.7 ~
0.9 due to the diversity of actual soot morphology (i.e. primary particle diameter).
EXPERIMENTS
The experiment was carried out in an atmospheric pressure, axisymmetric coflow laminar ethylene/air diffusion flame. The burner for generating the flame has been previously described
in detail [11]. The fuel flow rate was 3.23 cm3/s, and the air flow rate was 4733 cm3/s at the
standard condition. These conditions resulted in a visible flame height of about 67 mm. The thermophoretic sampling (TS) probe consists of a carbon coated circular copper TEM grid and a stainless steel grid holder. The probe was rapidly inserted into the flame and then rapidly withdrawn after an exposure time of 25 ms, which was controlled by a double-acting pneumatic cylinder system. The sampling location was at a height of 42 mm over the exit of the fuel tube and on the flame centerline. After the sampling procedure, the TEM grids were examined with a Philips CM20 transmission electron microscope coupled with an UltraScan 1000 CCD camera which can directly generate digital images for analysis. The images were subsequently analyzed using an image processing software package (Media Cybernetics, Image Pro Plus) to identify individual soot aggregates and their geometrical and OD parameters.
RESULT AND DISCUSSION
The ROD method was applied to the N determination for the soot aggregates thermophoretically sampled from the laminar flame mentioned above. In total, 4544 objects were identified and analyzed by the image processing software from 62 TEM images. Mean primary particle
diameter dp = 29 nm was adopted. N and φ for each object was determined with Eqs.(5) and (6)
respectively.
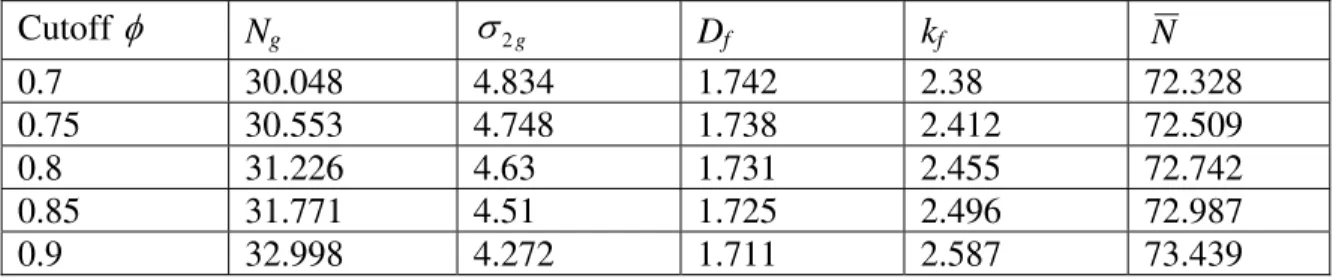
Ng and σ2g are obtained by fitting the probability distribution of N with a log-normal distribution
curve, while Df and kf were obtained from a least-square fit based on N and the geometrical
parameters for the aggregates with N >3. In this research, a series value between φ =0.7~0.9
was adopted, respectively, as the criteria to remove the non-soot aggregate objects. The results
are summarized in Table I. It is found that the selection of different cutoff φ only makes slight
difference in the final soot morphology and fractal structure parameters.
Table I. The soot morphology fitting result based on different φ cutoffs for N>5
Cutoff φ Ng σ2g Df kf N 0.7 30.048 4.834 1.742 2.38 72.328 0.75 30.553 4.748 1.738 2.412 72.509 0.8 31.226 4.63 1.731 2.455 72.742 0.85 31.771 4.51 1.725 2.496 72.987 0.9 32.998 4.272 1.711 2.587 73.439
statistical method based on Eq.(1) for the same TEM images [12], but is close to that of Köylü et
al. [13] (N =80~90) at the comparable height in a similar flame using similar techniques. The
values of Df and kf compare very well with the values reported in [7] with Df = 1.7±0.15 and kf =
2.4±0.4.
CONCLUSION
A new image processing method, the relative optical density method, was introduced and developed for deriving accurate parameters describing the morphology of soot particles based on their TEM images. In this method, the number of primary particles in each individual aggregate is related to its projected area and its relative optical density distribution in the TEM image. The calibration for this quantitative relationship was obtained by comparing the probability histograms of mass-thickness of numerically simulated soot aggregates and ROD of real soot aggregates in TEM images. This method has proven to be a reasonable and reliable TEM image processing method for soot morphology investigation. It is independent of empirical or numerically simulated constants employed by other methods. An overlap coefficient was introduced in this method to help identify and remove non-soot-aggregate objects in the TEM images. Based on this method, soot morphology parameters were obtained. The results are in good agreement with the results reported in the literature.
REFERENCES
1. Vander Wal, R. L., and Weiland, K. J., Appl. Phys. B, 59: 445 (1994) 2. Shaddix, C. R., and Smyth, K. C., Coubust. Flame, 99: 723 (1994)
3. Santoro, R. J., Semerjian, H. G., and Dobbins, R. A., Combust. Flame, 51: 203 (1983) 4. Xing, Y., Köylü, Ü. Ö., and Rosner, D. E., Applied Optics, 38: 2686 (1999)
5. Megaridis, C. M., and Dobbins, R. A., Combust. Sci. Technol., 71: 95 (1990) 6. Brasil, A. M., Farias, T. L., and Carvalho, M. G., J. Aerosol Sci., 30: 1379 (1999) 7. Köylü, Ü. Ö., Xing, Y., and Rosner, D. E., Langmuir, 11: 4848 (1995)
8. Akhmanov, S. A., and Nikitin, S. Yu., Physics Optics, Clarendon Press, Oxford, New York, (1997)
9. Heidenreich, R. D., Fundamentals of Transmission Electron Microscopy, John Wiley & Sons, New York, (1964)
10. Filippov, A. V., Zurita, M., and Rosner, D. E., J. Colloid Interface Sci., 229: 261 (2000) 11. Snelling, D. R., Thomson, K. A., Smallwood, G. J., and Gülder, Ö.L., Applied Optics, 38:
2478 (1999)
12. Tian, K., Liu, F., Thomson, K. A., Snelling, D. R., Smallwood, G. J., and Wang, D., Combust. Flame, 138: 195 (2004)
13. Köylü, Ü. Ö., Mcenally, C. S., Rosner, and D. E., Pfefferle, L. D., Combust. Flame, 110: 494 (1997)