Publisher’s version / Version de l'éditeur:
Vous avez des questions? Nous pouvons vous aider. Pour communiquer directement avec un auteur, consultez la première page de la revue dans laquelle son article a été publié afin de trouver ses coordonnées. Si vous n’arrivez pas à les repérer, communiquez avec nous à PublicationsArchive-ArchivesPublications@nrc-cnrc.gc.ca.
Questions? Contact the NRC Publications Archive team at
PublicationsArchive-ArchivesPublications@nrc-cnrc.gc.ca. If you wish to email the authors directly, please see the first page of the publication for their contact information.
https://publications-cnrc.canada.ca/fra/droits
L’accès à ce site Web et l’utilisation de son contenu sont assujettis aux conditions présentées dans le site LISEZ CES CONDITIONS ATTENTIVEMENT AVANT D’UTILISER CE SITE WEB.
Research Report (National Research Council of Canada. Institute for Research in
Construction), 2003-04-30
READ THESE TERMS AND CONDITIONS CAREFULLY BEFORE USING THIS WEBSITE. https://nrc-publications.canada.ca/eng/copyright
NRC Publications Archive Record / Notice des Archives des publications du CNRC :
https://nrc-publications.canada.ca/eng/view/object/?id=2abba791-6a3e-405d-a370-97c9bb6a3d69 https://publications-cnrc.canada.ca/fra/voir/objet/?id=2abba791-6a3e-405d-a370-97c9bb6a3d69
Archives des publications du CNRC
For the publisher’s version, please access the DOI link below./ Pour consulter la version de l’éditeur, utilisez le lien DOI ci-dessous.
https://doi.org/10.4224/20378940
Access and use of this website and the material on it are subject to the Terms and Conditions set forth at
Lighting for VDT Workstations 1: Effect of Control on Energy
Consumption and Occupant Mood, Satisfaction and Discomfort
Lighting for VDT Workstations 1: Effect of Control on Energy
Consumption and Occupant Mood, Satisfaction and Discomfort
Newsham, G.; Veitch, J.; Arsenault, C.;
Duval, C.
IRC-RR-165
April 2003
Lighting for VDT workstations 1:
Effect of control on energy consumption
and occupant mood, satisfaction and discomfort
Guy Newsham, Jennifer Veitch, Chantal Arsenault, Cara Duval
Institute for Research in Construction
National Research Council Canada, Ottawa, ONT, K1A 0R6, Canada
IRC Research Report RR-165
Lighting for VDT workstations 1: Effect of control on energy consumption and occupant mood, satisfaction and discomfort
Guy Newsham, Jennifer Veitch, Chantal Arsenault, Cara Duval
Executive Summary
This experiment was conducted in a mock-up office space in a laboratory. 118 participants worked for a single day under one of four lighting designs. They had no control over the lighting until the last half of the afternoon, when all participants were offered some form of individual dimming lighting control. During this working day they completed a variety of simulated office tasks (not analysed in this report, but to be reported later), as well as completing a number of questionnaires. The experiment was designed to address several research questions with direct relevance to office lighting practice. We looked at preferences for particular lighting designs, particularly designs that provide higher levels of vertical illuminance. We were also interested in whether local/task lighting sources reduced the demand for ambient lighting. We also examined whether providing individual dimming control over luminaires was beneficial.
Within the limits of the experimental design, we drew several interesting conclusions. Firstly we found that introducing individual lighting control
improves ratings of mood, satisfaction and discomfort, independent of the lighting design.
Specifically, we saw significant improvements after control was introduced in Mood (Dominance and Arousal), Room Appraisal (Pleasantness, Variability, Informalness, Illumination), Lighting Satisfaction, Glare Dissatisfaction, Environmental Satisfaction, Satisfaction with performance during the experimental Session, Self-assessed
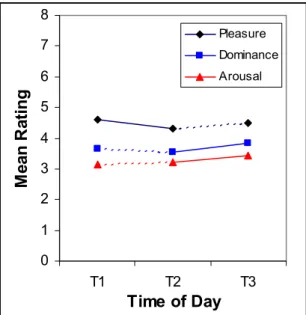
Productivity, and Visual Discomfort. The Mood effects are illustrated in Figure A; note that in studies with static environmental conditions, mood tends to decline continuously throughout a working day.
Further, our results suggest that it is not control in
itself that is important, but exercising control to achieve preferred conditions. Participants who
made the biggest changes to lighting conditions after they were given control tended to register the
biggest improvements in mood, satisfaction and discomfort outcomes, and, indeed, that those who made little change registered little or no improvements in outcomes.
0 1 2 3 4 5 6 7 8 T1 T2 T3 Time of Day M ean R at in g Pleasure Dominance Arousal
Figure A. The effect of time-of-day on Mood. T1=am,T2=pm-before control was introduced, and T3=pm-after control was introduced. Note, solid lines indicate statistically significant contrasts.
Results concerning the effect of additional vertical illuminance or a desk lamp were equivocal.
The custom “partition washer” (shown in Figure B) and the desk lamp were used by participants, but in neither case were there any effects on mood, satisfaction and discomfort outcomes. Further, use
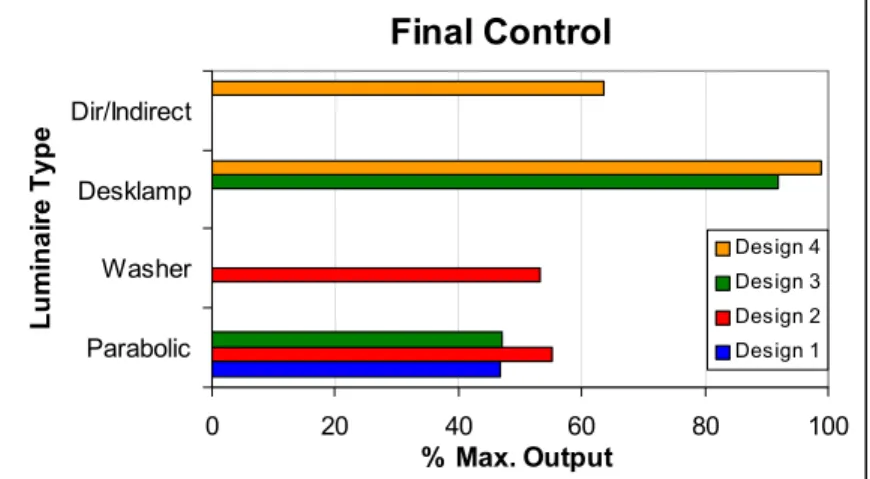
of the local “partition washer” or desk lamp did not offset use of the ceiling-recessed ambient lighting system (Figure C). A popular proposal for energy-efficient office lighting is to substantially
reduce typical ambient light levels and to provide low-wattage, task-specific sources to compensate. Our result suggests that this strategy, in terms of occupant preference, could be flawed.
One of the lighting designs was chosen to resemble a new, low-energy lighting design being installed in Canadian Federal Government buildings. It featured a workstation-specific dimmable direct/indirect fixture and a desk lamp, and has been proposed as a lighting design to maintain satisfaction while saving energy. Our results showed that in terms of mood, satisfaction and discomfort outcomes this design was generally neither better nor worse than the other designs we tested. However, results from this project and earlier work indicate that some participants prefer light levels outside the range provided by this design. Modifying this design to offer a greater range of illuminances might prove beneficial.
Figure B. One of the 4 lighting designs used. It featured a custom “partition washer” to provide additional vertical illuminance. The ambient system for 3 of 4 designs was the parabolic system shown.
Additional photometric and task performance data were collected in this experiment. The analysis of this data will be presented in a future report, and might modify these conclusions. In any case, further study is recommended. Organizations stand to realize substantial benefits if the
improvement due to individual lighting controls persist in a real workplace over a longer time period.
Final Control
0 20 40 60 80 10 Parabolic Washer Desklamp Dir/Indirect Lu m inai re T y p e % Max. Output Design 4 Design 3 Design 2 Design 1 0 This report is the first on a largerproject. Further analysis of the additional photometric and task performance data is reported in Newsham et al. [2004].
Figure C. Mean dimmer setting for each luminaire circuit at the end of the experimental day, for each lighting design. Design 1 featured ceiling recessed parabolics only; Design 2 was as Design 1 with the addition of a partition washer (See Figure B); Design 3 was as Design 1 with the addition of a desk lamp; Design 4 featured a workstation-specific dimmable direct/indirect fixture and a desk lamp.
Table of Contents
1. INTRODUCTION ...5
2. METHODS & PROCEDURES...7
2.1 THE EXPERIMENTAL SPACE...7
2.2 THE LIGHTING DESIGNS...8
2.3 PARTICIPANTS...11
2.4 EXPERIMENTAL PROCEDURE...13
2.5 SIMULATED OFFICE TASKS AND QUESTIONNAIRES...16
2.6 PHYSICAL MEASUREMENTS...19
3. RESULTS & DISCUSSION ...20
3.1 DOES PROVIDING TASK/PARTITION LIGHTING REDUCE AMBIENT LIGHTING USE? ...21
3.2 WHAT ARE OCCUPANTS’ PREFERRED DESKTOP AND PARTITION ILLUMINANCES? ...22
3.3 WHAT IS THE EFFECT OF GETTING LIGHTING CONTROL ON MOOD AND SATISFACTION? ...25
3.4 WHAT IS THE EFFECT OF WORKING UNDER NON-PREFERRED LIGHTING CONDITIONS ON MOOD AND SATISFACTION? ...34
3.5 IS THERE AN EFFECT OF LIGHTING DESIGN, AND IS ADDITIONAL VERTICAL LUMINANCE BENEFICIAL? ...38
4. FURTHER DISCUSSION ...38 5. CONCLUSIONS...39 6. ACKNOWLEDGEMENTS ...40 7. REFERENCES ...40 APPENDIX A ...43 APPENDIX B...44 APPENDIX C ...45 APPENDIX D ...46
1. INTRODUCTION
Current recommended practice for VDT office lighting suggests that the luminance of vertical surfaces in the field of view is just as important in determining lighting quality in open-plan offices as desktop illuminance [IESNA, 2000]. However, typical direct ambient lighting systems are more efficient at lighting the desktop than vertical surfaces, which is understandable given that delivering horizontal illuminance has been the focus of the office lighting industry for many decades. Another one of the main goals of office lighting design has been to reduce reflected glare in computer screens. This is commonly done using ceiling-recessed fixtures with parabolic louvers; a side-effect of this luminaire design is that light distribution to vertical surfaces is compromised. This is
unfortunate given the results of an experiment by Berrutto et al. [1997]. They constructed mock-up private offices where participants had control of five lighting circuits, including wall washers. Their results stressed the importance of the wall luminance in participants’ lighting choices. One goal of the experiment described in this report was to examine if the luminance of partial-height partitions (the most common type of office enclosure in North America) is similarly important.
Previous work in mock-up open-plan offices has generated much useful information about preferred lighting conditions [Newsham & Veitch, 2001; Veitch & Newsham, 1998; Veitch & Newsham, 2000a; Veitch & Newsham, 2000b; Newsham et al., 2002a]. An understandable shortcoming in the
experimental designs was the inability to physically separate the luminance of different surfaces. This is inevitable with typical ambient lighting systems: parameters such as desktop illuminance and partition luminance are highly intercorrelated. This causes a problem experimentally, because it is very difficult to determine which surfaces are most important for occupant satisfaction. The most energy-efficient use of light might rest on lighting the most important surfaces while not “wasting” light on unimportant surfaces. It is possible that lighting designed to illuminate open-office partitions efficiently will produce a luminous environment that is more satisfactory to the occupants than traditional designs, and at lower power draw. For the purposes of this experiment, we built a custom “partition washer” designed to preferentially light the office partitions.
It is often suggested that providing light local to the task area can compensate for substantial reductions in ambient lighting and lighting energy consumption [Tiller et al., 1995], while providing a satisfactory luminous environment [Veitch & Newsham, 1998; New Buildings Institute, 2001; Hedge, 1998]. For example, Yamakawa et al. [2000] conducted a study of task-ambient lighting use in a mock-up office space. In their study, participants were exposed to ambient lighting from ceiling-recessed parabolic fixtures at one of three fixed levels of 200, 300 or 400 lx. Participants then used a dimmer control to select a preferred level of output from a task light. On average, a 100 lx reduction in ambient lighting was compensated by only a 30 lx increase in task lighting. In our experiment we explored whether local partition or task lighting can displace ambient lighting to deliver net energy savings.
In addition, this experiment also investigated the benefits of providing individual lighting control. Surveys consistently indicate that building occupants both desire more control over their environment, including lighting, and believe that such control is linked to important health and performance
outcomes [Steelcase 1999; Bordass & Leaman, 1993]. Several recent laboratory and field studies have demonstrated that individual lighting control is associated with satisfaction benefits and energy savings [Boyce et al., 2000; Jennings et al., 2000; Veitch & Newsham, 2000a; Carter et al., 1999; Maniccia et al., 1999; Escuyer & Fontoynont, 2001].
Further, this experiment specifically tested the hypothesis that working under lighting conditions that match the occupant’s personal preference (or close to it) will improve satisfaction and task
performance (the positive affect hypothesis). Baron has demonstrated this effect with fragrances [Baron & Thomley, 1994] and, to a lesser extent, with lighting conditions (fluorescent lamp type and horizontal illuminance) [Baron et al., 1992]. Newsham & Veitch [2001] also obtained supporting results with regard to luminous conditions. Their data came from participants who occupied a mock-up office space for a day and completed various simulated office tasks and questionnaires. They
examined data from participants who worked under a fixed, pseudo-random lighting condition during the day, and made their own preferred lighting choice at the end of the day. Participants whose daytime light levels were closest to their own preference had significantly better ratings of mood (pleasure), lighting satisfaction, and environmental satisfaction.
Newsham et al. [2002] conducted a pilot study designed to address some of the issues outlined above. They demonstrated a significant improvement in satisfaction with lighting after dimming control over a single circuit was introduced in a mock-up office space. Further, their data indicated that participants desired an increased level of partition illuminance (delivered using a partition
washer) beyond that provided by a conventionally-designed ceiling-recessed parabolic system alone. The experiment described in this report grew out of this pilot study.
With regard to the introduction above, the experiment described in this report was designed to address several research questions:
1. Does providing task/partition lighting reduce ambient lighting use? 2. What are occupants’ preferred luminous conditions?
3. What is the effect of getting lighting control on mood, satisfaction, and task performance? 4. What is the effect of working under non-preferred lighting conditions on mood, satisfaction,
and task performance?
5. Is there an effect of lighting design, and is additional vertical luminance beneficial? In this initial report we will limit our analyses to questions 1, 2 (desktop illuminance and partition illuminance at a single representative point only), 3 (mood and satisfaction effects only), 4 (mood and satisfaction effects only), and 5 (mood and satisfaction effects only). Additional analyses from the experimental data to address the above questions with reference to more detailed photometric data, and task performance outcomes are reported in Newsham et al. [2004].
2. METHODS & PROCEDURES
This project, involving human participants, was approved by the NRC Research Ethics Board (Protocol 2001-5), as is required. This process involves a scientific peer review by an IRC committee, to verify that the research methods are adequate to answer the research question, followed by an NRC Ottawa Research Ethics Board review of the entire protocol for recruitment, informed consent, and data collection from participants.
2.1 The Experimental Space
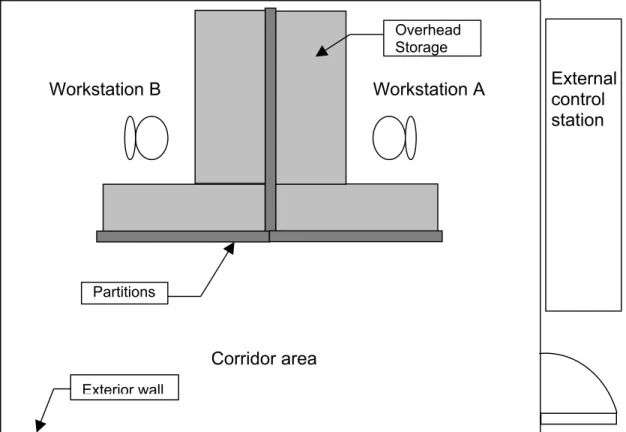
The experimental space was 7m x 4.9m (20’ x 16’) and 2.75m (9’) high, with a standard suspended ceiling T-bar system. Within this space were two workstations approx. 2.7m x 2.9m (8’ 9” x 9’ 6”), and a corridor area (Figure 1). The workstations were formed using two of the outside walls of the room and two 1.7m (5’ 7”) height partition walls; the partitions enclosed free-standing desks. Fabrics and finishes for the room and workstations were shades of grey, chosen to minimise chromatic effects in the luminous environment (see Figure 2 for a photograph of the space). Mirrors were installed across the width of each of the full-height walls, extending from the ceiling down to a depth of 0.45m (18”). These mirrors create a general feeling of a larger space, and, in particular, an infinite ceiling.
There was a control station external to the experimental space. The control station allowed override control of all lighting circuits, provided for data acquisition, and also housed the lighting switchgear.
Exterior wall
Corridor area
PartitionsExternal
control
station
Overhead StorageWorkstation B
Workstation A
2.2 The Lighting Designs
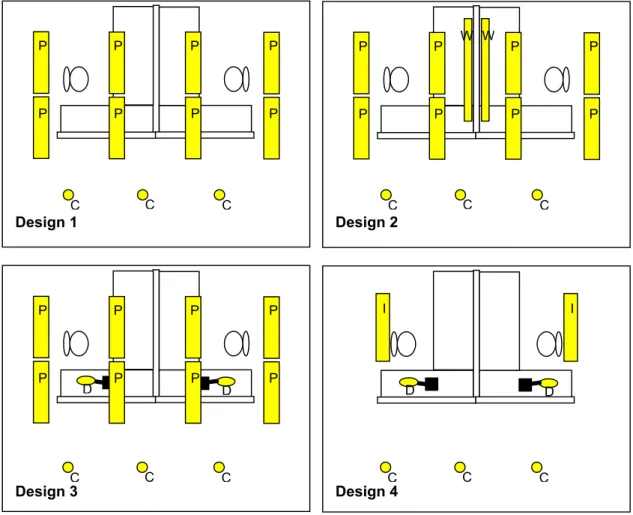
Four lighting designs were used in this experiment. Figure 3 shows a schematic layout for each design and total installed lamp wattage, and Figure 4 shows a corresponding photograph. Identical luminaires have the same letter code, and are described by this letter code in Table 1 below.
Table 1. Description of the luminaires used. Letter
Code
Description
P 1’ x 4’ deep-cell parabolic louvre fixtures, recessed in the ceiling. 2 x 32W T8 lamps (3500K); Electronic dimming ballast (5-110%). I 10” x 4.5’ Direct/indirect fixtures, suspended 18” from the ceiling.
2 x 32W T8 lamps (3500K); Electronic dimming ballast (5-110%). W Partition washer: 3 x 2’, cantilevered from partition
1 x 17W T8 lamp each (3500K) + 50% neutral density filter Electronic dimming ballast (5-110%).
D Angle-arm task light; 1 x 18Wquad CFL (4100K) C Pot light for corridor area.
1 x 50W PAR 20 Halogen floodlight.
Lighting Design 1 was chosen as a typical office lighting installation of ceiling-recessed parabolic fixtures, and was designed to serve as a base case for comparison with other designs. Design 2 featured a custom “partition washer” fixture designed to explore whether additional vertical luminance in the field of view was desired and beneficial, and whether provision of such localized lighting would reduce the amount of ambient lighting from overhead preferred by participants. Design 3 featured an angle-arm desk light designed to explore whether additional task lighting was desired and beneficial, and whether provision of such localized lighting would reduce the amount of ambient lighting from overhead preferred by participants. Design 4 was designed to resemble a new, low-energy lighting design being installed in Canadian Federal Government buildings, to examine whether replacing the higher power draw recessed ambient lighting system with a workstation-specific dimmable
direct/indirect fixture could maintain satisfaction while saving energy.
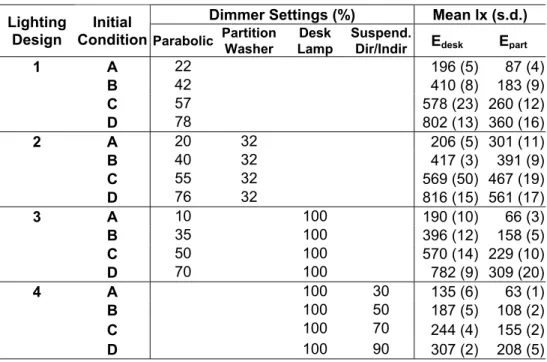
Each of the 4 lighting designs was set at one of 4 initial output conditions, making a total of 4 x 4, or 16 initial lighting conditions, as described in Table 2. Illuminance measurements refer to the desktop and partition measurement points described below in Section 2.7. For Designs 1, 2, and 3 we aimed to produce initial illuminance conditions at the representative point on the desktop of 200, 400, 600, and 800 lx. The dimmer settings for the overhead parabolics were lower for Design1 than for Designs 2 and 3 because of the spill light on the desktop from the partition washers and desk lamp, respectively. Design 4 was not capable of generating as much light on the desktop as the other designs, in this case our aim was to generate equally-spaced conditions of 150, 200, 250 and 300 lx.
C C C C C C C C Design 4 C D D I I Design 3 C Design 2 C Design 1 C P D P D P P P P P P P P W W P P P P P P P P P P P P P P
Design 4 Design 3
Design 2 Design 1
.
Table 2. Initial luminous conditions, by lighting design and initial condition, measured at mid-morning during the experimental sessions. Edesk is representative desktop illuminance, Epart is representative
partition illuminance, see Figure 7 for locations.
Dimmer Settings (%) Mean lx (s.d.) Lighting
Design
Initial
Condition Parabolic Partition Washer
Desk Lamp
Suspend.
Dir/Indir Edesk Epart
1 A 22 196 (5) 87 (4) B 42 410 (8) 183 (9) C 57 578 (23) 260 (12) D 78 802 (13) 360 (16) 2 A 20 32 206 (5) 301 (11) B 40 32 417 (3) 391 (9) C 55 32 569 (50) 467 (19) D 76 32 816 (15) 561 (17) 3 A 10 100 190 (10) 66 (3) B 35 100 396 (12) 158 (5) C 50 100 570 (14) 229 (10) D 70 100 782 (9) 309 (20) 4 A 100 30 135 (6) 63 (1) B 100 50 187 (5) 108 (2) C 100 70 244 (4) 155 (2) D 100 90 307 (2) 208 (5)
2.3 Participants
Participants were recruited from a local temporary-employment agency. Potential participants were contacted through the agency where they were given information about the study (see Appendix A) and invited to participate. The agency pre-screened potential participants to ensure that they met the following criteria: minimum 18 years of age; normal or corrected-to-normal vision; normal hearing; no mobility impairments; experience with Windows™-based software; and, a minimum score on the agency’s word fluency test (to ensure that all participants had were sufficiently fluent in English to complete the tasks). Participants were paid at their normal rate for a day’s work.
The agency created a pool of potential, pre-qualified, participants. During each week of the study, 6-8 participants were drawn randomly from the pool, in gender-matched pairs, to participate. Prior to recruitment, a random order of lighting designs was prepared. Typically, a particular design+initial condition was installed for two days of testing (one with male participants, one with female, gender order randomly determined), followed by a non-testing day to change lighting conditions, and so on. Thus was random assignment of participants to lighting conditions achieved.
A power analysis suggested a target of six participants for each of the 16 lighting conditions (4 designs x 4 initial settings). Because we wanted to run gender-matched pairs on each day of testing, we targeted 4 males and 4 females for each lighting condition, with a minimum target of complete data from 3 males and 3 females per condition. This allowed for expected attrition of subjects during the testing days, equipment failures, and participant no-shows. Therefore we had a minimum possible sample size of 96, and a maximum possible of 128. In fact, complete data were collected from 118 participants.
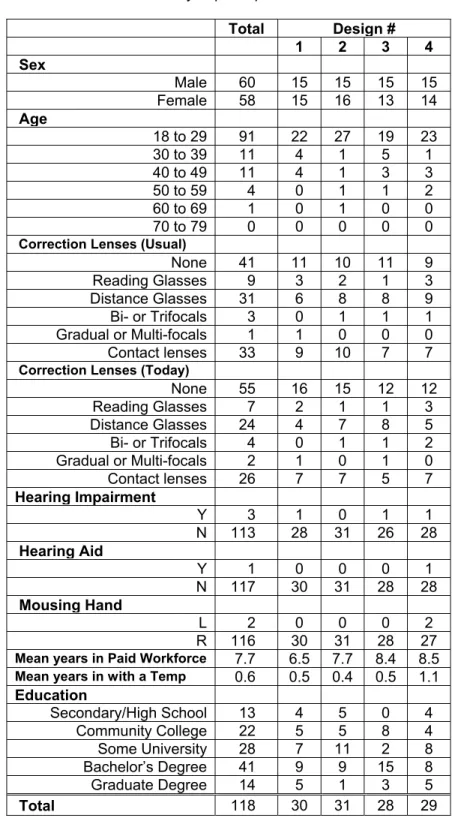
Participant characteristics, collected via an on-screen questionnaire, are shown in Table 3. We clearly achieved a very good balance of males and females in the sample. A large majority of participants were in the youngest age category, this was expected given that most data collection was done over summer months, when many temporary agency staff are students (note the modal educational level was ‘some university’). Overall, demographic characteristics were relatively evenly distributed across lighting designs, and simple Pearson chi-squared tests showed no significant association between lighting design and any of the demographic variables.
Table 3. Summary of participant characteristics. Total Design # 1 2 3 4 Sex Male 60 15 15 15 15 Female 58 15 16 13 14 Age 18 to 29 91 22 27 19 23 30 to 39 11 4 1 5 1 40 to 49 11 4 1 3 3 50 to 59 4 0 1 1 2 60 to 69 1 0 1 0 0 70 to 79 0 0 0 0 0
Correction Lenses (Usual)
None 41 11 10 11 9 Reading Glasses 9 3 2 1 3 Distance Glasses 31 6 8 8 9 Bi- or Trifocals 3 0 1 1 1 Gradual or Multi-focals 1 1 0 0 0 Contact lenses 33 9 10 7 7
Correction Lenses (Today)
None 55 16 15 12 12 Reading Glasses 7 2 1 1 3 Distance Glasses 24 4 7 8 5 Bi- or Trifocals 4 0 1 1 2 Gradual or Multi-focals 2 1 0 1 0 Contact lenses 26 7 7 5 7 Hearing Impairment Y 3 1 0 1 1 N 113 28 31 26 28 Hearing Aid Y 1 0 0 0 1 N 117 30 31 28 28 Mousing Hand L 2 0 0 0 2 R 116 30 31 28 27
Mean years in Paid Workforce 7.7 6.5 7.7 8.4 8.5 Mean years in with a Temp 0.6 0.5 0.4 0.5 1.1
Education Secondary/High School 13 4 5 0 4 Community College 22 5 5 8 4 Some University 28 7 11 2 8 Bachelor’s Degree 41 9 9 15 8 Graduate Degree 14 5 1 3 5 Total 118 30 31 28 29
2.4 Experimental Procedure
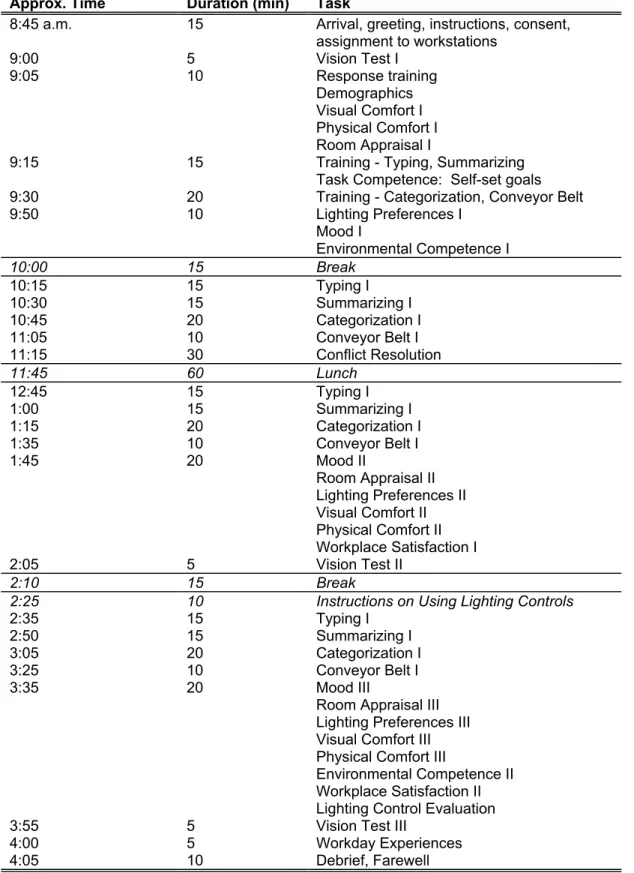
Sessions were scheduled to begin at 9am and finish at 4pm. Table 4 shows the model experimental schedule followed with each participant, though the actual time spent on each task varied somewhat between participants because several aspects of the day (e.g. questionnaires, instruction screens) were not done in a fixed length of time.
The participants were greeted by the experimenter in the building lobby and escorted to a reception room separated from the experimental space. They were briefed on the experiment (see Appendix B) – note the experiment was described as being about office spaces in general, not specifically about lighting – and then asked to sign a consent form (see Appendix C).
Next, the experimenter took the participants to the experimental space and showed them the
workstation that they would occupy (randomly assigned) and the adjustments they could make to the chair and keyboard tray. We did not allow adjustments to the computer screen brightness, tilt or position because of the effect of these choices on important visibility-related outcomes. The
experimenter explained the tasks to be performed during the session. Participants were not allowed to change the location of luminaires in any way1.
The experimenter then left the room and closed the door. For the remainder of the session the participant was guided by instructions presented on the computer screen, with appropriate audio alarms. The experimenter remained in the adjoining laboratory to answer any arising questions. The door to the experimental space had a window with a blind that remained closed unless the
experimenter had a reason to check on the participant. The computer also prompted participants to take coffee and lunch breaks, which participants took in the same reception room where they had signed the consent form.
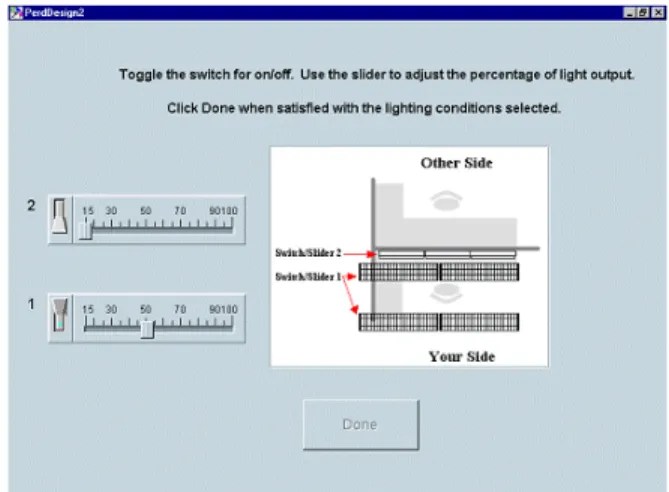
When participants returned from the afternoon coffee break on-screen instructions informed them that they now had control over the lighting assigned to their workstation. In Design 1 this meant dimming control over the recessed parabolics (one circuit). In Design 2 this meant dimming control over the recessed parabolics (one circuit), and the partition washer (one circuit). In Design 3 this meant dimming control over the recessed parabolics (one circuit), and the ability to move the arm of the task light. In Design 4 this meant dimming control over the suspended direct/indirect fixture (one circuit), and the ability to move the arm of the task light. Instructions on how to use the on-screen dimming controls provided were given on the computer, but the experimenter was always nearby if there were any questions. The on-screen dimming interface for each lighting design is shown in Figure 5. On-screen dimmers were calibrated with the native response function of the ballasts to provide 10 – 99% of full light output with a linear response.
During the day the participants carried out various computer- and paper-based tasks, designed to simulate aspects of office work. They also completed a variety of on-screen questionnaires concerning mood and satisfaction. These tasks are described in detail in the next section.
1
The desk lamp arm was not fixed in position, so it was possible for the participants to move it, even though they were told not to.
Design 2 Design 1
Design 3 Design 4
Table 4. Model experimental schedule for each participant. Approx. Time Duration (min) Task
8:45 a.m. 15 Arrival, greeting, instructions, consent, assignment to workstations 9:00 5 Vision Test I 9:05 10 Response training Demographics Visual Comfort I Physical Comfort I Room Appraisal I
9:15 15 Training - Typing, Summarizing
Task Competence: Self-set goals 9:30 20 Training - Categorization, Conveyor Belt
9:50 10 Lighting Preferences I Mood I Environmental Competence I 10:00 15 Break 10:15 15 Typing I 10:30 15 Summarizing I 10:45 20 Categorization I 11:05 10 Conveyor Belt I 11:15 30 Conflict Resolution 11:45 60 Lunch 12:45 15 Typing I 1:00 15 Summarizing I 1:15 20 Categorization I 1:35 10 Conveyor Belt I 1:45 20 Mood II Room Appraisal II Lighting Preferences II Visual Comfort II Physical Comfort II Workplace Satisfaction I 2:05 5 Vision Test II 2:10 15 Break
2:25 10 Instructions on Using Lighting Controls
2:35 15 Typing I
2:50 15 Summarizing I
3:05 20 Categorization I
3:25 10 Conveyor Belt I
3:35 20 Mood III
Room Appraisal III Lighting Preferences III Visual Comfort III Physical Comfort III
Environmental Competence II Workplace Satisfaction II Lighting Control Evaluation
3:55 5 Vision Test III
4:00 5 Workday Experiences
2.5 Simulated Office Tasks and Questionnaires
As always in our experiments of this type, participants spend their time doing a variety of simulated office tasks and answering related questionnaires. Performance on these tasks, and responses to the questionnaires, along with the lighting conditions chosen by each participant, form the dependent variables in this experiment. The tasks and questionnaires are described individually below.
Remember, this report does not contain data analysis of the task performance outcomes. Vision Test. We measured contrast sensitivity using custom software. A target grating was presented on the computer screen, and the participant’s task was to indicate, as fast as they could, whether they saw a target or not by pressing a ‘Yes’ or ‘No’ key on the keyboard. The target was varied by foreground:background contrast, orientation (lines horizontal or vertical), and size (width of the grating lines within the fixed-size target). We recorded both accuracy and speed of detection as indicators of the development of visual fatigue. This was the only task where we controlled task-eye geometry. Participants positioned their head in a chin cup, which was 40” (1.02m) from the ground, and 20” (0.51m) from the computer screen, as shown in Figure 6.
Figure 6. The chin cup used for the vision test.
Visual and Physical Comfort. Visual comfort was measured using a modification of the scale
developed by Wibom & Carlsson [1986], which they used to demonstrate that luminance ratios > 10:1 between paper and VDT screen tend to reduce visual comfort over several hours. The original scale asks respondents to indicate both the frequency and the intensity with which they experience eight symptoms of eye discomfort (smarting, itching, gritty feeling, aches, sensitivity to light, redness, teariness and dryness). Frequency (never, daily, weekly...) is meaningless to this one-day test, so we used only the intensity rating (between 0 and 4). Scores were the sum of intensity ratings for the eight symptoms; thus, they could range from 0-32.
Immediately after the visual comfort questionnaire, participants were asked to report musculoskeletal comfort and symptoms such as headache that might be associated with postural changes in relation to lighting conditions. This scale was used in previous lighting research [Veitch & Newsham, 2000a], and is based on other scales in the human factors literature. Here too, scores were the sum of intensity ratings on scales from 0-4 for nine symptoms, giving a possible range from 0-36.
Simple Cognitive/Clerical Performance. This was assessed using a typing task scored for speed and accuracy. In this task, participants retyped three 300-word passages from printed originals. The three passages were presented in differing font sizes: 8, 12, and 16 point Times Roman, while the
on-screen font size was always 12 point. The software required participants to type the text correctly; speed and number of errors were automatically recorded. Participants were asked to place the paper on a document holder (not adjustable), which was at a fixed location on the desk close to the
computer screen.
The visibility effect provides an index of the sensitivity of the experiment, as it is well-understood. Complex Cognitive Performance. There were three measures of this construct. All were based on short articles on popular topics broadcast in the popular media. The selected articles were 200-300 words long.
1. Article Categorisation. The participant saw a 40-60-word summary of a given article (the first 3 or 4 sentences), shown in 12-point type. Below the article was a list of 4 categories into which the article might be placed. In half of the summaries some words of text were highlighted; the highlighted text was designed to indicate a key phrase in the text to aid categorisation. The task was to read the summary and to place it in a category. Dependent measures were the time required to perform the categorisation and accuracy of categorisation (correct responses were established by independent ratings from three researchers).
2. Summary Evaluations. Clicking 'Done' after the categorisation question caused a rating question to appear, in which the participant indicated on a 0-100 slider their interest in reading the whole article based on just the summary. Clicking "Done" after this question caused the screen to refresh. The entire article appeared in another box, along with the summary and an area in which there were three more rating questions. The participants were asked to indicate their agreement with the following statements: "The summary contains all the important facts expressed in the full article"; "The summary is grammatically correct"; "The summary is well written". Responses were on a 5-point scale from Strongly Disagree to Strongly Agree (0-4).
3. Summary Extraction. Participants read an article on paper. When they had finished, a list of all the sentences appearing in the article in sequential order appeared on screen. Participants were asked to indicate the 4 most important sentences in the article in conveying the meaning of the article (by checking a box beside the sentences they chose). This task is much easier to score than
summaries generated from free composition. The dependent measure was the time taken. Conflict Resolution. Participants read scenarios describing common workplace conflicts, then responded using multiple choice to indicate their preferred conflict resolution styles: Competition, Accommodation, Collaboration, Compromise, or Avoidance. It was based on the 2-dimensional model of conflict proposed by Thomas [Kilmann & Thomas, 1977; Thomas, 1976].
Vigilance/Alertness. There was always an envelope icon on the computer screen in a fixed location. Participants were instructed that when the icon changed colour and they heard a 'beep', they were to click on the icon as quickly as possible. The dependent variable is the time taken to respond to the event. These events occured at pre-determined random intervals (but not during any other timed task, to avoid software conflicts).
Motivation/Persistence. The NRC conveyor belt task, with a simple target moving at higher and higher speeds, was the measure of persistence. Symbols entered the screen from the left, travelling along a black line that represents a conveyor belt. Certain symbols were designated as targets. When targets crossed the screen into a box called the 'removal area', participants were instructed to remove them as quickly as possible by pressing the spacebar on the computer keyboard.
Participants were instructed to stop responding when they could no longer keep up. The dependent measure of persistence was the maximum speed at which they stopped responding. This measure is analogous to the paper-based task developed by Feather [1962], in which participants try to complete impossible puzzles. We also measured the rate of correct target removal.
Environmental Competence. No scale exists to measure environmental competence in an experimental context, but a new measure was adapted from Jones & Veitch [2000] for this study. Jones & Veitch developed a 5-item scale to assess office workers' feelings of competence to create desirable environmental conditions in their usual workplaces; it is analogous to common scales measuring job competence [e.g., Wagner & Morse, 1975]. Participants indicated their agreement or disagreement with such statements as "I believe I know how to create good working conditions for myself." A four-item version of the scale demonstrated acceptable internal consistency reliability (.73, N=93). It is expected that individuals with personal control of the lighting will report higher feelings of environmental competence than those without.
Mood. Mood was assessed using the Russell and Mehrabian 3-Factor Mood Scale [Russell & Mehrabian, 1977]. This is a well-documented psychological measure that has been used
successfully in previous research to detect subtle emotional effects of experimental conditions [e.g., Veitch et al., 1991; Newsham & Veitch, 2000]. It provides scores on an 8-point scale for Pleasure, Arousal, and Dominance factors, each of which is the average of the scores on 6 semantic differential pairs relating to that factor.
Room Appraisal. The room appraisal measure was a set of 27 semantic differentials based on well-known lighting research [Flynn et al., 1979; Loe et al., 1994]. Each adjective pair was presented on the computer at opposite ends of a sliding scale scored from 0 to 100. This set of scales was used by Veitch & Newsham [1998] and shown to be sensitive to differences in lighting design.
Lighting Preferences. We used the lighting quality scale developed by Veitch & Newsham [2000], which includes scales for lighting satisfaction and glare dissatisfaction.
Workplace Satisfaction. Three measures indicated overall workplace satisfaction. Overall
environmental satisfaction was measured using the four-item scale developed by Sundstrom et al. [1994], which has good internal consistency reliability and is sensitive to changes in lighting conditions [Newsham & Veitch, 2000; Veitch & Newsham, 1998]. A similar set of four questions assessed participants' satisfaction with their performance during the experimental session. One further question asked the participants’ opinion concerning the effects that the physical environment during the experimental session had on their self-assessed productivity, in comparison to the settings where they usually work, Veitch & Newsham [1998] found that this measure was sensitive to changes in lighting conditions.
Workday Experiences. As a standard practice, we ask participants to report on their experiences during the session. In this case, we asked specific questions about the difficulty of the tasks, and open-ended questions about their beliefs concerning the nature of the study and factors that might have affected them during the day. These measures provide guidance concerning any expectancies that might have biased participants, and is a further check on the appropriateness of the tasks for the population. Finally, participants were asked to indicate their willingness to return for a second day of work like the one they had just completed, and their willingness to volunteer to complete additional questionnaires at home; the former measure has been shown to be sensitive to changes in lighting conditions [Baron et al., 1992].
Lighting Control Evaluation. We used a five-item scale that asked about the ease of use of the lighting controls, the speed of response of the system, and the ability of the system to create preferred conditions. This questionnaire was intended primarily for use as a manipulation check to ensure that the lighting control system was functioning as intended. Questions were: (1) The lighting control system allowed me to create the lighting conditions I wanted. (2) The lighting control system was easy to use. (3) The instructions on how to operate the lighting controls were adequate. (4) The interface for the lighting controls was easy to use. (5) When I used the lighting controls the lighting changed rapidly enough in response to my commands. All questions were answered on a 5-point scale from Strongly Disagree (coded 0) to Strongly Agree (coded 4).
2.6 Physical Measurements
During the experimental session we recorded illuminance at two fixed positions in each workstation using Minolta T-1 illuminance meters. The measurement points are shown in Figure 7; these positions were chosen as typical desktop and partition illuminance spot measurements. Readings were taken automatically every time a control action was taken by a participant, and were also triggered manually by the experimenter at the start of the day, and during breaks.
In addition, all control signals were recorded to a file in a manner that enabled us to recreate the various conditions after the session had been completed. This will allow us to do more detailed photometry, which will be detailed in a future report.
Desktop illuminance
Partition illuminance
Figure 7. Fixed photometric measurement points in Workstation A; two more illuminance sensors were placed at identical points in Workstation B.
3. RESULTS & DISCUSSION
As described in the Introduction, the experiment was designed to address several research questions:
1. Does providing task/partition lighting reduce ambient lighting use? 2. What are occupants’ preferred luminous conditions?
3. What is the effect of getting lighting control on mood, satisfaction, and task performance? 4. What is the effect of working under non-preferred lighting conditions on mood, satisfaction,
and task performance?
5. Is there an effect of lighting design, and is additional vertical luminance beneficial?
As stated above, in this initial report we will limit our analyses to questions 1, 2 (desktop illuminance and partition illuminance at a single representative point only), 3 (mood and satisfaction effects only), 4 (mood and satisfaction effects only), and 5 (mood and satisfaction effects only). Each of these questions is addressed with reference to the collected data in the sub-sections below.
As discussed in Section 2.6, we included questions designed to evaluate the performance of the lighting controls. These were primarily a manipulation check to ensure that the lighting control system was functioning as intended and did not, in their operation, hinder other experimental goals. The responses to these questions are shown graphically in Figure 8. It is clear that the control systems were considered easy to use and responsive. We considered that only Question 1 (‘The lighting control system allowed me to create the lighting conditions I wanted,) was appropriate for testing for differences between lighting designs; the analysis of variance (ANOVA) revealed no significant differences. -1 0 1 2 3 4 5 CONTEVAL(1) 0 10 20 30 40 50 60 70 C o u n t -1 0 1 2 3 4 5 CONTEVAL(2) 0 10 20 30 40 50 60 70 C o u n t -1 0 1 2 3 4 5 CONTEVAL(3) 0 10 20 30 40 50 60 70 C o u n t -1 0 1 2 3 4 5 CONTEVAL(4) 0 10 20 30 40 50 60 70 C o u n t -1 0 1 2 3 4 5 CONTEVAL(5) 0 10 20 30 40 50 60 70 C o u n t
3.1 Does providing task/partition lighting reduce ambient lighting use?
Our hypothesis was that adding a task light or a partition washer (providing local vertical luminance) to an ambient lighting system would reduce the amount of light demanded from the ambient system. Our experimental design allowed us to directly test this hypothesis by looking at lighting control behaviour from occupants in Design 1 vs. Designs 2 and 3. We compared the dimmer settings post-control for each of these lighting designs. We decided to look only at the final dimmer setting choices made by participants, as these represented the net choice made after the longest exposure to conditions and widest variety of tasks. The ambient lighting system in question was the dimmable overhead parabolic system; this was the only lighting source available in Design 1. Design 2 featured a dimmable partition washer in addition to the same dimmable parabolics available in Design 1. According to our hypothesis, the addition of the partition washer should reduce the ambient system dimmer settings relative to Design 1. Similarly, the addition of the desk lamp in Design 3 should reduce the ambient system dimmer settings relative to Design 1. Design 4 was not included in this analysis; it did include a task lamp but its ambient lighting system was different form the other designs and therefore there was no basis for comparison..
Figure 9 shows the mean dimmer setting for each circuit at the end of the experimental day, for each lighting design. We performed a between-subjects ANOVA on parabolic dimmer setting by lighting design, conducting two single degree-of-freedom contrasts: Design 1 vs. Design 2; and, Design 1 vs. Design 3. This analysis revealed no significant difference between dimmer setting for either contrast (F(1,114)=2.27; and F(1,114)=0.00, respectively). Therefore, we must reject our hypothesis. Although Figure 9 clearly shows that the partition washers were used to provide substantial light output (mean dimmer setting = 53%) in Design 2, and that the desk lamp was used by almost everyone in Design 3, their use did not displace the use of ambient lighting from ceiling-recessed parabolics.
Final Control
0 20 40 60 80 10 Parabolic Washer Desklamp Dir/IndirectLum
ina
ir
e
Ty
pe
% Max. Output
Design 4 Design 3 Design 2 Design 1 0Figure 9. Mean dimmer setting for each circuit at the end of the experimental day, for each lighting design. Note that for parabolic, partition washer, and suspended direct/indirect fixtures continuous dimming from 10-99% was available through on-screen controls. The Desk lamp was not dimmable,
and should have been on at full output at all times (nominal dimmer setting of 99%). The value of <99% for the mean Desk lamp output in Design 3 indicates 2 participants who contrived to turn the
3.2 What are occupants’ preferred desktop and partition illuminances?
Table 5 gives descriptive statistics for the illuminance measured at the two fixed points on the desktop and partition (see Figure 7) at the end of the day. It is clear that the average preference varies by lighting design, which is not surprising given the different lighting equipment available to deliver light to these two measurement points.
Table 5. Descriptive statistics for the illuminance measured at the two fixed points on the desktop and partition at the end of the day, for each lighting design.
Lighting Design Edesk 1 2 3 4 N 30 31 28 29 Minimum 33 97 188 116 Maximum 944 1081 1478 1442 Median 413 574 544 245 Mean 452 604 582 297 Standard Dev 241 251 278 249 Epart N 30 31 26 29 Minimum 13 24 33 58 Maximum 418 1117 414 200 Median 169 638 224 137 Mean 201 625 211 135 Standard Dev 112 299 102 46
In an attempt to elucidate preferences further, we used a technique previously described in Newsham & Veitch [2001], who proposed a novel method of deriving preferred luminous conditions from
experiments involving individual control. Following this method, we plotted the difference between the Edesk chosen by participants (we used the value at the single fixed point prevailing at the end of the session) and the initial Edesk vs. the initial Edesk. The plot, with each lighting design overlaid separately, in shown in Figure 10. The linear regressions through these points have a negative slope and cross the x-axis when the difference between the preferred desktop illuminance and the initial illuminance is zero. This point can be considered as the initial desktop illuminance for which no change in illuminance, post-control, is desired, or the preferred average illuminance for the group of participants. As expected, in general, participants who were initially exposed to lower illuminances chose higher illuminances when they had the choice (positive values on the y-axis), and vice versa. The linear regressions for Designs 1, 2 and 3 are significant (F(1,28) = 28.46; F(1,29) = 12.60; F(1,28)
= 19.86, respectively). The Design 4 regression is not significant, which is likely due to the extreme outlier (at (234,1209)), which is probably a case where the participant positioned the desk lamp head close to the desktop illuminance measurement point2. Design 1 is the most ‘conventional’ of the designs we looked at, and its regression line crosses the x-axis at 456 lx, which we consider the single best preferred desktop illuminance for the group. Encouragingly, this is in the range of IESNA recommendations for offices where most of the work is conducted on computers [ANSI/IESNA, 1993]. This value is also very similar to the simple mean of preferred desktop illuminances shown in Table 5. However, the benefit of the regression method is the extra information provided by the slope of the
2
Repeating the regression analysis for Design 4 with this outlier removed resulted in a significant linear trend (y = -1.332 + 330.948, F(1,26) = 14.77, r2 = 0.362).
regression line: the steeper the slope the larger the differences between participant choices and initial conditions, which implies a lower tolerance for non-preferred luminous conditions.
Compare the regression line for Design 1 with that for Design 3. The line for Design 3 almost exactly parallels that for Design 1, though it crosses the x-axis at the higher level of 576 lx. The additional 120 lx compared to the derived preferred illuminance from Design 1 is about double the illuminance contributed by the desk lamp (in its initial position) at the desktop illuminance measurement point. The Design 2 regression line differs in slope and x-axis intercept (650 lx) compared to Designs 1 and 3. The lower slope implies, on average, a greater participant tolerance of the variety of initial
conditions in Design 2.
This modifies the point in made in Section 3.1, that the addition of local light sources (desk light or partition washer) does not displace the use of ambient lighting from ceiling-based recessed parabolics. The regression lines in Figure 10 suggest that the addition of a task light (Design 3 vs. Design 1) does not affect the general preference for illumination from the ambient source, because the slopes of the regression lines are the same, just the intercept is different. However, the addition of a partition washer (Design 2 vs. Design 1) does affect the general preference for illumination. Perhaps this should not surprising, given the much larger effect on the luminous environment in the primary field of view of the partition washer vs. the desk lamp.
We then followed the same process of linear regression for the illuminance measured at the fixed point on the partition (Epart). The linear regressions for Designs 1, 3 and 4 are significant (F(1,28) = 26.34; F(1,24) = 20.72; F(1,27) = 39.69, respectively), and are shown in Figure 11. The Design 2 regression is not significant, which is interesting given that this was the design that afforded the greatest control over partition illuminance. It is clear that the majority of participants in Design 2 desired more light on the partitions than that provided at the start of the day, even for initial conditions that were already offering more partition illuminance than the other designs.
The regression lines for Design 1 and Design 3 are almost identical. The desk lamp in its initial position contributed very little illumination at the partition measurement point (~10 lx), and only a very unusual manipulation of the desk lamp arm would have produced a substantial effect. Both designs, then, use the parabolic system to affect partition illuminance, and it is therefore not surprising that the data from each design produces the same regression line. The line for Design 4 almost exactly parallels those for Designs 1 and 3, though it crosses the x-axis at a lower level.
The regression lines in Figure 11 reinforce the point that was made above, that the addition of a task light (Design 3 vs. Design 1) does not affect the general preference for illumination from the ambient source, because the regression lines are the same at a point in the room where the task light has little influence. However, the addition of a partition washer (Design 2 vs. Design 1) does affect the general preference for illumination.
Final Control
y = -1.071x + 488.284 R2 = 0.504 -900 -600 -300 0 300 600 900 0 200 400 600 800 1000Initial E
desk, lx
P
o
s
t C
o
n
tr
o
l
In
itia
l E
d esk, lx
Design 1 Design 2 Design 3 Design 4 Linear (Design 1) Linear (Design 2) Linear (Design 3) Linear (Design 4)Figure 10. Plot of the difference between the participant’s preferred desktop illuminance prevailing at the end of the session and the initial desktop illuminance vs. the initial desktop illuminance. Linear
regression fits to the data are shown for each lighting design.
y = -0.687x + 445.726 R2 = 0.303 y = -0.378x + 356.397 R2 = 0.016 y = -1.061x + 610.907 R2 = 0.433 y = -1.037x + 218.206 R2 = 0.463 y = -1.248x + 352.936 R2 = 0.095 y = -1.037x + 139.828 R2 = 0.595
Final Control
y = -1.058x + 214.410 R2 = 0.485 -900 -600 -300 0 300 600 900 0 100 200 300 400 500 600 700Initial E
part, lx
P
o
s
t C
o
n
tr
o
l
In
itia
l E
pa rt, lx
Design 1 Design 2 Design 3 Design 4 Linear (Design 1) Linear (Design 2) Linear (Design 3) Linear (Design 4)Figure 11. Plot of the difference between the participant’s preferred partition illuminance prevailing at the end of the session and the initial partition illuminance vs. the initial partition illuminance. Linear
3.3 What is the effect of getting lighting control on mood and satisfaction?
To answer this question we conducted a series of multivariate analyses of variance (MANOVAs) using the data from the various questionnaires. Outcomes were grouped into MANOVAs according to themes; though most were based on multiple outcomes from a single questionnaire, some did involve outcomes from two questionnaires. Following our common practice (and in order to avoid Type I statistical errors) we examined univariate effects only if the overall MANOVA was significant. Each MANOVA looked at between-subject lighting design effects, and within-subject time-of-day effects, and their interactions. The initial condition for each lighting design was also varied; this is an important experimental manipulation for some other analyses (see Sections 3.2 and 3.4), but we did not include it as a separate independent variable in these analyses.
For lighting design effects we conducted four single degree-of-freedom contrasts:
1. Design 1 vs. Design 2 (effect of adding the partition washer to ambient parabolics) 2. Design 1 vs. Design 3 (effect of adding the desk lamp to ambient parabolics)
3. Design 1 vs. Design 4 (comparison of typical office lighting to new PWGSC concept) 4. Design 3 vs. Design 4 (effect of ambient lighting design when both designs have a desk
lamp)
Note that we are testing more contrasts (4) than we have degrees of freedom (4 different designs means 4-1 d.f.); the fourth contrast above is not independent of the other three. This does increase the risk of familywise statistical error. Nevertheless, we felt the theoretical interest in the question justified this increased error risk.
With reference to Table 4, most outcomes were measured at three general times of day (am (T1), pm-before control was introduced (T2), and pm-after control was introduced (T3)). However, others were measured only twice (Environmental Competence at T1 and T3; Workplace Satisfaction at T2 and T3). In the former case we conducted tests on two single degree-of-freedom contrasts: T1 vs. T2 and T2 vs. T3; in the latter case the effect was for a single degree-of-freedom contrast only. Workday Experiences were polled at T3 only, and therefore its analysis involved no time of day effects. In the case of Visual and Physical Discomfort, responses were recorded at three times, but scores were heavily skewed towards the low end of the scale (few symptoms). Change scores provided a much better distribution, and so we tested for effects on (T2-T1) vs. (T3-T1). In most cases the tested outcomes were simple means of appropriate individual questionnaire items. Room Appraisal involved an additional step. The common practice is to perform Factor Analysis on the responses to the individual items to generate a small number of composite scales for analysis. Our factor analysis yielded five scales related to Pleasantness, Variability, Informalness, Illumination, and Size; outcomes were the means of the individual items that loaded on these scales. The details of this factor analysis are given in Appendix D.
Tables 6-10 summarize the results of the analyses where significant effects were found, and these effects are shown graphically in Figures 12-17; there were no significant effects for Environmental Competence or Workday Experiences outcomes. There were many significant effects related to time-of-day. By examining the pattern of results, and by comparing these results to similar results from other studies, we concluded that time-of-day effects are primarily attributable to the positive effect of receiving and utilizing lighting control, as described below.
It is well-established that in the absence of an intervention during a day that is designed to affect Mood, that Mood scores will generally become more negative over the course of an experimental day of this kind. We have observed this in other laboratory studies related to lighting [Veitch & Newsham, 1998; Veitch & Newsham, 2000a]. However, in this study both Dominance and Arousal are
significantly increased at T3 (post-control) compared to T2 (pre-control). Pleasure gets significantly worse over the pre-control period from T1 to T2. Although the introduction of control does not
produce a significant improvement at T3, the decline in Pleasure is arrested. The Dominance effect is a good manipulation check: we expected increased environmental control would be associated with a
feeling of increased dominance. Interestingly, the increase in Dominance is associated with the largest of the Mood effect sizes (proportion of variance explained, η2
partial = 0.12)
On ratings of Room Appraisal, we also observed that ratings of Pleasantness decline significantly over the pre-control period from T1 to T2. However, there is a significant improvement in
Pleasantness ratings post-control. This significant improvement in ratings at T3 compared to T2 is also seen for Variability, Informalness, and Illumination. Since it is lighting control that is provided, it is no surprise that the increase in Illumination rating is associated with one of the larger Room Appraisal effect sizes (η2
partial = 0.12).
We see results consistent with this observation on ratings of Lighting Preference. Ratings on the Lighting Satisfaction scale show a significant improvement at T3, after the introduction of lighting control, and this effect size is the largest of all the effects in our series of MANOVAs (η2
partial = 0.25).
Glare Dissatisfaction is also significantly lower post-control. The Glare effect is small; the space and lighting was designed to minimise glare, and the Glare Dissatisfaction ratings are generally very low at all times of the day. As a corollary, Lighting Satisfaction ratings were generally high, and skewed towards the positive end of the scale. Note that there was no change in these measures from T1 to T2, when the lighting conditions were constant.
A similar pattern of post-control improvements is observed for the Workplace Satisfaction scales. Ratings of Environmental Satisfaction, Self-assessed Productivity, and Session Satisfaction were all significantly higher at T3 compared to T2. These are all relatively large effects (η2
partial = 0.23, 0.21,
0.13, respectively); it is encouraging to note that lighting control increases not just satisfaction with lighting, but satisfaction at the higher level of the general environment and workplace.
Finally, we also see a significant improvement post-control for Visual Discomfort. These scores are prevalence and intensity of different aspects of discomfort, and so a low score means less
discomfort. Also remember that this analysis was done with change scores to improve normality of the analysed data set. The results show that, relative to the discomfort prevailing at T1, there is significantly less (self-reported) visual discomfort at T3 compared to T2 (η2
partial = 0.11). This is
important because it takes the positive effects of introducing lighting control beyond the improved mood and satisfaction to improvements in what might be termed (at least short-term) health effects. Only one set of outcomes, Room Appraisal, showed an effect of lighting design. This will be discussed in Section 3.5. We did not see any significant design x time-of-day interactions.
Table 6. Summary of the MANOVAs on Mood.
MOOD Time of Day
T1 T2 T3 Pleasure M (s.d.) 4.62 (1.34) 4.32 (1.31) 4.49 (1.33) univariate effect η2 F(1,114) = 5.98; partial = 0.050; p < 0.05 Dominance M (s.d.) 3.14 (1.04) 3.21 (1.02) 3.44 (1.14) univariate effect η2 F(1,114) = 10.09; partial = 0.121; p < 0.01 Arousal M (s.d.) 3.66 (0.91) 3.55 (0.90) 3.84 (1.02) univariate effect η2 F(1,114) = 6.84; partial = 0.057; p = 0.01 MANOVA Wilks’ Λ = 0.917; η2 partial(ave) = 0.026; F(3,112) = 3.38; p < 0.05 Wilks’ Λ = 0.870; η2 partial(ave) = 0.068; F(3,112) = 5.56; p < 0.01
Table 7(a). Summary of the MANOVAs on Room Appraisal; time of day effects.
ROOMAPP Time of Day
T1 T2 T3 Pleasantness M (s.d.) 55.5 (12.9) 52.0 (13.5) 55.5 (13.5) univariate effect η2 F(1,114) = 12.93; partial = 0.102; p < 0.01 F(1,114) = 18.20; η2 partial = 0.138; p < 0.01 Variability M (s.d.) 26.9 (13.6) 28.2 (11.9) 31.0 (14.0) univariate effect η2 F(1,114) = 11.39; partial = 0.091; p < 0.01 Informalness M (s.d.) 45.8 (14.4) 46.8 (16.3) 48.8 (14.6) univariate effect η2 F(1,114) = 4.13; partial = 0.035; p < 0.05 IlluminationM (s.d.) 53.6 (14.7) 52.9 (13.5) 58.1 (11.6) univariate effect η2 F(1,114) = 15.35; partial = 0.119; p < 0.01 Size M (s.d.) 62.0 (13.4) 62.0 (14.5) 63.0 (16.7) univariate effect MANOVA Wilks’ Λ = 0.822; η2 partial(ave) = 0.026; F(5,110) = 4.77; p < 0.01 Wilks’ Λ = 0.805; η2 partial(ave) = 0.079; F(5,110) = 5.34; p < 0.01
Table 7(b). Summary of the MANOVAs on Room Appraisal; lighting design effects.
ROOMAPP Lighting Design
1 2 3 4 Pleasantness M (s.d.) (13.3) 53.1 (12.7) 54.5 (13.9) 53.2 (13.7) 56.5 univariate effect Variability M (s.d.) (14.5) 26.6 (11.8) 30.6 (13.3) 28.6 (13.5) 28.9 univariate effect Informalness M (s.d.) (16.7) 52.3 (13.6) 46.1 (13.6) 46.3 (15.3) 43.8
univariate effect F(1,114) = 6.00; η2 partial = 0.050; p < 0.05
IlluminationM (s.d.) (14.0) 58.3 (11.0) 55.3 (14.8) 53.5 (13.4) 52.1
univariate effect F(1,114) = 5.73; η2 partial = 0.048; p < 0.05
Size M (s.d.) (15.8) 61.9 (14.2) 58.9 (14.1) 62.1 (14.5) 66.8 univariate effect MANOVA Wilks’ Λ = 0.824; η 2 partial(ave) = 0.026; F(5,110) = 4.71; p < 0.01
Table 8. Summary of the MANOVAs on Lighting Preference.
LIGHTPREF Time of Day
T1 T2 T3 LightSat M (s.d.) 2.63 (0.85) 2.67 (0.88) 3.16 (0.65) univariate effect η2 F(1,111) = 36.83; partial = 0.249; p < 0.01 GlareDissat M (s.d.) 0.98 (1.00) 0.90 (0.98) 0.80 (0.95) univariate effect η2 F(1,111) = 4.29; partial = 0.037; p < 0.05 MANOVA Wilks’ Λ = 0.746; η2 partial(ave) = 0.143; F(2,110) = 18.71; p < 0.01
Table 9. Summary of the MANOVAs on Workplace Satisfaction.
WORKPLSAT Time of Day
T2 T3 EnvSat M (s.d.) 2.58 (0.81) 2.83 (0.70) univariate effect η2 F(1,111) = 33.69; partial = 0.233; p < 0.01 SelfProd M (s.d.) 4.7 (18.5) 11.5 (14.9) univariate effect η2 F(1,111) = 28.92; partial = 0.207; p < 0.01 SessionSat M (s.d.) 2.60 (0.56) 2.76 (0.55) univariate effect η2 F(1,111) = 16.40; partial = 0.129; p < 0.01 MANOVA Wilks’ Λ = 0.657; η2 partial(ave) = 0.190; F(3,109) = 18.93; p < 0.01
Table 10. Summary of the MANOVAs on Visual and Physical Discomfort. Note the outcome measure tested was the change score at T2 and T3 compared to T1.
DISCOMFORT Time of Day
T1 T2 T3 VislDisc M (s.d.) 2.15 (2.35) 4.17 (3.98) 3.27 (3.81) univariate effect η2 F(1,114) = 13.70; partial = 0.107; p < 0.01 PhysDisc M (s.d.) 1.95 (2.45) 3.69 (3.05) 3.42 (3.17) univariate effect MANOVA Wilks’ Λ = 0.891; η2 partial(ave) = 0.061; F(2,113) = 6.94; p < 0.01
0 1 2 3 4 5 6 7 8 T1 T2 T3 Time of Day M ean R at in g Pleasure Dominance Arousal
Figure 12. The effect of time-of-day on Mood. T1=am,T2=pm-before control was introduced, and T3=pm-after control was introduced. Note, solid lines indicate statistically significant contrasts.
0 20 40 60 80 100 T1 T2 T3 Time of Day M ean R at in g Pleasantness Variability Informalness Illumination 0 20 40 60 80 100 1 4 Lighting Design M ean R at in g Informalness Illumination
Figure 13. The effect of time-of-day on Room Appraisal. T1=am,T2=pm-before control was
introduced, and T3=pm-after control was introduced. Note, solid lines indicate
statistically significant contrasts.
Figure 14. The effect of lighting design on Room Appraisal. Note, only statistically
0 1 2 3 4 T1 T2 T3 Time of Day M ean R at in g Lighting Satisfaction Glare Dissatisfaction 0 1 2 3 4 T1 T2 T3 Time of Day M ean R at in g ( S at .) -40 -30 -20 -10 0 10 20 30 40 M e a n R a ti ng ( P ro d.) Environmental Sat. Session Sat. Self-assess. Productivity
Figure 15. The effect of time-of-day on Lighting Preferences. T1=am,T2=pm-before
control was introduced, and T3=pm-after control was introduced. Note, solid lines indicate statistically significant contrasts.
Figure 16. The effect of time-of-day on Workplace Satisfaction. T2=pm-before control was introduced, and T3=pm-after control was introduced (this measure not tested at T1). Note,
solid lines indicate statistically significant contrasts. -10 -8 -6 -4 -2 0 2 4 6 8 10 cT12 cT13 Time of Day C h an g e i n M ean R at in g Visual Discomfort Physical Discomfort
Figure 17. The effect of time-of-day on Discomfort. T1=am,T2=pm-before control was introduced, and T3=pm-after control was introduced. We analysed change scores relative to T1, therefore cT12
means discomfort score at T2 - discomfort score at T1, and so on; the more negative the score the worse discomfort was compared to T1. Note, solid lines indicate statistically significant contrasts.