at this is an aut hor-pr oduc ed PDF of an article a cce pted for publ icatio n foll owin g pe er revi ew. T he defin iti v e pu b lish e r-a uthentic ated ve rsion is av ail a b le on the pub lis her W eb site Environmental Pollution
November 2008, Volume 156, Issue 1, Pages 123-135 http://dx.doi.org/10.1016/j.envpol.2007.12.019
© 2008 Elsevier Ltd All rights reserved.
Archimer Archive Institutionnelle de l’Ifremer
http://www.ifremer.fr/docelec/
PCDD/F and PCB multi-media ambient concentrations, congener patterns and occurrence in a Mediterranean coastal lagoon (Etang de
Thau, France)
J. Castro-Jiméneza, *, G. Devillera, M. Ghiania, R. Loosa, G. Mariania, H. Skejoa, G. Umlaufa, J.
Wollgasta, T. Laugierb, K. Héas-Moisanc, F. Léautéc, C. Munschyc, C. Tixierc and J.
Tronczyńskic
a
European Commission-DG Joint Research Centre, Institute for Environment and Sustainability(IES), TP 290, Via Enrico Fermi, 1. 21020 Ispra (VA), Italy
b
Ifremer, Laboratory of Environmental Resources, Bd Jean Monnet, BP 171, 34203 Sète Cedex, France
c
Ifremer, Laboratory of Biogeochemistry of Organic Contaminants, BP 21105, 44311 Nantes Cedex 3, France
*: Corresponding author : J. Castro-Jiménez, Tel.: +39 0332 786070; fax: +39 0332 786351, email address : javier.castro-jimenez@jrc.it
Abstract:
Ambient concentrations, congener patterns and multi-media distribution of PCDD/Fs and PCBs were determined in air, water, sediment and mussels in a semi-enclosed marine ecosystem (Thau lagoon, France). ∑2,3,7,8-PCDD/F and ∑7ICES PCB air concentrations (0.2–1.4 and 31–57 pg m−3, respectively) were typical of rural areas. Concentrations in the water column were very low for PCDD/Fs (163–476 fg L−1) and low for PCBs (138–708 pg L−1). PCDD/F and PCB concentrations found in surface sediment (0.15–1.6 and 2.5–33 ng g−1 d.w., respectively) and mussel (13–21 pg g−1 d.w. and 10–39 ng g−1 d.w., respectively) were medium levels. PCDD/F congener patterns observed in air, water particulate phase and sediments were similar suggesting direct coupling among these compartments and atmospheric inputs of PCDD/Fs into the lagoon. Conversely, for the same set of samples, similar patterns were not observed for PCBs in the mentioned compartments.
Multi-media ambient concentrations and distribution of PCDD/Fs and PCBs in Thau Lagoon provide insight into the POPs behavior in semi-enclosed marine ecosystems.
at this is an aut hor-pr oduc ed PDF of an article a cce pted for publ icatio n foll owin g pe er revi ew. T he defin iti v e pu b lish e r-a uthentic ated ve rsion is av ail a b le on the pub lis her W eb site 1. Introduction
Persistent organic pollutants (POPs) enter the environment primarily or exclusively as a result of anthropogenic activities. Polychlorinated dibenzo-p-dioxins and dibenzofurans (PCDD/Fs) and polychlorinated biphenyls (PCBs) are two important families of POPs. These chemicals bioaccumulate and are considered as potent toxicants capable of producing a wide spectrum of adverse health effects in biota and humans ([Safe, 1984] and [Safe, 1990]). PCDD/Fs occur as unintentional byproducts of chemical manufacturing and incineration processes ([Harrad and Jones, 1992] and [Bruzy and Hites, 1996]) whereas current sources of PCBs are landfills, open burning of products containing PCBs, waste incineration, accidental fires and revolatilization from formerly exposed soils (Cousins and
Jones, 1998; Breivik et al., 2002). PCBs were mainly used by the power industry in 1
electrical transformers, capacitors, hydraulic equipment, and as lubricants. 2
3
PCDD/Fs and PCBs enter the aquatic systems by atmospheric deposition, direct and 4
indirect discharges, and riverine inputs. A low aqueous solubility and vapor pressure, and 5
resistance to extensive chemical and biological transformation characterize these 6
compounds. Their general hydrophobic nature results in high partition coefficients to 7
abiotic and especially biotic particles. PCDD/Fs and PCBs exist in the atmosphere as gases 8
and bound to particles, being temperature an important variable affecting this partition 9
(Schwarzenbach et al. 2003). Once delivered to the water column, the primary removal 10
processes are sedimentation of atmospheric particles and partitioning of the 11
gaseous/dissolved phase contaminants into organic carbon (OC)-rich particles with 12
subsequent settling and accumulation in surface sediments, where contaminant and particle 13
burial is slowed by resuspension and mixing of surface sediments by aquatic organisms. 14
15
Coastal lagoons represent less than 1% of the surface covered by oceans and seas, however 16
they are characterized by a high biodiversity and intense primary production leading to both 17
ecological and economical considerable importance (Nixon, 1982). Such is the case of 18
Thau lagoon, one of the largest Mediterranean lagoons. Located on the French 19
Mediterranean coast along the Gulf of Lion (Figure 1), it covers a surface of 75 km2 with an 20
average depth of 4.5 m and is isolated from the Mediterranean Sea by an offshore bar. The 21
lagoon is connected to the sea North-East by the channel of Sète (90% of the exchanges) 22
and South-West by the channel de Pisse-Saumes (10% of exchanges). Winds are often 23
strong in the area with an average of 118.5 days per year above Beaufort force 5 (data from 1
Météo France), in particular when blowing from North-West (Tramontane). Wind has been 2
described as an important variable influencing the lagoon hydrodynamics (Lazure, 1992). 3
There is an intensive shell farming activity (oysters and mussels) that covers about 20% of 4
the whole lagoon area and yearly produces about 15000 tons of oysters. (Gangnery et al., 5
2001). 6
Thau lagoon seems to be under intense anthropogenic pressure (urban, industrial, 7
agricultural and shell farming activities). The biggest town (Sète) and most of urban 8
activities are located in the Eastern part of the lagoon. A considerable increase of 9
population in the area during the summer months is contributing to the anthropogenic 10
impact. The results of the French Monitoring Network (RNO Réseau National 11
d’Observation) show high contamination of the lagoon sediments by hydrophobic organic 12
compounds compared to other Mediterranean lagoons, especially by polycyclic aromatic 13
hydrocarbons (PAHs) and to a lesser extent by PCBs (Tronczyński, 1998; Leauté et al. 14
2007). However, no information on PCDD/Fs ambient levels in Thau lagoon is available 15
yet. A better knowledge of the fate and dynamics of POPs in this semi-enclosed marine 16
ecosystem is needed in order to apprehend their long-term impacts. The main objectives of 17
this work were: (1) to obtain ambient concentrations, congener patterns and multi-media 18
distribution of PCBs and PCDD/Fs in air, water column, mussel and surface sediment from 19
Thau Lagoon; (2) to generate a data set on multi-media ambient concentrations that serves 20
as a first step for POPs fate modeling validation and future risk assessment in this 21
ecosystem. In addition, some specific aspects regarding the atmospheric input of the 22
pollutants studied will be discussed. 23
Materials and methods
1
Sampling 2
Locations of all sampling sites are detailed in Figure 1. Air samples were collected in 3
November 2005 by using high volume samplers at two sites: Ifremer Institute (IF) located 4
on the South shore and Bouzigues (BZ), a small village on the North shore of the lagoon. 5
Air particle phase was retained by using a 102 mm diameter quartz fibre filter (QFF) 6
whereas the gas phase was trapped with a polyurethane foam (PUF) plug of 65 mm 7
diameter, 50 mm length and a raw density of 30 kg m-3. Volumes of ~ 400 m3 were 8
collected for each sample (5 samples at IF and 4 at BZ) except for the last one taken at IF 9
site where a volume of ~ 200 m3 was sampled. 10
Lagoon water was sampled from a boat also in November 2005 by using pre-equilibrated 11
Teflon tubing and a Teflon membrane pump (ASTI, France) operated with compressed 12
nitrogen. The sample was collected in stainless steal (StS) containers. Four samples (~ 13
120L) were taken from the lagoon (T12, T11, C4 and T2) and an additional sample (~ 80L) 14
was also collected at the riverine reference station (outlet of the river Véne, RV) (Figure 1). 15
Once in the laboratory samples were filtered (GFF). The filtrated water was collected in 16
clean StS containers and PCDD/F and PCB 13C-labeled internal standard mixtures were 17
added. Filtrates were then passed through a pre-cleaned (MiliQ-UV and sequential soxhlet 18
extraction with methanol, acetonitrile and dichloromethane, 8h each) and pre-conditioned 19
(methanol) 50g AmberliteTM XAD-2 Teflon column at a flow ≤ 80 mL/min (Tronczyński et
20
al., 2004, 2005a). The water sample was sucked using a peristaltic pump. Columns were 21
dried by passing air using a vacuum pump. Elution of XAD-2 columns was performed with 22
dichloromethane. Na2SO4 anhydrous (baked at 450 °C / 8h) was added, the samples were
1
placed in the freezer for transport and then stored until further processing at the laboratory. 2
3
Both surface sediments and mussels were collected in May 2004. Surface sediment samples 4
were collected by divers at three sites along the lagoon (West, medium and East areas of 5
the lagoon) using Teflon sediment corers. The results presented in this study were obtained 6
from the analysis of the first centimeter of the sediment core. Before analysis, sediments 7
were homogenized, freeze-dried and sieved (<2mm) (Tronczyński et al., 2005b). 8
A minimum of 50 mussels (Mytilus galloprovincialis) of homogeneous size were collected 9
by hand from each of the three shellfish areas along the lagoon (Figure 1) and depurated in 10
decanted water from the site for 24 h. The mussels were further shucked, homogenized and 11
stored at –20°C before freeze-drying. Both freeze-dried sediment and mussel samples were 12
stored in the dark at room temperature until analysis (Munschy et al., 2005a). 13
14
Analytical determinations 15
PCDD/Fs considered in this work were the 2,3,7,8 congeners since they have been 16
described as the most toxic ones (Van den Berg et al., 1998), whereas PCBs were 28, 52, 17
101, 118, 153, 138 and 180 congeners also referred in the text as the 7 ICES (International 18
Council for the Exploration of the Sea). Air and water samples were analyzed at the Joint 19
Research Centre laboratories whereas sediment and mussels sample analyses were carried 20
out at Ifremer laboratories. 21
22 23
Air and water samples 1
QFFs and PUFs were Soxhlet extracted separately with n-hexane/acetone (220:30 v/v) for 2
48 h after being spiked with internal standards (16 13C-labelled 2,3,7,8-chlorine-substituted 3
congeners with 400 pg each, except OCDD with 800 pg). Extract purification was executed 4
with an automated clean-up system (Power-Prep P6, from Fluid Management Systems, 5
Inc., Watertown, MA, USA). The purification method was previously described by Abad et 6
al. (2000). Prior to injection, syringe 13C-labelled standards were added to the extracts to 7
determine the recoveries of the internal standards. 8
Regarding water samples, dichloromethane extracts were filtered with pre-cleaned glass 9
wool, concentrated, treated with concentrated H2SO4 and cleaned up as indicated for air
10
samples. GFF were thawed, cut into small pieces and transferred into 33mL ASE 11
(Dionex) cartridges. 13C-labelled PCDD/F and PCBs internal standard mixtures were 12
added. The filters were extracted using the Dionex ASE 300 applying in a 1st extraction 13
methanol (3 cycles each with a static time of 5 min at 75 °C, heat-up time of 5 min, a flush 14
volume of 100%, a purging time of 60s and a pressure of 1500 psi) and in a 2nd extraction 15
hexane (same parameters as for methanol), respectively. The methanol and hexane phases 16
were combined in a separatory funnel. The methanol phase was extracted three more times 17
with ~ 20 mL of hexane and all hexane phases were combined and concentrated to 10 mL. 18
From this point on samples were treated as indicated above for the XAD extracts. 19
Quantification of PCDD/Fs and PCBs was based on isotope dilution using a high resolution 20
gas chromatography – high resolution mass spectrometry (HRGC-HRMS). The method has 21
been previously described (Castro-Jiménez et al., 2008). 22
Mussels and sediment samples 1
The analytical protocols for extraction, cleanup and analysis have been previously 2
described (Munschy et al., 2005a, 2005b; Tronczyński et al., 2005b; Johansson et al., 3
2006). Briefly, approximately 5 g (dry weight, d.w.) of mussel sample or 7 g d.w. of 4
sediment were extracted by pressurised solvent extraction (ASE, Dionex Corp., CA) with 5
dichloromethane. For mussel samples, the separation of co-extracted lipids was performed 6
by gel permeation chromatography (GPC). The purified mussel and sediment extracts were 7
concentrated and then further purified and fractionated on a two layer silica/alumina 8
column. Quantification of PCDD/Fs was performed by isotopic dilution using HRGC-9
HRMS whereas PCBs were analysed by HRGC fitted with two electron capture detectors 10
using two columns. 11
12
Quality assurance/Quality control 13
QFF were baked at 450 ºC for 6 h whereas PUFs were soxhlet extracted during at least 24 h 14
with acetone and then dried in a dissicator under vacuum before use. Both cleaned QFF and 15
PUF were wrapped in n-hexane rinsed aluminum foil and placed in a Teflon sealed metallic 16
transport container. Transport (clean filters and PUFs), field, and procedural blanks were 17
collected and processed together with the samples. Field and transport blank values were 18
below the limits of detection (LODs) or at least three times lower than the analyte value for 19
all compound studied, except for PCB-118 that exceeded this QA/QC threshold in some of 20
the air samples. A breakthrough test was performed by placing a smaller PUF plug in series 21
separated ~1 cm from the main PUF in the sampling head. Breakthrough rates for PCDD/Fs 22
were not possible to be calculated due to the fact that the concentrations found in the gas 23
phase (PUFs) both for the sample and the breakthrough PUFs were under the LOD (1 fg m -1
3
) whereas the breakthrough rate for ∑PCB in the condition of the sampling period was 2
estimated to be less than 10%. Extraction blanks (QFF and PUFs) were processed for each 3
batch of samples. 4
Regarding water samples, extraction and clean-up analytical blanks were carried out to 5
check background levels. PCDD/F and PCB recoveries for the air gas and particular phases 6
(PUFs and QFF) and for the water particulate phase (GFF) were in compliance with the 7
specifications of EPA 1613 and EPA 1668 methods, respectively (U.S. EPA., 1994, 1999). 8
However, PCDD/Fs recoveries in the water dissolved phase (XAD) were very low not 9
allowing quality congener quantifications except for the river water sample (RV) where 10
recoveries were sufficient to calculate a LOD. Therefore, PCDD/Fs dissolved water phase 11
concentrations were not taken into account in the present work except for the RV sample. 12
LOD for PCDD/Fs in water samples varied from 1-5 fg l-1. 13
PCB recoveries in the dissolved phase were also low ranging from 16 – 53% except in only 14
one sample (T2) where HxCB and HpCB internal standards were less than 10%. Even if the 15
signal to noise ratio and the low blank levels found in all samples were enough to allow 16
quality quantification of the studied PCB congeners, a limited used of those data was 17
decided being mainly relegated to generation of congener fingerprints (relative
18
composition) in the dissolved water phase and subsequent discussion. Total concentrations 19
(dissolved + particulate phase) were only considered to compare levels with literature. 20
In order to calculate PCB recoveries in mussel and sediment samples, recovery surrogates 21
(CB 30, CB 198, CB 209, TCN) were added to each sample before extraction and were 22
used to control the recovery efficiency of the overall process. However, results were not 23
corrected for recoveries (Johansson et al., 2006). In our laboratory, the average recoveries 1
of internal standards in biota are: CB30 78%, TCN 80%, CB198 97% and CB209 98% 2
(n=65) and in sediments are: CB30 81%, TCN 84%, CB198 80% and CB209 78% (n=25). 3
For PCDD/Fs, 13C labelled congeners were added before extraction and calculations were 4
made by isotopic dilution method (Munschy et al., 2005b). Blanks and certified material 5
analyses were included within every batch of six to eight samples. The laboratory routinely 6
participates in the QUASIMEME (Quality Assurance of Information for Marine 7
Environmental Monitoring in Europe) intercomparison exercises for all analysed 8 contaminants. 9 10 Materials 11
TE-1000BL PUF high volume samplers were employed (Tisch Environmental, Inc. USA). 12
PUF plugs were obtained from Klaus Ziemer GmbH (Langerwehe, Germany), QFF (QMA-13
4 type) and GFF were from Whatman International Ltd (Brentford, Middlesex, UK). 14
AmberliteTM XAD-2 was from Supelco (Bellefonte, Pennsylvania, USA). Teflon columns
15
used for water sampling were SeaStar Ltd type (37 cm length x 19 mm i.d.). All organic 16
solvents were dioxin analysis grade from Sigma-Aldrich (Buchs SG, Switzerland). All 17
gases (Alpha gaz, Italy) used were ultra pure grade suitable for PCDD/Fs analysis. Pre-18
packed multi-layer silica, basic alumina, and carbon columns were obtained from Fluid 19
Management Systems (FMS) Inc. (Watertown, MA, USA). The standard mixture of native 20
7 ICES PCB used was PCB mix3 (Dr. Ehrenstorfer GmgH, Augsburg, Germany) and for 21
13
C-labelled congeners, 68-LCS from Wellington Laboratories (Guelph, Ontario, Canada). 22
EPA-1613CVS, EPA1613LCS+MDF-12346789 and EPA-1613ISS were native, 13
labelled internal and recovery standards, respectively for 17 PCDD/Fs also obtained from 1
Wellington Laboratories. 2
3
Results and discussion
4 5
Results on PCDD/Fs and PCBs in the studied matrixes from Thau lagoon are presented in 6
Tables 1 and 2, respectively whereas values extracted from the literature for comparison are 7
compiled in TS1 and TS2 in supporting information. 8 9 Ambient concentrations 10 Air 11
2,3,7,8-PCDD/Fs air concentrations (particle + gas phase) at IF site ranged from 0.3 to 1.4 12
pg m-3 (16 to 26 WHO-TEQ fg m-3) whereas for BZ site varied from 0.2 to 0.8 pg m-3 (7 to 13
23 WHO-TEQ fg m-3). PCDD/Fs were almost exclusively found to be associated to the air
14
particulate phase. Concentrations observed at both locations were low, typical of those 15
reported for rural areas in Europe, and North America (Lohmann and Jones, 1998; Cleverly 16
et al., 2007). Values found in other aquatic environments such as the Lake Maggiore 17
(located in a semi-rural area) in Northern Italy and from rural areas in Catalonia (Spain) are 18
also within the same range (Abad et al., 2004; Castro-Jiménez et al., 2005, 2008) (Table S1, 19
supporting information). 20
21
∑PCBs air concentrations reported in this study does not include the congener 118 (see 22
QA/QC section). ∑PCB air concentrations (particulate + gas phase) found at IF site ranged 23
from 31 to 48 pg m-3 whereas in site BZ varied from 31 to 57 pg m-3 (Table 2). PCBs were 1
predominately in the gas phase. This fact has been previously reported (Mandalakis et al., 2
2002; Totten et al., 2004; Hornbuckle et al., 2006). Concentrations within the same order of 3
magnitude were found in Venice lagoon, in air masses coming from the sea, in Lake 4
Maggiore and in a background/rural site in Crete, Greece (Mandalakis et al., 2001; 5
Gambaro et al., 2004; Manodori et al., 2006; Vives et al., 2007) (Table S2 supporting 6
information). 7
8
PCDD/Fs and PCBs concentrations at both sampling sites were within the same order of 9
magnitude, indicating a homogeneous situation at both shores of the lagoon along the 10
North-South axis. Indeed a Student’s t test (α=0.05) confirmed that there were no 11
significant differences between the two sites for the air concentrations of PCDD/Fs 12
(P=0.33) and PCBs (P=0.79). 13
14
Meteorological variables influence 15
The weather conditions during the sampling week, where precipitation (on 14th and 15th 16
November) and wind peaks up to 9 m s-1 were registered (Météo France, station from Sète), 17
might have favored the low concentrations found in the area, specifically for some days. 18
Higher wind speeds are associated with greater height of the mixed boundary layer (more 19
turbulent sampling conditions) and therefore an effect of pollutant dilution may occur under 20
these conditions (Lohmann et al., 1999; 2003). Wind blew predominantly from North/West 21
(NW) during the sampling period except for a short gap (in the beginning and the end of the 22
period) where it blew from North-North/East (N-NE) (Figure 2). 23
Principal components analysis (PCA) was applied to identify the main relationships among 1
meteorological variables and ∑PCDD/Fs and ∑PCBs air concentrations. As measurement 2
units of the different variables studied were not homogeneous, the principal components 3
were extracted from the correlation matrix (Legendre and Legendre, 1998). The first two 4
principal components explained 67 % of the total variance (PC1=49%; PC2=18%). The 5
main relationships among variables are shown in the factor loading plot (Figure 3). 6
PCDD/Fs air concentrations were not correlated with local atmospheric conditions whereas 7
PCBs air concentrations during the sampling week were clearly linked to air temperature, 8
humidity and nebulosity (Figure 3). This observation is in agreement to other results 9
reported in the literature where air temperature has been identified as an important variable 10
affecting PCB atmospheric concentrations (Wania et al., 1998; Simcik et al., 1999; Currado 11
and Harrad, 2000). 12
Although not statistically relevant, the wind speed seemed to have an influence on the 13
pollutant concentrations in air. Thus, the lowest PCDD/Fs and PCBs concentration at IF 14
and BZ sites were found in general during the intervals of higher wind speeds, especially 15
for IF site (Figure 2 and Table 1). However, in spite of some wind peaks observed the 16
average wind speed during the sampling period was ~ 5 m s-1. Harrad and Mao (2004) 17
reported that PCB air concentrations were negatively correlated to wind speed only when 18
wind speeds were higher than 4.4 m s-1. This value is very close to the one observed in 19
Thau lagoon and the phenomenon described may explain our observations. 20
21 22 23
Water 1
Concentrations were reported only for the particulate phase except for the RV sample (see 2
QA/QC section) where total concentration (dissolved + particulate) is reported. 2,3,7,8-3
PCDD/Fs concentrations in the water column from Thau Lagoon (Table 1) varied from 163 4
to 476 fg l-1 (4 to 9 WHO-TEQ fg l-1). PCDD/Fs measured in RV were predominantly 5
found in the particulate phase and exhibited a concentration of 2770 fg l-1 (53 WHO-TEQ 6
fg l-1). The higher concentration observed in RV can be explained by the higher suspended 7
particulate mater (SPM) load in the waters from the river than in the lagoon waters. In fact, 8
when normalizing the PCDD/F concentration by the SPM content, concentrations of 247 9
and 223 pg g-1 d.w. were obtained for RV and T12, respectively. Lower values were 10
obtained in the central and western parts of the lagoon (89, 82 and 52 pg g-1 d.w. at T11, C4 11
and T2, respectively). 12
Few data are available in the literature on PCDD/Fs measurements in water. For instance, 13
levels found in Thau lagoon were lower than those reported for various aquatic systems 14
such as, non anthropogenic impacted Japanese coastal areas, the central part of Venice 15
Lagoon, Italy or the Raritan Bay/Hudson River Estuary, USA (Hashimoto et al., 1995; 16
Lohmann et al., 2000; Dalla Valle et al., 2003) (Table S1, supporting information). 17
18
∑7 ICES PCBs (dissolved + particulate phase) concentrations determined in the water 19
column from Thau Lagoon ranged from 138 to 708 pg l-1, whereas a value of 390 pg l-1 was 20
found in the RV sample (Table 2). PCBs were found predominantly associated to the 21
dissolved water phase, especially the lower congeners (80 – 95%). This fact has already 22
been described in the literature for other aquatic systems (Zeng et al., 2002; Maldonado and 1
Bayona, 2002). 2
Concentrations within the same order of magnitude were found for a larger set of PCB 3
congeners in the waters of San Diego Bay, California (Zeng et al., 2002) and in Lake 4
Michigan, in USA (Pearson et al., 1996). Much higher concentrations were found for the 7 5
ICES PCBs in the Daya Bay, a semi-enclosed and anthropogenic impacted bay located in 6
Southern China, (Zhou et al., 2001). Lower PCB concentrations have been reported for 7
other coastal areas or open seas such as, the Black and Baltic seas (Bruhn and McLachlan, 8
2002; Maldonado and Bayona, 2002; Wodarg et al., 2004) (Table S2, supporting 9 information). 10 11 Sediments 12
Results on PCDD/Fs were available for sediments at sampling sites T10 and T12 where 13
concentrations of 150 pg g-1d.w.(3 WHO-TEQ pg g-1 d.w.) and 1660 pg g-1d.w.(14 WHO-14
TEQ pg g-1 d.w.) for the sum of the 17 congeners were found, respectively. This higher 15
concentration observed at the Eastern part can not be attributed to a higher sediment 16
organic carbon (OC) content at T12, since values were 4.2% at T12 site, and 5.1% at T10. 17
18
PCDD/F sediment concentrations within the same order of magnitude were measured in 19
fresh water locations in the UK, where the main sources of PCDD/Fs were thought to be 20
atmospheric (Rose and McKay, 1996). Levels reported for Lake Maggiore sediments where 21
atmospheric inputs have also been identified as major source of PCDD/Fs to the lake were 22
as well within the same order of magnitude (Castro-Jiménez et al., 2005, 2008). Higher 23
PCDD/F levels were reported for an impacted estuarine system (Houston ship Channel, 1
USA) or for sediments from industrially influenced coastal areas in Southern and Easter 2
Spain (Eljarrat et al., 2005; Suarez et al., 2006). Comparing to another coastal lagoon, 3
levels at T12 were slightly higher than PCDD/F concentrations found in sediments from 4
different parts of Venice Lagoon, except for the industrial channels where a much higher 5
concentration was reported (Dalla Valle et al., 2003) (Table S1, supporting information). 6
∑PCB concentrations in sediments from the lagoon ranged from 2.5 to 33 ng g-1 d.w. 7
(Table 2). Lower values were measured at the western (T3) and middle (T10) part of the 8
lagoon (Figure 1) whereas the highest concentration was found at the eastern part (T12) as 9
occurred with PCDD/Fs. Again, the spatial variability observed for the contaminant 10
concentrations could not be solely attributed to different sediment OC contents (9.2, 5.1, 11
and 4.2 % at T3, T10 and T12, respectively). 12
PCB concentrations in Thau were comparable with values reported in the literature for 13
various fresh and coastal water ecosystems (Table S2, supporting information) such as, 14
various Mediterranean coastal lagoons, the Lake Maggiore, the Daya Bay, the Lake Taihu 15
(China) and the Quingdao coastal sea also located in China (Moret et al., 2001; Zhou et al., 16
2001; Zhang and Jiang, 2005; Gómez-Gutiérrez et al., 2007; Pan et al., 2007; Vives et al., 17 2007). 18 19 Mussels 20
2,3,7,8-PCDD/F concentrations ranging from 13 to 21 pg g-1 d.w. (0.7 to 1 WHO-TEQ pg
21
g-1 d.w.) were found for the analyzed mussels in the lagoon. The highest value was 22
observed in the western part of the lagoon (M1) although only a slight difference in the 23
reported for the English Channel and the Atlantic French coast (Vilaine river bay) are in the 1
same range (Munschy et al., 2005b). The observed values in Thau lagoon were below the 2
threshold of 4 WHO-TEQ pg g-1 w.w. (wet weight) set by the European Commission for 3
fishery products for human consumption (European Commission, 2006). 4
Data on PCDD/Fs in shellfish are quite numerous. However, different ways of data 5
reporting and different studied species make data comparison difficult. Moreover, results 6
are rarely associated with the sampling period, despite a significant influence of shellfish 7
sexual maturity (spawning season and lipid content) on the contamination levels. Therefore, 8
the ranges reported for mussels are usually broad. PCDD/Fs concentration in various types 9
of mussel reported for different aquatic systems are slightly higher than those found in 10
Thau lagoon (Petreas et al., 1992; Bayarri et al., 2001; Abad et al., 2002, 2003; Knutzenet 11
al., 2003) (Table S1, supporting information). 12
∑PCB exhibited concentrations in mussels ranged from 10 to 39 ng g-1 d.w.Lower values 13
were observed at the western (M1) and middle (M4) part of the lagoon and the highest at 14
the eastern part (M2). This distribution was also observed in sediments. On the other hand, 15
the PCB concentration distribution appears to be the opposite than the one observed for 16
PCDD/Fs in mussels where the highest concentration was found in the western part of the 17
lagoon as indicated above. Concentrations within the same order of magnitude were found 18
in mussels from various spots in different marine locations (Porte and Albaigés 1993; Lee 19
et al., 1996; Bayarri et al., 2001; Piersanti et al., 2006) (Table S2, supporting information). 20
21 22 23
Congener patterns 1
2
PCDD/Fs 3
PCDD/F congener patterns in the environmental compartments studied are presented in 4
Figure 4. Air samples for the different days of the studied period at both sites exhibited 5
very similar PCDD/F congener patterns indicating a homogeneous situation in both shores 6
of the lagoon. OCDD and HpCDD predominated in the pattern, followed at a lower 7
percentage, by HpCDF and OCDF. This congener distribution (“sink” profile) has been 8
described in the literature as the resultant patter from combustion sources after preferential 9
removal of lower chlorinated dioxins and furans by atmospheric processes (Brubaker and 10
Hites, 1997). Air patterns found in Thau lagoon were in agreement with those reported for 11
various rural areas influenced by deposition of these pollutants after long range transport 12
(Tysklind et al., 1993; Lohmann and Jones., 1998; Castro-Jiménez et al., 2005, 2008; 13
Cleverly et al., 2007). 14
15
Particulate water phase and surface sediment patterns were also dominated byHpCDD and
16
OCDD and were similar in all sampling sites suggesting a homogeneous situation in the 17
lagoon and a direct coupling between these compartments. 18
OCDD and 2,3,7,8-TCDF dominated the distribution patterns of PCDD/Fs in mussel 19
samples and these two congeners accounted for more than 70% of the ∑2,3,7,8-PCDD/Fs. 20
This profile is similar to results previously published for mussels from other marine and 21
lake waters where the clear predominance of the two mentioned congeners was also 22
observed (Petreas et al., 1992; Abad et al. 2003; Munschy et al., 2005b; Zhang and Jiang, 1
2005; Danis et al., 2006). 2
A very similar signal was observed when comparing the patterns from air (dominated 3
almost exclusive by the particulate phase), particle water phase and sediment. A similar 4
behavior has been observed in the sub-alpine Lake Maggiore where no local sources are 5
present and the PCDD/Fs and PCBs inputs to the water column and the sediments could be 6
attributed to long range transport and subsequence scavenging of atmospheric particulates 7
(Castro-Jiménez et al., 2005, 2008). The similar finding in Thau lagoon suggests a 8
predominant role of the atmosphere in the accumulation of PCDD/Fs in surface sediments 9
from this system. 10
The signal observed in mussels was different to the one exhibited by the other 11
compartments. Thus, whereas the signal observed for HpCDD, OCDD, HpCDF and OCDF 12
in the mussels was very similar to the one in the water and sediment (and also air), the 13
predominance of the low chlorinated PCDFs (specially the 2,3,7,8-TCDF) in mussels was 14
not observed in any of the other compartments (Figure 4). This fact could be interpreted as 15
a combined PCDD/Fs signal in mussels arriving in part from the water SPM but also from 16
the dissolved water phase, since mussels have been described to accumulate contaminants 17
both from the dissolved and particulate phases (Gossiaux et al., 1998). However, no 18
confirmation on the contribution from the dissolved water phase to this fingerprint could be 19
made with the available data, since it was only possible to determine the PCDD/Fs 20
dissolved water phase concentrations in one sample (RV) and most of the congeners were 21
below the LOD. Broman et al. (1991) reported a predominance of TCDFs in dissolved 22
water phase in the Baltic Sea but very few data are available in the literature on PCDD/Fs 1
in the dissolved water phase. 2
3
PCBs 4
Results on PCBs patterns are presented in Figure 5. As observed for PCDD/Fs, PCB air 5
patterns at both sites of the lagoon were very similar suggesting also a homogeneous 6
situation at both shores for this chemical group. When examining the patterns of the air gas 7
and particulate phases, low chlorinated congeners were predominant in the air gas phase 8
pattern, whereas higher chlorinated PCB were more abundant in the particulate air phase 9
pattern. Regarding PCB-118, although not reported (see QA/QC section) no predominance 10
for the samples in which this congener was measured was observed in the congener pattern. 11
The PCB pattern found in water showed a predominance of PCB-101 followed by PCB-52
12
in the dissolved water phase, whereas in the SPM phase, PCB-153 followed by PCB-138 13
were found predominant. Regarding surface sediment and mussel patterns, both matrixes 14
exhibited a predominance of PCB-153 followed by PCB-138. The fact that the pattern 15
found in all sampling location for each compartment (water, mussels and sediments) was 16
very similar suggests a homogeneous situation throughout the lagoon. 17
The predominance of hexachlorinated PCBs in mussels, especially PCB-153 and PCB-138, 18
has been reported in the literature for different coastal locations along the western 19
Mediterranean (Porte and Albaigés, 1993) and the Adriatic Sea (Bayarri et al., 2001; 20
Piersanti et al., 2006). Predominance of PCB-153 was reported from industrial and urban 21
impacted site sediments from Venice lagoon whereas for the less contaminated areas of the 22
lagoon, PCB-28 seemed to be predominant (Moret et al., 2001). Conversely, PCB-28 was 23
found predominant in sediments from Taihu Lake in China and anthropogenic impacted site 1
(Zhang and Jiang, 2005). 2
Interestingly, when comparing the PCB pattern in the dissolved and particulate water 3
phases with the pattern exhibited in mussel and sediment, a similarity was observed only 4
with the particulate water phase (Figure 5). It seems that although the PCBs were 5
predominately found in the dissolved water phase, the resultant pattern in mussels reflected 6
better the one found in the SPM or sediments. 7
When comparing the patterns from air particulate phase, water SPM and sediments no 8
similarity was observed as occurred for PCDD/Fs. The predominance of PCB-153 observed 9
in SPM and sediment was not observed in air, where PCB-180 predominated. However, in 10
the case of PCBs, air-water exchange has been described as an important mechanism of 11
incorporation of these chemical to water bodies (Eisenreich and Looney, 1981; 12
Swackhamer et al., 1988) and this input way has not been evaluated in the present work. 13
14
Conclusions
15
PCDD/F and PCB air concentrations in Thau lagoon are typical of those reported for rural 16
or semi-rural sites in spite of this area has been described as an anthropogenic impacted 17
zone. Most probably the local meteorological conditions such as the strong wind regimes 18
affecting the lagoon area during the whole year (except summer months) favor these low air 19
concentrations. PCDD/F and PCB concentrations in the lagoon waters are low, especially 20
those for dioxins. PCDD/F and PCB sediment concentrations are in the range of those from 21
moderate urban/anthropogenic impacted areas, especially at the Eastern part of the lagoon. 22
Concentrations of PCDD/F, in all cases below the threshold set by the European 23
Commission for fishery products for human consumption, and PCB in mussels point again 1
to a medium/moderate level situation. 2
The congener patterns of the studied POPs in the different environmental compartments 3
provide insight into the multi-media contamination distribution in a marine lagoon. The 4
patterns of PCDD/F congeners in air, water particulate phase and sediments are very similar 5
suggesting direct coupling between these compartments. Therefore, PCDD/F atmospheric 6
inputs mainly associated to the air particle phase are expected to contribute to the total load 7
of PCDD/Fs in this aquatic system. However, for the same set of samples and available 8
data, no similarity is found for PCB congener patterns in air particulate phase relative to 9
those obtained in water phase (particulate and dissolved) and sediment. Further 10
investigation of other input mechanisms such as air-water exchange is needed to elucidate 11
the role of the atmosphere in the input of PCBs in this aquatic system. 12
The similarity of patterns observed in all sampling sites for each compartment (spatial 13
distribution) indicates a homogeneous situation in the lagoon and same type of source (s) 14
can be expected to affect the whole aquatic system. A complete year of air sampling, 15
including summer months and back trajectories analyses of air masses arriving to the area 16
are undergoing and will allow to more precisely evaluate the occurrence of airborne 17
PCDD/Fs and PCBs in this coastal lagoon. 18
Acknowledgments
1
This work was supported by Ifremer, by the Thresholds of Environmental Sustainability 2
Project (European Commission FP6, SUST-DEV, IP Project 003933-2) and the Agence de 3
l’eau Rhône-Méditerrannée-Corse. We thank all colleagues from Ifremer laboratory 4
LER/LR for their support with the sampling campaigns. We acknowledge our colleagues 5
from JRC-IES: Angelo Solimini from for his contribution regarding statistical data 6
analyses, Tania Huber for her assistant in the water samples analyses and Ingrid Vives for 7
her contribution reviewing the manuscript. We also thank Steven J. Eisenreich from JRC-8
IHCP for his advice in the air sampling campaign design. 9
10 11 12
References
1 2
Abad E., Pérez F., Llerena J.J., Saulo J., Caixach J., Rivera J., 2002. Study on 3
PCDDs/PCDFs and co-PCBs content in food samples from Catalonia (Spain). 4
Chemosphere, 46, 1435-1441. 5
6
Abad E, Pérez F, Llerena J J, Caixach J, Rivera J. 2003. Evidence for a specific pattern of 7
polychlorinated dibenzo-p dioxins and dibenzofurans in bivalves. Environmental Science 8
and Technology 37, 5090-5096. 9
10
Abad E., Caixach J., Rivera J., gustems L., Massagué G., Puig O. 2004. Temporal trends of 11
PCDDs/PCDFs in ambient air in Catalonia (Spain). Science of the Total Environment 334-12
335, 279-285. 13
14
Abad E., Saulo J., Caixach J. and Rivera J., 2000. Evaluation of a new automated cleanup 15
system for the analysis of polychlorinated dibenzo-p-dioxins and dibenzofurans in 16
environmental samples. J. Chromatography A 893, 383-391. 17
18
Bayarri S., Baldassarri L.T., Iacovella N., Ferrara F., di Domenico A., 2001. PCDDs, 19
PCDFs, PCBs and DDE in edible marine species from the Adriatic Sea. Chemosphere, 43, 20
601-610. 21
Breivik, K., Sweetman, A., Pacyna, J.M., and Jones, K.C., 2002. Towards a global 1
historical emission inventory for selected PCB congeners-a mass balance approach 2. 2
Emissions. The Science of the Total Environment 290, 199-224. 3
4
Broman D., Näf c., Rolff C., Zebühr Y., 1991. Occurrence and dynamics of polychlorinated 5
dibenzo-p-dioxins and dibenzofurans and polycyclic aromatic hydrocarbons in the mixed 6
surface layer of remote coastal and offshore waters of the Baltic. Environmental Science 7
and Technology 25, 1850-1864. 8
9
Brubaker W.W. JR. and Hites R.A., 1997. Polychlorinated dibenzo-p-dioxins and 10
dibenzofurans: gas-phase hydroxyl radical reactions and related atmospheric removal. 11
Environmental Science and Technology 31, 1805-1810. 12
13
Bruzy L.P. and Hites, R.A.,1996. Global mass balance for polychlorinated dibenzo-p-14
dioxins and dibenzofurans. Environmental Science and Technology 30, 1797-1804. 15
16
Bruhn R., and McLachlan M.S., 2002. Seasonal variation of polychlorinated biphenyl 17
concentrations in the souther part of the Baltic Sea. Marine Pollution Bulletin 44, 156-163. 18
19
Castro-Jiménez, J., Canuti, E., Christoph, E.H., Eisenreich, S.J., Hanke, G., Mariani, G.,
20
Skejo, H., Umlauf, G., 2005. Tracing atmospheric deposition of PCDD/Fs in Lake 21
Maggiore (Italy): Preliminary results on settling material and sediments. Organohalogen 22
Compounds 67, 1209-1215. 23
Castro-Jiménez, J., Mariani, G. , Eisenreich, S.J., Christoph, E.H., Hanke, G., Canuti,E.,
1
Skejo,H. and Umlauf, G. 2008. Atmospheric input of POPs into Lake Maggiore (Northern
2
Italy): PCDD/Fs and dioxin-like PCBs profiles and fluxes in the atmosphere and aquatic 3
system. Chemosphere 73, S122–S130. 4
5
Cleverly D., Ferrario J., Byrne C., Riggs K., Joseph D., Hartford P. 2007. A general 6
indication of the contemporary background levels of PCDDs, PCDFs and coplanar PCBs in 7
the ambient air over rural and remote areas of the United States. Environmental Science 8
and Technology 41, 1537-1544. 9
10
Cousins, I.T., and Jones K.C., 1998. Air-soil exchange of semi-volatile organic compounds 11
(SOCs) in the UK. Environmental Pollution 102, 105-118. 12
13
Currado G.M. and Harrad S. 2000. Factors influencing atmospheric concentrations of 14
polychlorinated biphenyls in Birmingham, U.K. Environmental Science and Technology 15
34, 78-82 16
17
Dalla Valle M, Marcomini A, Sfriso A, Sweetman A J, and Jones K C. 2003. Estimation of 18
PCDD/F distribution and fluxes in the Venice Lagoon, Italy: combining measurement and 19
modeling approaches. Chemosphere 51, 603-616. 20
21
Danis B., Debacker V., Trujilo Miranda C., Dubois Ph. 2006. Levels and effects of 22
PCDD/Fs and co-PCBs in sediments, mussels, and sea stars of the intertidal zone in the 23
southern North Sea and the English Channel. Ecotoxicology and Environmental Safety 65, 1
188-200. 2
3
Eisenreich S.J., and Looney B.B., 1981. Evidence for the atmospheric flux of 4
polychlorinated biphenyls to Lake Superior. In: D. Mackay, S. Peterson, S.J. Eisenreich and 5
M.S. Simmons (Eds), Physical behavior of PCBs in the Great Lakes. Ann Arbor science 6
Publishers, Ann Arbor, MI, pp 141-153. 7
8
Eljarrat E., De La Cal A., Larrazabal D., Fabrellas B., Fernandez-Alba A.R., Borrull F., 9
Marce R.M., Barcelo D., 2005. Occurrence of polybrominated diphenylethers, 10
polychlorinated dibenzo-p-dioxins, dibenzofurans and biphenyls in coastal sediments from 11
Spain. Environmental Pollution 136, 493-501. 12
13
European Commission, 2006. Commission Regulation (EC) No. 199/ 2006 of 3 February 14
2006 amending Regulation (EC) No. 466/2001 setting maximum levels for certain 15
contaminants in foodstuffs as regards dioxins and dioxin-like PCBs, Official Journal of the 16
European Communities L 32/34–38. 17
18
Gangnery A., Bacher C., Buestel D. 2001. Assessing the production and the impact of 19
cultivated oysters in the Thau lagoon (Mediterranee, France) with a population dynamics 20
model. Canadian Journal of Fisheries and Aquatic Sciences 58, 1012-1020. 21
Gossiaux D.C., Landrum P.F., Fisher S.W. 1998. The assimilation of contaminants from 1
suspended sediment and algae by the Zebra Mussel, Dreissena polymorpha. 1998. 2
Chemosphere 36, 3181-3197. 3
4
Gambaro A., Manodori L., Moret I., Capodoglio G., Cescon P. 2004. Determination of 5
polychlorobiphenyls and polycyclic aromatic hydrocarbons in the atmospheric aerosol of 6
the Venice Lagoon. Analytical and Bioanalytical Chemistry 378, 1806-1814. 7
8
Gómez-Gutiérrez A., Garnacho E., Bayona J.M., Albaigés J. 2007. Assessment of the 9
Mediterranean sediments contamination by persistent organic pollutants. Environmental 10
Pollution 148, 396-408. 11
12
Harrad S.J. and Jones K.C., 1992. A source inventory and budget for chlorinated dioxins 13
and furans in the United Kingdom environment. The Science of the Total Environment 14
126, 89-107. 15
16
Harrad S. and Mao H. 2004. Atmospheric PCBs and organochlorine pesticides in 17
Birmingham, UK: concentrations, sources, temporal and seasonal trends. Atmospheric 18
Environment 38, 1437-1445. 19
20
Hashimoto S., Matsuda M., Wakimoto T., and Tatsukawa R., 1995. Simple sampling and 21
analysis of PCDDs and PCDFs in Japansese coastal seawater. Chemosphere 30, 1979-1986. 22
Hornbuckle, K.C., Carlson, D.; Swackhamer, D.; Baker, J. and Eisenreich, S.J., 2006. 1
Polychlorinated Biphenyls in the Great Lakes. In: Persistent Organic Pollutants in the Great 2
Lakes (ed. Hites, R. A.), Handbook in environmental Chemistry Series, Springer-Verlag, 3
Heidelberg. 4
5
Johansson I, Moisan K, Guiot N, Truquet I, Munschy C, Tronczyński J. 2006. 6
Polybrominated diphenyl ethers (PBDEs) in mussels from selected French coastal sites: 7
1981-2003. Chemosphere 64, 296-305. 8
9
Knutzen J., Bjerkeng B., Naes K., Schlabach M., 2003. Polychlorinated
10
dibenzofurans/dibenzo-p-dioxins (PCDF/PCDDs) and other dioxin-like substances in 11
marine organisms from the Grenland fjords, S. Norway, 1975–2001: present contamination 12
levels, trends and species specific accumulation of PCDF/PCDD congeners. Chemosphere, 13
52, 745-760. 14
15
Lazure P.,1992. Etude de la dynamique de l’étang de Thau par modèle numérique 16
tridimensionnel.Vieet Milieu 42,137–145. 17
18
Léauté F., Tixier C., Munschy C., Tronczyński J. (2007) Present-day distributions and 19
background concentrations of persistent organic contaminants (PAHs and PCBs) in the 20
sediments of the Mediterranean lagoon (Thau) (to be submitted to Marine Pollution 21
Bulletin). 22
Lee K.M., Kruse H., Wassermann O., 1996. The pattern of organochlorines in Mussels 1
Mytilus edulis L. from the South West Baltic Sea. Archives of Environmental 2
Contamination and .Toxicology 31, 68-76. 3
4
Legendre, Pierre & Louis Legendre. 1998. Numerical ecology. 2nd English Edition. Elsevier
5
Science BV, Amsterdam. xv + 853 pages. 6
7
Lohmann R., Brunciak P., Dachs J., Giglioti C.L., Nelson E., Van Ry D., Glenn T., 8
Eisenreich S.J., Jones J.L. and Jones K.C., 2003. Processes controlling diurnal variations of 9
PCDD/Fs in the New Jersey coastal atmosphere. Atmospheric Environment 37, 959-969. 10
11
Lohmann R.; Green L.J.N., and Jones K.C., 1999. Detailed studies of the factors 12
controlling atmospheric PCDD/F concentrations. Environmental Science and Technology 13
33, 4440 – 4447. 14
15
Lohmann R. and Jones K.C., 1998. Dioxins and furans in air and deposition: a review of 16
levels, behavior and processes. The Science of the Total Environment 219, 53-81. 17
18
Lohmann R., Nelson E., Eisenreich S.J. and Jones K.C., 2000. Evidence of dynamic air-19
water exchange of PCDD/Fs: a study in the Raritan Bay/Hudson River Estuary. 20
Environmental Science and Technology 34, 3086-3093. 21
Mandalakis M., Tsapakis M., and Stephanou E.G., 2001. Optimization and application of 1
high-resolution gas chromatography with ion trap tandem mass spectrometry to the 2
determination of polychlorinated biphenyls in atmospheric aerosols. Journal of 3
Chromatography 925, 183-196. 4
5
Mandalakis M., Tsapakis M., Tsoga A., and Stephanou E.G., 2002. Gas-particle 6
concentrations and distributions of aliphatic hydrocarbons, PAHs, PCBs and PCDD/Fs in 7
the Atmosphere of Athens (Greece). Atmospheric Environment 36, 4023-4035. 8
9
Manodori L., Gambaro A., Moret I., Capodoglio G., Cairns W.R.L., Cescon P. 2006. 10
Seasonal evolution of gas-phase PCB concentrations in Venice Lagoon Area. Chemosphere 11
62, 449-458. 12
13
Maldonado C., and Bayona J.M., 2002. Organochlorine compounds in the north-western 14
Black Sea water: distribution and water column process. Estuarine, Coastal and Shelf 15
Science 54, 527-540. 16
17
Moret I., Piazza R., Benedetti M., Gambero A., Barbante C., Cescon P. 2001. 18
Determination of polychlorobiphenyls in Venice Lagoon sediments. Chemosphere 43: 559-19
565. 20
21
Munschy C., Tronczyński J., Héas-Moisan K., Guiot N., Truquet I., 2005a. Analyse de 22
contaminants organiques (PCB, OCP, HAP) dans les organismes marins. Ed. ISBN 2-23
84433-144-0, Méthodes d’analyse en milieu marin, 44p. 24
25
Munschy C, Johansson I, Guiot N, Héas-Moisan K, Tronczyński J. 2005b. Retrospective 26
monitoring of the contamination of marine mussels from the French Coasts by PCDD/Fs 27
(1981-2004). Organohalogen Compounds 67, 1243-1246. 1
2
Nixon S.W., 1982. Nutrients, primary production, and fisheries yields in coastal lagoons. 3
Oceanol.Acta 5, 357-371. 4
5
Pan J., Yang Y-L., Xu Q., Chen D-Z., Xi D-L. 2007. PCBs, PCNs and PBDEs in sediments 6
and mussels from Qingdao coastal sea in the frame of current circulations and influence of 7
sewage sludge. Chemosphere 66, 1971-1982. 8
9
Pearson R.F., Hornbuckle C., Eisenreich S.J., and Swackhamer D.L., 1996. PCBs in Lake 10
Michigan water revisited. Environmental Science and Technology 30, 1429-1436. 11
12
Petreas M.X., Wiesmüller T., Palmer F.H., Winkler J.J. and Stephens R.D. 1992. Aquatic life 13
as bimonitors of dioxins/furan and coplanar polychlorinated biphenyl contamination in the 14
Sacramento-San Joaquin river delta. Chemosphere 25, 621-631. 15
16
Piersanti A., Scrucca L., Galarini R., Tavolini T., 2006. Polychlorobiphenyls (18 congeners) in 17
mussels from middle Adriatic Sea. Organohalogen Compounds 68, 1951-1954. 18
19
Porte C., and Albaigés J. 1993. Bioaccumulation patterns of hydrocarbons and polychlorinated 20
biphenyls in bivalves, crustaceans, and fishes. Archives of Environmental Contamination and 21
Toxicology 26, 273-281. 22
Réseau National d'Observation de la qualité du milieu marin littoral (RNO) 1
(http://www.ifremer.fr/envlit/surveillance/rno.htm) 2
3
Rose C.L., McKay W.A., 1996. PCDDs (dioxins) and PCDFs (furans) in selected UK lake 4
and reservoir sites-concentrations and TEQs in sediments and fish samples. The Science of 5
the Total Environment 177, 43-56. 6
7
Safe S., 1984. Polychlorinated biphenyls (PCBs) and polybrominated biphenyls (PBBs): 8
Biochemistry, toxicology and mechanism of action. Critical Reviews in Toxicology 13, 9
319-395. 10
11
Safe S., 1990. Polychlorinated biphenyls (PCBs), dibdenzo-p-dioxins (PCDDs), 12
dibenzofurans (PCDFs) and related compounds: Environmental and mechanistic 13
considerations which support the development of toxic equivalency factors (TEFs). Critical 14
Reviews in Toxicology 21, 51-88. 15
16
Schwarzenbach, R. P., Gschwend, P. M., Imboden, D. M., 2003, Environmental Organic 17
Chemistry, 2nd Edition, Wiley Interscience, New York. 18
19
Simcik M.F., Basu I., Sweet C.W., Hites R.A. 1999. Temperature dependence and temporal 20
trends of polychlorinated biphenyl congeners in the Great Lakes atmosphere. 21
Environmental Science and Technology 33, 1991-1995. 22
Suarez M.P., Rifai H.S., Palachek R. Dean, K., and Koening L., 2006. Distribution of 1
polychlorinated dibenzo-p-dioxins and dibenzofurans in suspended sediments, dissolved 2
phase and bottom sediment in the Houston ship Channel. Chemosphere 62, 417-429. 3
4
Swackhamer D.L., McVeety B.D., and Hites R.A., 1988. Deposition and evaporation of 5
polychlorinated biphenyls to and from Siskewit Lake, Isle Royale, Lake Superior. 6
Environmental Science and Technology 22, 664-672. 7
8
Totten L.A., Gigliotti C.L., Vanry D.A., Offenberg J.H., Nelson E.D., Dachs J., Reinfelder 9
J.R. and Eisenreich S.J., 2004. Atmospheric concentrations and deposition of 10
polychlorinated biphenyls to the Hudson River estuary. Environmental Science and 11
Technology 38, 2568-2573. 12
13
Tronczyński 1998 in Surveillance du milieu marin. Travaux du Réseau National 14
d’Observation du milieu marin. Edition 1998. 15
16
Tronczyński J., Catherine Munschy, Karine Moisan, Nadège Guiot, Isabelle Truquet, 17
Nathalie Olivier, Sophie Men and Audrey Furaut. 2004. Contamination of the Bay of 18
Biscay by polycyclic aromatic hydrocarbons (PAHs) following the T/V «Erika» oil spill. 19
Aquatic Living Resources 17, 243-259. 20
21
Tronczyński J., Munschy C., Héas-Moisan K., Guiot N., Truquet I., 2005a. Analyse de 22
contaminants organiques (herbicides, PCB, OCP, HAP) dans les eaux estuariennes et 23
marines côtières. Ed. ISBN 2-84422-148-3, Méthodes d’analyse en milieu marin, 52p. 24
Tronczyński J., Munschy C., Héas-Moisan K., Guiot N., Truquet I., 2005b. Analyse de 1
contaminants organiques (PCB, OCP, HAP) dans les sédiments marins. Ed. ISBN 2-84433-2
145-9, Méthodes d’analyse en milieu marin, 44p. 3
4
Tysklind M., Fangmark I., Marklund S., Lindskog A., Thaning L., and Rappe C., 1993. 5
Atmospheric transport and transformation of polychlorinated dibenzo-p-dioxins and 6
dibenzofurans. Environmental Science and Technology 27, 2190-2197. 7
8
U.S. EPA., 1994. Method 1613: Tetra-through Octa-Chlorinated Dioxins and Furans by 9
Isotope Dilution HRGC/HRMS.U.S. EPA., 1999. Method 1668, revision A: Chlorinated 10
Biphenyl Congeners in Water, Soil, Sediment and Tissue by HRGC/HRMS. 11
12
U.S. EPA., 1999. Method 1668, revision A: Chlorinated Biphenyl Congeners in Water, 13
Soil, Sediment and Tissue by HRGC/HRMS. 14
15
Van den Berg, M., Birnbaum L., Bosveld A.T.C., Brunström B., Cook P, Feeley M.,. Giesy 16
J.P., Hanberg A., Hasegawa R., Kennedy S.W., Kubiak T., Larsen J. C., van Leeuwen 17
R.F.X., Djien Liem A.K., Nolt C., Peterson R.E., Poellinger L., Safe S., Schrenk D., Tillitt 18
D., Tysklind M., Younes M., Wærn F., and Zacharewski T., 1998. Toxic Equivalency 19
Factors (TEFs) for PCBs, PCDDs, PCDFs for Humans and Wildlife. Environmental Health 20
Perspectives 106, 775-792. 21
22
Vives I., Canuti E., Castro-Jiménez J., Christoph E.H., Eisenreich S.J., Hanke G., Huber T., 23
Mariani G., Mueller A., Skejo H. Umlauf G., Wollgast J. 2007. Occurrence of 24
polychlorinated dibenzo-p-dioxins and dibenzofurans (PCDD/Fs), polychlorinated 1
biphenyls (PCBs) and polybrominated diphenyls ethers (PBDEs) in Lake Maggiore (Italy 2
and Switzerland). Journal of Environmental Monitoring 9, 589-598. 3
4
Wania F., Haugen J-E., Lei Y.D., Mackay D. 1998. Temperature dependence of 5
atmospheric concentrations of semivolatile organic compounds. Environmental Science and 6
Technology 32, 1013-1021. 7
8
Wodarg, D., Kömp P., McLachlan M.S., 2004. A baseline study of polychlorinated 9
biphenyl and hexachlorobenzene concentrations in the western Baltic Sea and Baltic 10
Proper. Marine Chemistry 87, 23-36. 11
12
Zeng E.Y., Peng, J., Tsukada D., and Ku T-L., 2002. In situ measurements of 13
polychlorinated biphenyls in the waters of San Diego Bay, California. Environmental 14
Science and Technology 36, 4975-4980. 15
16
Zhang Q., Jiang G. 2005. Polychlorinated dibenzo-p-dioxins/furans and polychlorinated 17
biphenyls in sediments and aquatic organisms from the Taihu Lake, China. Chemosphere 18
61, 314-322. 19
20
Zhou J.L., Maskaoui K., Qiu Y.W., Hong H.S., and Wang Z.D. 2001. Polychlorinated 21
biphenyl congeners and organochlorine insecticides in the water column and sediments of 22
Daya Bay, China. Environmental Pollution 113, 373-384.
1
IF-1 IF-2 IF-3 IF-4 IF-5 BZ-1 BZ-2 BZ-3 BZ-4 M1 M4 M2 T10 T12 T2 C4 T11 T12 RV
2,3,7,8-TCDD ≤ 1.0* ≤ 1.0 ≤ 1.0 ≤ 1.0 ≤ 1.0 ≤ 1.0 ≤ 1.0 ≤ 1.0 1.4 nd 0.1 n.d. 0.1 1.1 ≤ 1.0 ≤0.7 ≤ 1.0 ≤ 1.0 ≤ 2.0 1,2,3,7,8-PeCDD 6.0 5.7 2.3 5.7 5.4 1.6 3.5 1.3 5.5 0.24 nd n.d. 0.5 2.3 ≤ 1.0 2.8 ≤ 1.0 ≤ 1.0 4.0 1,2,3,4,7,8-HxCDD 8.5 8.3 2.8 4.9 6.8 3.5 6.1 1.7 6.8 0.26 <0.07 n.d. 0.4 2.1 3.5 2.8 ≤ 2.0 ≤ 2.0 9.6 1,2,3,6,7,8-HxCDD 24.8 19.1 7.2 12.3 28.0 9.1 14.5 2.1 18.9 0.37 <0.06 0.2 1.1 7.5 7.3 6.0 ≤ 2.0 4.3 24.1 1,2,3,7,8,9-HxCDD 17.7 16.6 6.1 11.8 16.7 6.7 10.9 5.2 17.2 0.53 0.1 0.2 1.1 5.5 5.8 5.6 ≤ 2.0 2.8 21.6 1,2,3,4,6,7,8-HpCDD 247.7 276.4 59.2 132.5 262.3 121.1 162.5 55.3 175.2 2.91 1.6 1.6 16.2 162.2 74.4 67.6 21.2 49.7 321.7 OCDD 379.2 917.9 132.0 273.2 576.7 310.2 340.8 95.4 406.1 10.44 5.4 6.4 107.0 1270.1 266.6 320.1 114.1 350.4 1841.7 2,3,7,8-TCDF 6.7 7.1 2.4 4.9 6.0 2.5 1.6 1.2 2.3 2.7 3.5 4.0 2.9 12.6 ≤ 1.0 ≤ 1.0 ≤ 1.0 ≤ 1.0 40.0 1,2,3,7,8-PeCDF 5.7 6.5 5.9 4.5 4.5 1.5 1.7 1.6 6.1 0.4 0.3 0.3 1.3 5.1 ≤ 1.0 ≤ 1.0 ≤ 1.0 ≤ 1.0 25.4 2,3,4,7,8-PeCDF 7.0 11.1 10.9 8.0 7.7 4.6 7.1 4.1 8.5 0.6 0.4 0.6 1.8 6.2 ≤ 1.0 ≤ 1.0 ≤ 1.0 ≤ 1.0 33.9 1,2,3,4,7,8-HxCDF 8.9 11.1 10.0 6.9 7.9 5.3 18.2 3.2 11.8 nd 0.1 0.1 1.5 6.6 ≤ 2.0 ≤ 2.0 ≤ 2.0 ≤ 2.0 41.7 1,2,3,6,7,8-HxCDF 5.5 6.6 9.9 6.3 4.8 4.0 7.6 ≤ 1.0 10.5 nd 0.2 n.d. 1.3 4.5 6.2 8.2 ≤ 2.0 ≤ 2.0 32.2 2,3,4,6,7,8-HxCDF 8.9 19.6 13.6 9.5 9.1 5.9 18.9 ≤ 1.0 13.2 0.4 0.2 0.2 2.0 6.2 10.9 8.3 ≤ 2.0 4.3 55.1 1,2,3,7,8,9-HxCDF 2.8 6.5 4.2 2.4 3.4 2.1 4.2 ≤ 1.0 7.9 0.2 <0.06 n.d. 0.3 1.4 ≤ 2.0 ≤ 2.0 ≤ 2.0 ≤ 2.0 14.3 1,2,3,4,6,7,8-HpCDF 36.4 59.5 31.2 26.6 28.4 18.1 52.4 6.0 45.9 1.0 0.5 0.4 8.4 60.0 35.6 28.3 ≤ 2.0 10.9 175.0 1,2,3,4,7,8,9-HpCDF 4.7 12.3 4.5 3.4 5.0 3.0 5.1 ≤ 1.0 4.8 0.3 <0.07 n.d. 0.5 4.0 4.5 3.7 ≤ 2.0 ≤ 2.0 12.3 OCDF 14.9 57.0 14.0 15.0 20.9 18.5 21.6 4.0 70.7 1.2 0.4 0.4 6.9 98.9 11.4 14.9 ≤ 5.0 15.4 118.9 ∑2,3,7,8-PCDDs 684.9 1245.1 210.6 441.1 896.9 453.1 539.4 162.1 631.1 14.7 7.2 8.3 26.9 1450.7 359.6 405.7 143.3 411.2 2224.7 ∑2,3,7,8-PCDFs 101.5 197.2 106.5 87.3 97.7 65.6 138.5 24.2 181.7 6.7 5.6 5.9 126.4 205.4 75.6 70.4 20.0 41.6 548.8 ∑2,3,7,8-PCDD/Fs 786.4 1442.4 317.1 528.8 994.6 518.7 677.8 186.4 812.8 21.4 12.8 14.3 153.3 1656.1 435.2 476.1 163.3 452.8 2773.5 WHO98-TEQ*** 22.1 25.7 15.8 18.4 21.7 10.4 18.6 6.9 22.6 1.0 0.7 0.8 2.89 13.8 7.6 8.7 4.3 5.3 53.4
* Limits of detection are (≤) values and were calculated on the bases of a signal to noise ratio of 3/1 ** Values are particle phase concentrations except for RV sample that is total (dissolved+particle phase) *** TEQ concentations were calculated as upperbound nd= not detected due to a bad isotopic ratio
Sediment (pg g-1 d.w.) Surface Water (fg l-1)**
Site IF (14-18 Nov 05) Site BZ (15-18 Nov 05) May 04 May 04 Nov 05
Table 1. Concentrations of PCDD/Fs in air (fg m-3), water column (fg l-1), surface sediments and mussels (pg g-1 dry weight) found in Thau lagoon.
Compounds
Air (gas+particle phase) fg m-3 Mussel (pg g-1 d.w.)
2 3 4 5 6 7
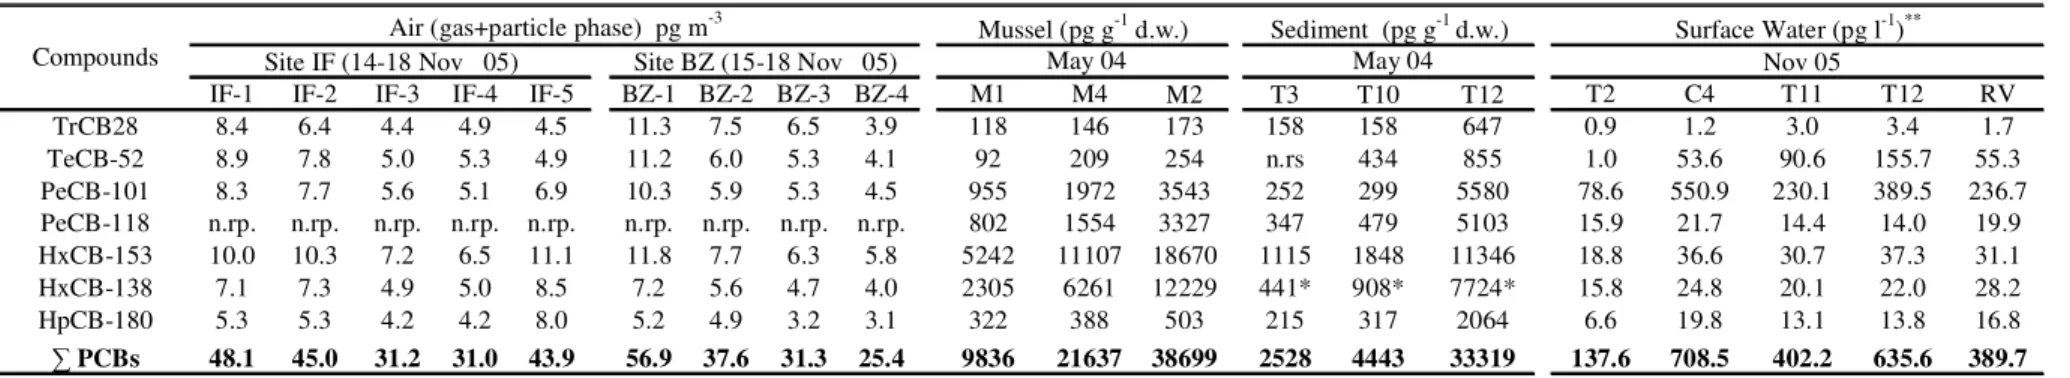
IF-1 IF-2 IF-3 IF-4 IF-5 BZ-1 BZ-2 BZ-3 BZ-4 M1 M4 M2 T3 T10 T12 T2 C4 T11 T12 RV TrCB28 8.4 6.4 4.4 4.9 4.5 11.3 7.5 6.5 3.9 118 146 173 158 158 647 0.9 1.2 3.0 3.4 1.7 TeCB-52 8.9 7.8 5.0 5.3 4.9 11.2 6.0 5.3 4.1 92 209 254 n.rs 434 855 1.0 53.6 90.6 155.7 55.3 PeCB-101 8.3 7.7 5.6 5.1 6.9 10.3 5.9 5.3 4.5 955 1972 3543 252 299 5580 78.6 550.9 230.1 389.5 236.7 PeCB-118 n.rp. n.rp. n.rp. n.rp. n.rp. n.rp. n.rp. n.rp. n.rp. 802 1554 3327 347 479 5103 15.9 21.7 14.4 14.0 19.9 HxCB-153 10.0 10.3 7.2 6.5 11.1 11.8 7.7 6.3 5.8 5242 11107 18670 1115 1848 11346 18.8 36.6 30.7 37.3 31.1 HxCB-138 7.1 7.3 4.9 5.0 8.5 7.2 5.6 4.7 4.0 2305 6261 12229 441* 908* 7724* 15.8 24.8 20.1 22.0 28.2 HpCB-180 5.3 5.3 4.2 4.2 8.0 5.2 4.9 3.2 3.1 322 388 503 215 317 2064 6.6 19.8 13.1 13.8 16.8 ∑ PCBs 48.1 45.0 31.2 31.0 43.9 56.9 37.6 31.3 25.4 9836 21637 38699 2528 4443 33319 137.6 708.5 402.2 635.6 389.7
n.rp.= not reported; n.rs = not well resolved; *CB138 quantified on DB5 column is not resolved with CB163/164
**
Values are the sum of particulate and dissolved phase concentrations
Table 2. Concentrations of the 7 ICES PCBs in air (pg m-3), water colum (pg l-1), surface sediments and mussels (pg g-1 dry weight) found in Thau lagoon.
Compounds
Air (gas+particle phase) pg m-3 Mussel (pg g-1 d.w.) Sediment (pg g-1 d.w.) Surface Water (pg l-1)**
Site IF (14-18 Nov 05) Site BZ (15-18 Nov 05) May 04 May 04 Nov 05
1 2
FIGURE LEGENDS
3 4
Figure 1. Location of Thau Lagoon (France) and air, water, sediments and mussels
5
sampling sites. Surface sediments and mussels were collected in May 2004 whereas air and 6
water samples were collected in November 2005. Locations in the map are approximated 7
(see coordinates for exact location). 8
9
Figure 2. Wind directions and wind speeds registered during the sampling period (14th -19th 10
November 2005) together with the daily sampled intervals for both sites. Temperature 11
varied from 5 to 16 0C during that period. Precipitation was registered on days 14th and 15th. 12
Data are from Météo France, station from Sète. 13
14 15
Figure 3. Principal components loading plot and correlation matrix among atmospheric
16
variables and ∑PCBs and ∑PCDD/Fs air concentrations during the sampling week. Values 17
were expressed as mean over the 24h period. Numbers are Pearson R2 (* p<0.05). 18
19
Figure 4. Distribution pattern of PCDD/F congeners in air (sum of particuale + gas phases)
20
in both sampling sites, particulate water phase (East, middle, mid-East and West sites), 21
sediment (middle and East sites) and mussels samples (East, middle and West sites) from 22
Thau lagoon. 23
24 25
Figure 5. Distribution pattern of PCB congeners in air gas phase (G), particuale phase (P),
26
and total (G+P) in both air sampling sites, water dissolved phase (D), particulte phase 27
(SPM) and whole water (D+SPM), sediment and mussels samples (East, middle and West 28
sites) from Thau lagoon. G and P patters presented correspond to a selection of IF and BZ 29
samples. 30