Characterization and Optimization
of PDMS Microfluidic Devices
for Rapid DNA Hybridization
by
Jenny Hu
Submitted to the Department of Mechanical Engineering
in Partial Fulfillment of the Requirements for the Degree of
Bachelor of Science
at theMassachusetts Institute of Technology
June 2005© 2005 Massachusetts Institute of Technology
All rights reserved
MSSACHUSETS INS ME OF TECHNOLOGY
JUN 0 8 2005
LIBRARIES
Signature of Author
...
...
Department of Mechanical Engineering
May 6, 2005Certified
by...
Todd Thorsen
Assistant Professor of Mechanical Engineering
Thesis Supervisor
A ccepted by ...
...-.
...
Ernest G. Cravalho
Chairman, Undergraduate Thesis Committee
Characterization and Optimization
of PDMS Microfluidic Devices
for Rapid DNA Hybridization
by
Jenny Hu
Submitted to the Department of Mechanical Engineering
On May 6, 2005 in partial fulfillment of the requirements
for the Degree of Bachelor of Science in
Mechanical Engineering
ABSTRACT
Two elastomeric microfluidic devices were designed for the purpose of conducting rapid, flow-based, multiplexed DNA hybridization. Experimental results showed that flowing hybridization assays could detect similar concentrations of labeled probe as standard stationary microarrays, but in 1/O1thof the time, using 2% of the sample volume. An 8-channel device was used to spot glass slides with 64 hybridization assays and generate data supporting a theoretical model of DNA hybridization in both traditional stationary microarrays and flowing sample arrays. Larger devices were also used to create
arrays of 96x96 spots on a single slide, demonstrating the scalability of the technology. Protocols were written and optimized for the use of both chips, allowing the technology to be distributed to collaborating
labs for further development.
Thesis Supervisor: Todd Thorsen
Acknowledgements
Many thanks to my Hatsopoulos Lab buddies: Professor Thorsen, Dr. Jim Benn, JP Urbanski, and Sean Buhrmester, for good advice and good times.
Table of Contents
Chapter 1: Introduction ... 6
Chapter 2: Preparation of Experimental Components ... 8
2.1 Microfluidic Devices for DNA Hybridization ... 8
2.1 DNA Sample Preparation ... 12
Chapter 3: Experimental M ethods ... 14
3.1 Equipm ent ... 14
3.2 Array Printing and Hybridization ... 14
3.3 Experimental Protocols ... 18
Chapter 4: A Mass Transfer Theory of DNA Hybridization ... 22
4.1 Background ... 22
4.2 Theoretical Analysis ... 22
Chapter 5: 8-channel Microfluidic Device: Results and Discussion ... 31
5.1 Preliminary Results, Device Characterization and Optimization . ...31
5.2 Experimental Validation of Theoretical Model ... 37
5.3 Comparison of Microfluidic and Standard Microarrays ... 41
Chapter 6: High-throughput Hybridization in 96x96 Format ... 44
6.1 Chip Design ... 44
6.3 Experiments and Results ... 45
6.2 Discussion: Scaling Issues ... 48
6.4 Integrated Microfluidic Hybridization Platform ... 49
Chapter 7: Concluding Remarks ... 50
References ... 51
Appendix ... 54
B. Excerpts from the MIT BioMicro Center BioFabrication Master Protocol ... 55
C. Wash buffer recipes and stringency wash protocol ... 57
D. Experimental protocol for flow hybridization with 8-channel chips ... 58
Chapter 1: Introduction
The accumulation of somatic cells harboring permanent genetic change (i.e., mutations) contributes to the onset of cancer, aging and other degenerative diseases. Because most mutagens are also cytotoxic, such accumulation must also be influenced by the ability for cells to remain viable after mutagen exposure. Significant progress in identifying genes responsible for alleviating the toxic effects of carcinogenic DNA damaging agents has been made using traditional methods. Genomic phenotyping databases have been published that identify hundreds of candidate yeast (S. cerevisiae) genes important for viable cellular recovery after mutagen exposure1. Conventional approaches to identifying these candidate genes, using competitive growth assays and digital colony analysis of individual yeast gene deletion strains grown in the presence of carcinogens, have provided a wealth of data for the cancer research community. However, these methods are both time-consuming and expensive for the small laboratory.
Further progress has been made by utilizing microarrays both for gene expression and for faster evaluation of competitive growth assays. Using microarrays, it was shown that the transcriptional response of yeast genes did not necessarily correlate with genes necessary for survival when exposed to cytotoxic agents, indicating multiple pathways for cell survival2. Competitive growth assays evaluated with DNA microarrays have helped in the identification of previously uncharacterized yeast genes involved in carcinogen-induced DNA damage response'. While microarrays have been shown to be a valuable tool, their use is still too expensive and time-consuming for the evaluation of large collections of cytotoxic agents that will be needed to further elucidate the roles of individual genes in cell recovery. No microarrays containing yeast deletion strain barcodes are commercially available at this time, thus researchers must either spot their own microarrays or request their fabrication from a commercial microarray supplier. Additionally, current microarray systems only allow testing of one experimental condition at a time, making the cost of testing a panel of carcinogens prohibitively expensive.
A microfluidic array platform is being developed to allow simultaneous parallel screening of 384 targets against 384 probes on a single glass slide, which will be optimal for functional genomic assays, providing a low-cost alternative to traditional DNA microarrays. The platform will be easily implemented in any laboratory with minimal cost and infrastructure. The multiplexing capability of the microfluidic array platform will be particularly valuable for low-cost genomic phenotyping, enabling parallel analysis of hundreds of competitive growth assays on a single slide, where pooled yeast-bar code strains are subjected to multiple carcinogen concentrations.
This paper describes the testing and characterization of two smaller-scale elastomeric microfluidic devices that have been prototyped as precursors to a full 384x384 system. An 8-channel device was used to spot glass slides with 64 hybridization assays and generate data supporting a theoretical model of DNA hybridization in both traditional stationary microarrays and flowing sample arrays. Larger devices were also used to create arrays of 96x96 spots on a single slide, demonstrating the scalability of the technology. Protocols were developed for the use of both chips, and samples have been sent to collaborating labs to test ease of use.
Chapter 2: Preparation of Experimental Components
Before experiments could be performed, the microfluidic devices were fabricated and DNA samples were prepared as described below.
2.1
Microfluidic Devices for DNA Hybridization
Devices consisting of microfluidic channels that flow samples past immobilized probes are being increasingly explored because of their low cost and potential to rapidly and accurately perform
hybridization assays with small sample volumes. Platforms reported to date have used different channel dimensions, sample flow rates, and analyte concentrations, resulting in a wide range of hybridization rates4 -8. These platforms demonstrated the feasibility of using microfluidic channels for rapid hybridization; however, they were only sufficient to provide qualitative detected-not detected results.
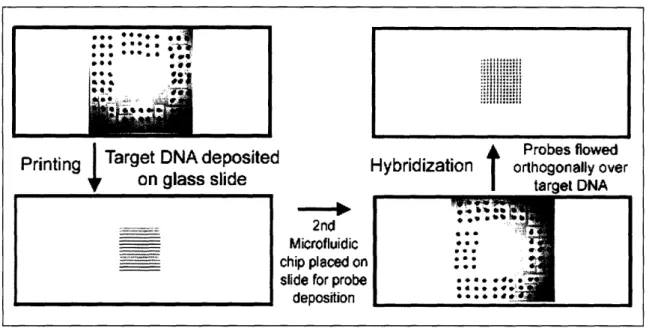
Groups of parallel microfluidic channels have also attracted interest for their ability to test many samples simultaneously, which can then be read with a single imaging step, resulting in increased accuracy. A practical approach to fabricating these multiplexed microfluidic microarrays has been to first print lines of probe using parallel microfluidic channels, and then expose targets to these lines through channels
arranged orthogonally to the lines, as shown in Figure 2.1. Historically this "checkerboard" approach has been used for membrane slot blot assays9' 10. Three laboratories have recently been active in using this format for exploring the hybridization characteristics of both nucleic acid and proteins: R. Corn at the University of Wisconsin using Surface Plasmon Resonance (SPR) for detection' 143; F. Ligler at the US
Navy Research Laboratory using Waveguides14-16; and E. Delamarche at the IBM Zurich Research
Laboratory using standard fluorescence imaging17 -1 9. These studies have demonstrated the broad utility of this platform for the qualitative detection of a wide range of interactions between nucleic acids and proteins, and identification of organisms.
. * **. U:
Ce. .Ee
9:
0
: eOf: i II t ! ! e MfK
-j
Printing Target DNA depositec
on glass slide
2nd Microfluidic chip placed on slide for probe
deposition
Probes flowed
Hybridization
orthogonally overtarget DNA n Prbe foe
Figure 2.1: Diagram showing procedure for creating checkerboard format microarrays using microfluidic chips. Parallel lines of target DNA are deposited on a glass slide by flowing spotting solutions through channels on the bottom surface of a chip sitting on the slide. The first chip is then removed from the slide, and a second chip is placed over the printed lines, with its channels in a perpendicular orientation. Each printed line is exposed to labeled probes flowing through each channel of the second chip, creating an array of square hybridization "spots."
2.1.1 Soft lithography
All microfluidic devices used in this work were prepared from polydimethylsiloxane (PDMS) using the technique of soft lithography20' 21. A basic example of soft lithography is illustrated in Figure 2.2.
spin coat photoresist on silkcon wafer
UV exposure through transparency mask
develop photoresist
cast PDMS over channels
I
Ln.
ireouinrasaecmak(o iw
remove and cut device, punch interconnect holes to channels, seal to surface
Figure 2.2: Diagram showing the steps and components used to create PDMS microfluidic devices using soft
lithography2 2.
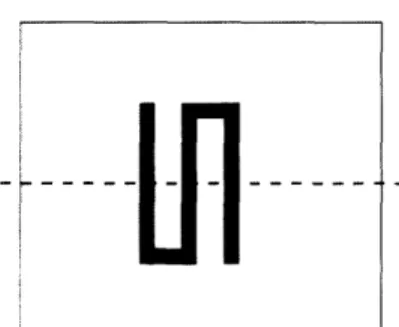
All microfluidic mold fabrication was completed in the Experimental Materials Lab (EML) at the MIT Microsystems Technology Lab (MTL). Photomasks were first designed using Adobe Illustrator 11 and printed at a linotronic resolution of 3550 dots per inch on a transparency film (Mika Color, Los Angeles, CA). The mask pattern used to create 8-channel microfluidic chips is shown in Figure 2.3.
Photolithography was used to transfer this design to 3" diameter silicon wafers to create molds for casting PDMS microfluidic devices. Wafers were first cleaned using successive washes with acetone, methanol and isopropanol, blown clean using pressurized nitrogen, then dehydrate-baked at 130 °C for 5-10 minutes to remove any remaining solvent.
Figure 2.3: Pattern for the 8-channel microfluidic device, created in Adobe Illustrator. The footprint of the channels is 20 mm x 20 mm. A high-resolution print of the pattern on a transparency was used as the photomask to transfer the pattern to a silicon wafer.
2.1.2 Mold fabrication
Microfluidic DNA printing and hybridization were carried out using devices with 10-20 pm tall channels that were slightly rounded to promote smooth flow. The 10 pm and 20 pm high masters were fabricated using positive photoresist (AZ 4620, Clariant). A single coat of AZ 4620 is limited to a height of about
10 pm. Before coating resist, a few drops of adhesion promoter are spun on wafers at 1000 rpm. First, a 10 utm layer of positive photoresist was spun at 1500 rpm for 60 seconds, followed by a 5-minute soft bake at 90 C. The wafer was cooled after removal from the oven. For 20 Jtm devices an additional layer
vvas spun coat again at 1500 rpm for 60 seconds. Another 20-minute soft bake at 90
°C
fully cured the photoresist. The mask transparency was held against the photoresist using a clear quartz plate, andexposure was done in four 16-second bursts at 4 mW/cm2. Allowing a few seconds between successive exposures prevented overheating of the resist. The mold was developed using 440 MIF (Clariant).
The channel profiles were rounded to facilitate smooth fluid flow inside the channels, and minimize obstruction of large molecules in the solution. Rounding was achieved by placing the mold on a digital hotplate at 150 C for 1 minute, causing the edges of the AZ photoresist to melt and reflow.
2.1.3 Device fabrication
The microfluidic devices were fabricated from PDMS silicone elastomer (Sylgard 184, Dow Corning). 3" silicon wafer molds were prepared as described above. To facilitate the release of the elastomer after molding, molds were pre-treated with chloro-trimethyl-silane (Aldrich) by placing the wafer in a large covered petri dish containing several drops of silane for 5 minutes. Base and curing agent components of
the elastomer were combined, typically in a 10 parts elastomer to 1 part curing agent ratio by weight. Lower ratios of elastomer to curing agent produced stiffer devices. The PDMS components were mixed together in a centrifugal mixer and degasser for 2 minutes.
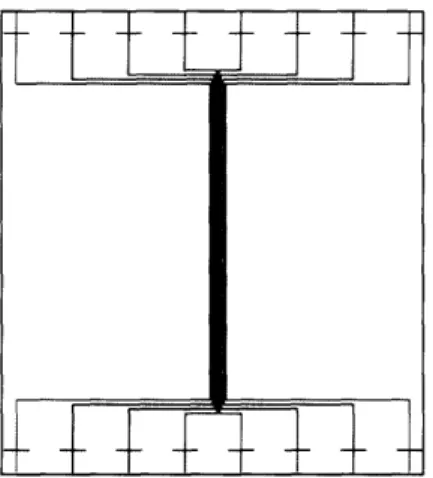
Liquid silicone elastomer was poured on the mold to a thickness of 5 mm. If any air bubbles were visible in the elastomer, the mold was placed in a vacuum chamber for 5 minutes to remove them. The mold was then covered and baked at 80 °C for 20 min. After curing, the PDMS slab was removed from the mold and excess material surrounding the channels was trimmed away to produce individual chips. Multiple small devices can be molded on the same wafer. Interconnect holes between the top surface of the device and the microchannels on the bottom were punched using 20 gauge stainless steel needle tips attached to plastic Luer lock hubs. Needle tips were sharpened by rubbing at an angle against fine-grain sandpaper prior to use, to minimize shearing of the PDMS and prevent the formation of ragged hole edges. A completed 8-channel microfluidic chip is pictured in Figure 2.4. Clean PDMS forms a hermetic seal whenever it comes in contact with another surface, so permanent bonding of the chip to a glass slide or other substrate was unnecessary. Chips were stored on plain glass slides in covered petri dishes to minimize dust accumulation.
Figure 2.4: Completed 8-channel microfluidic chip. Crosshatches on the channels were used to locate interconnect holes which were punched with a steel needle tip after molding and curing of the chip.
2.1
DNA Sample Preparation
All hybridization experiments were carried out using 60-mer oligonucleotides whose sequences were 3x repeats of 20-mer barcodes from the Saccharomyces gene deletion project. Single stranded DNA
(Qiagen) was obtained as lyophilized pellets, resuspended in TE buffer, and stored in aliquots and -20 °C. Four sequences and their labeled complements were used. Cy3 and Cy5 labels were used. The sequences
corresponded to barcodes used for the genes Magl, Apnl, Apn2, and Rad27. 60-mers and their labeled complements are referred to in the text as 3xMagl, 3xMag*3, etc., where the *3 indicates an attached Cy3 fluorophore. Sequence data is provided in Appendix A.
Spotting solutions were made by diluting unlabelled single stranded DNA in 3xSSC (sodium saline citrate) to the desired concentration. Typical spotting concentrations were 200 nM and 800 nM. The composition of the hybridization buffer used is shown below in Table 2.1. The hybridization buffer is a slight modification of the mixture used by the MIT BioMicro Center for traditional microarray
hybridizations. Formamid is included to aid in denaturing double stranded DNA. We used herring sperm as a blocking agent, but bovine serum albumin (BSA), salmon sperm, or any other unrelated DNA fragments may be substituted. Labeled DNA was pre-diluted in DEPC water before being brought to the final concentration in the hybridization buffer. The DNA concentration of the hybridization solution varied from 1 pM to 1 M.
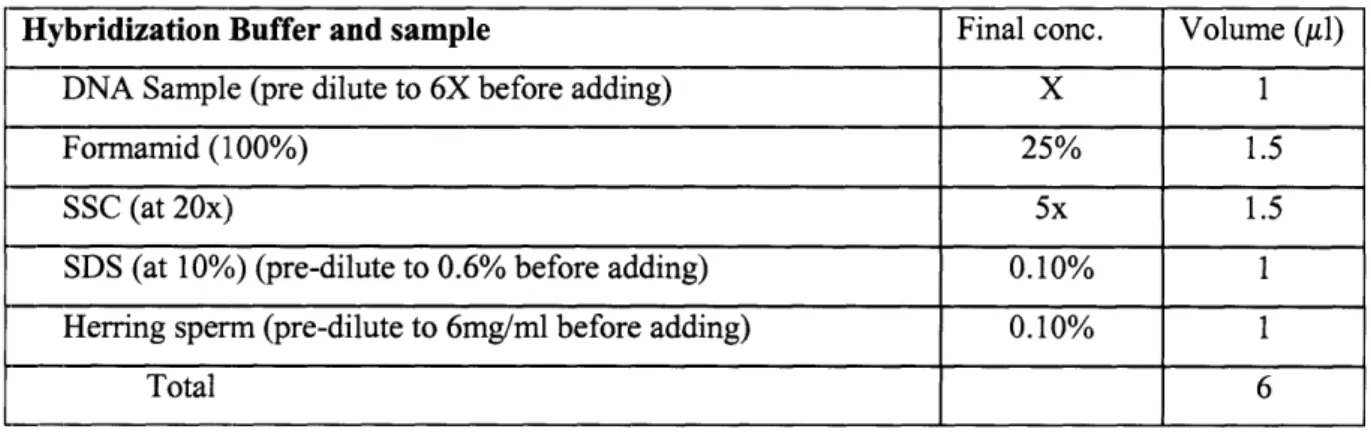
Table 2.1: Base recipe for hybridization buffer used in all experiments. Probe concentration was adjusted by pre-diluting the DNA sample to 6x the desired final concentration before mixing the buffer.
Hybridization Buffer and sample Final conc. Volume (Al)
DNA Sample (pre dilute to 6X before adding) X 1
Formamid (100%) 25% 1.5
SSC (at 20x) 5x 1.5
SDS (at 10%) (pre-dilute to 0.6% before adding) 0.10% 1
Herring sperm (pre-dilute to 6mg/ml before adding) 0.10% 1
Total 6
._
DNA aliquots and herring sperm were stored at -20 °C. All other chemicals were stored at room temperature. Spotting and hybridization solutions were usually prepared immediately prior to use,
otherwise they were stored at -20 °C until they were used. Immediately before the experiment they were thawed to room temperature, vortexed, and centrifuged to collect droplets.
Chapter 3: Experimental Methods
Experiments were performed in the Hatsopoulos Microfluids Laboratory at the Massachusetts Institute of Technology (MIT). Some slide preparation, and all data collection and processing occurred at the MIT BioMicro Center.
3.1
Equipment
All arrays were printed on gamma amino propyl silane coated glass slides (GAPS II, Coming). Flow printing and hybridization were performed with either 8 or 96-channel microfluidic devices fabricated as described in Chapter 2. A 1/4 hp compressor and a dissecting microscope were used during flow
hybridizations. Slides were UV-crosslinked using a Stratalinker 1800 (Stratagene). Traditional pin-spotted microarrays were prepared by a MicroGrid TAS arrayer (Biorobotics). A single-slide
hybridization chamber (Coming) was used to perform stationary cover-slip hybridizations. Slides were scanned using ArrayWoRx e and Auto-e biochip readers (Applied Precision, LLC), and DigitalGenome software (Molecularware) was used to collect and analyze spot intensity data.
3.2
Array Printing and Hybridization
Many steps of the printing and hybridization protocols used in the experiments were adapted from the BioMicro Master BioFabrication Protocols microarray section, as used by collaborators at the Center for Environmental Health and Sciences. Relevant pages of the Master Protocol are included in Appendix B.
3.2.1 Slide and chip preparation
GAPS II slides were stored in airtight and lightproof containers. Their surfaces were examined carefully immediately prior to use, and if any debris was visible on the slide surface, compressed nitrogen was used to blow away dust, and trapped particles were removed with tweezers.
Prior to use, each microfluidic chip was rinsed in tap water and scrubbed with fingertips and a soft sponge to remove debris from the channels and surfaces of the chip. Precipitated crystals were occasionally visible inside the channels if the chip had not been sufficiently cleaned after the preceding experiment. To remove these crystals, the chips were immersed in a wash buffer consisting of 2xSSC, 0.1% sodium dodecyl sulfate (SDS) and sonicated in an ultrasonic cleaning bath. After rinsing, the chip was
blow-dried using compressed nitrogen directed through a narrow nozzle. It was important to remove liquid droplets by blowing them off the surface of the chip instead of allowing them to evaporate, to minimize the amount of residue remaining on the chip. Chips were initially splashed with isopropyl alcohol (IPA) prior to blow-drying to speed the drying process, but IPA residue was found to be florescent under the wavelengths used by the image scanner, so IPA was not used in the final protocol.
The dry chip was examined underneath a dissecting microscope at 5-25X magnification to ensure that the channels were free of any debris such as crystals, dust, and fibers. If any debris was found, the rinsing process was repeated until the chip was clean. The clean chip was visually aligned and lowered
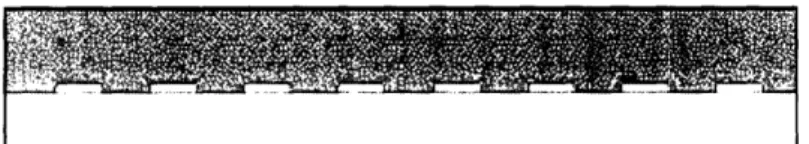
channel-side down onto a GAPS II slide. The PDMS surface formed a tight seal with the glass surface as shown in Figure 3.1. The slide was labeled using a scribe.
I~~~~~~~~~~~~~~~~~~~~
Figure 3.1: The clean PDMS (shown in blue on top) chip placed on a glass slide formed a liquid-tight seal around the channels. Scale geometry of the channels is shown. Channels were -10 gm high by 50 gim wide, and spaced
00 gm apart center-to-center.
Channel pre-treatment was performed by flowing a treatment solution straight through channels of a chip sitting on a regular (non GAPS) glass slide. Treatment solutions tested included 3xSSC and 1% herring sperm in DEPC water. After treatment, the chip was transferred to the GAPS II hybridization slide and the rest of the protocol followed as described in 3.3.2.
3.2.2 Device operation
Consistent channel orientation was used throughout all of the experiments conducted with both the 8 and 96-channel chips. The first (printing) chip was oriented such that unlabelled DNA was printed in
horizontal lines parallel to the long direction of the 25 mm x 75 mm slide. The second (hybridization) chip was placed with its channels perpendicular to the first, so that labeled DNA probes were deposited in vertical lines.
A negative pressure gradient was used to draw samples through the microfluidic channels. The
compressor was connected to a pressure regulator (1202-30, ACSI), and then to an 8-way splitter made from 8 strips of 0.020" inner diameter clear flexible Tygon tubing (Saint Gobain PPL), each terminating
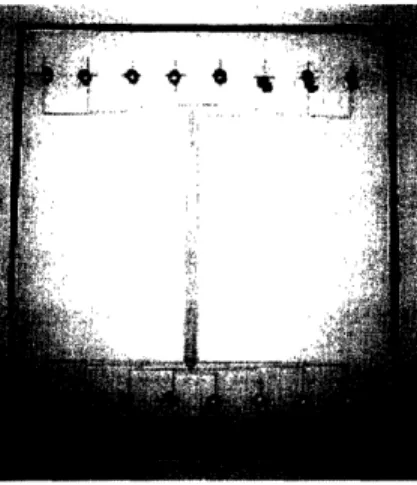
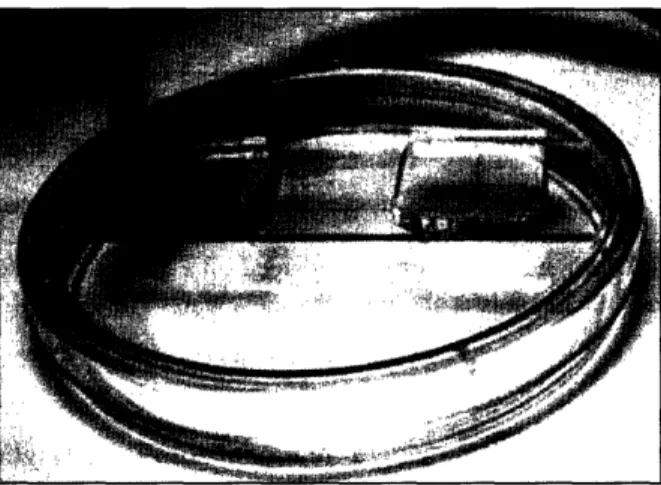
with a 23 gauge steel tube connector (New England Small Tube Corp.). Each channel has a unique input port on the top surface of the chip to allow sample to reach the channel. Every channel of the 8-channel chip also has its own outlet port. A vacuum line tip was inserted into each outlet port of a chip to applies a pressure gradient to the connected channels. Figure 3.2 shows an 8-channel device with vacuum tips inserted, ready for printing. Fluid in the channels was drawn across the chip and into the vacuum line. For the 8-channel chips, with channel lengths ranging from 1.6 cm to 3.1 cm, only 3 psig was needed to obtain flow rates of 80 nl/min. Increasing the pressure led to higher flow rates. The working volumes were small enough that only tiny droplets emerged at the other end of the tubes, so no damage was done to the regulator or compressor. Vacuum line tips were cleaned between uses by wiping them with a paper towel moistened with ethanol or IPA.
Figure 3.2; A compressor is used to generate negative pressure, which is applied to channels through tubing connected through a pressure regulator. The vacuum tubes end in metal tips that are inserted into the chips' outlet ports. The chip on the left is in printing orientation, with its channels parallel to the long edge of the slide. The chip on the right is in hybridization orientation.
For small volumes (less than 1 pl), single drops of samples were deposited on top of each inlet port using a micropipette. Larger volumes were usually dispensed gradually as fluid was drawn into the channel, to prevent spillage between ports and evaporation. The pressure gradient in the channel drew the fluid into the inlet port and then into the channel. The entire sample was usually drawn across the chip as a single continuous volume. When all of the fluid had entered the channel, a leading edge of air could be seen filling the channel behind the last of the fluid.
Vacuum tips were not removed from the outlet ports for several minutes following the visible clearing of the channels. Sample collected in the conical wells that formed at the bases of outlet ports, and additional time was required for the fluid to drain from these volumes in addition to the channels. When as much
fluid as possible had been removed from the chip, the pressure was either turned off or decreased to its minimum setting, and the chip was carefully peeled off of the slide, with care taken to not smudge the deposited lines of DNA. Chips were sonicated in 2xSSC, 0.1% SDS to remove DNA from the channels after each experiment.
3.2.3 Washing
The composition of wash buffers and detailed wash procedure are included in Appendix C. Wash buffers were mixed in 1 L batches and passed through a 0.22 pm filter prior to use. Slides were washed in 50 ml conical tubes, each containing 45 ml of fresh buffer, immediately after the hybridization chip was removed from the slide. There were four wash stages, in buffers of increasing stringency and
Technical Note 1:
Even when debris was present in a channel or between the chip and slide, almost all of the channels on each chip were able to fill with fluid. Leaking between channels occurred infrequently, but occasionally channels were observed that filled with sample but did not drain completely. Leaks occurred when the bottom surface of the chip around the channels did not seal completely against the
slide. This was usually due to a large crystal or fiber that spanned multiple channels and formed a physical barrier to the seal. The cause of a leak was not always visible under the microscope lighting, but leaks could be identified and recorded by noting when two channels filled with liquid although
sample was only deposited in one. Fluid did not drain completely from a channel under various conditions, mostly associated with debris. On some occasions, especially with large sample volumes (greater than 2 gl) of hybridization solution, crystallization of the buffer was visible on the surface of the chip and inside the channels. Small crystals were visible inside of the chip. The smallest
fragments were carried along with the fluid flow, but large fragments formed obstructions in the channrmel, especially at the entrance to the channel from the conical base of the inlet port. These obstructions sometimes halted the flow of fluid. Other times, the entire fluid sample was able to pass the obstruction, but the clearing air bubble was trapped behind, so that the channel could not drain.
Sometimes an increase in the negative driving pressure was enough to either dislodge the obstruction or break the surface tension of the fluid/air interface and allow the channel to drain. In other cases even the maximum pressure had no effect and the channel was left filled until the chip was removed from the chip. When all of the channels had been filled and drained, an attempt was made to drain any channels that were still filled with liquid from the inlet port. This was not always successful.
temperatures decreasing from 42C to room temperature. The amount of agitation was varied through experiments, and ranged from none to gentle swirling and slow inversion of the conical tubes.
3.2.4 Scanning and data analysis
After the chip was completely dry, any remaining large particles were blown off the slide using
compressed nitrogen. The back of slide could be wiped with ethanol or physically scraped using the edge of a second glass slide to removed embedded particles. The slide was then placed printed-face-down in the scanner and scanned at the appropriate wavelengths for detection of Cy3 and Cy5 fluorophores. The exposure settings used for all scans were 0.5 for Cy3 and 0.6 for Cy5. Scanned images were saved as STC files, as well as 24-bit color TIFFs for visual inspection and 16-bit grayscale TIFFs for intensity data acquisition.
3.2.5 Traditional robotic spotting
Several sets of traditional microarrays were prepared by a robotic spotter at the MIT BioMicro Center to provide comparison to the flow-based system. The spotting pattern was chosen so that rows of spots could be overlaid by the channels of a microfluidic device for flow hybridization. Spot diameters were -90 tm, and they were spaced 200 ptm apart center-to-center. Spotting concentrations ranged from 100 nMto 1 mM.
3.3
Experimental Protocols
The step-by-step protocols used to conduct experiments are available in Appendices D and E. The protocols changed as the focus of experiments shifted to collect different data, and new techniques were developed. The most recent versions of the protocols are provided.
3.3.1 Experimental parameters
Experiments were conducted over a 10-month period from June 2004 to April 2005. The protocols were adjusted to allow measurement of specific information such as the variation of intensity with
hybridization times and concentrations, and the effects of UV-crosslinking and slide washing. All of the parameters that were varied throughout experiments are shown in Table 3.1
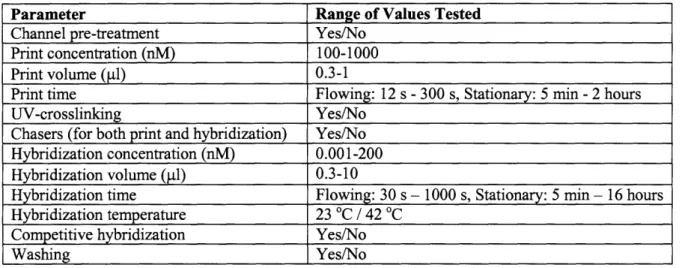
Table 3.1: Parameters that were varied across channels and chips for microfluidic hybridization, with ranges of variation.
Parameter Range of Values Tested
Channel pre-treatment Yes/No
Print concentration (nM) 100-1000
Print volume (Al)0.3-1
Print time Flowing: 12 s - 300 s, Stationary: 5 min - 2 hours
UV-crosslinking Yes/No
Chasers (for both print and hybridization) Yes/No Hybridization concentration (nM) 0.001-200 Hybridization volume (1l) 0.3-10
Hybridization time Flowing: 30 s - 1000 s, Stationary: 5 min - 16 hours Hybridization temperature 23 °C / 42 °C
Competitive hybridization Yes/No
Washing Yes/No
3.3.2 Microfluidic hybridization protocol
Three types of experiments were conducted using microfluidic hybridization devices. In the first, flow hybridization, negative pressure was applied constantly, so that fluid flowed straight through the channels without stopping. In the second, stationary microfluidic hybridization, pressure was released after fluid was drawn into the channel, so that the fluid sat in the channels without moving for some amount of time before pressure was reapplied and the fluid was drained. In both of these types of experiments,
rmicrofluidic chips were used to both print and hybridize DNA to the slide. In the final type of experiment, arrays were printed using a robotic spotter as described in 3.2.5, and then flow hybridized with a microfluidic chip.
Chips were prepared as described in section 3.2.1. The desired volume of unlabeled target sample was pipetted onto the chip and drawn into each channel. Flow time was measured from the time when fluid entered the main straight length of the channel (refer to Figure 2.3) until fluid drained past the same point. When fluid had been drained from all channels, the chip was removed and the slide was UV-crosslinked at 65 mJ. The slide was allowed to fully air-dry in a dark drawer before hybridization. A second chip microfluidic was prepared and placed on top of the slide such that its channels were perpendicular to the printed lines of DNA. Hybridization was conducted in the same manner as printing, and flow times were again recorded. Optional washing was performed and the slide was then scanned, as in 3.2.3 and 3.2.4.
To perform stationary microfluidic printing and hybridization, vacuum line tips were removed as soon as fluid had filled the channels, and the chip and slide were covered and left in a dark drawer at room
temperature for the desired amount of time. Some stationary microfluidic hybridizations were conducted at 42 °C. This was accomplished by placing the hybridization slide and filled chip in a petri dish, then in a Ziploc bag, and submerging the bag in a lightproof water bath at 42 °C. Another protocol variation used with stationary microfluidic hybridization was to rinse each channel with a "chaser" after the DNA solution was drained. Printing chasers consisted of 0.5 jl of 3xSSC, and hybridization chasers consisted of 0.5 l of blank hybridization buffer containing pure DEPC water instead of a DNA sample.
To flow hybridize quill-printed arrays, a hybridization chip was carefully aligned so that its channels overlaid the rows of printed spots as shown in Figure 3.3. Regular flow hybridization was then performed as described above.
Figure 3.3: An 8-channel microfluidic device on a slide, with channels overlapping rows of robotically printed spots, prior to flow hybridization.
3.3.3 Stationary coverslip hybridization protocol
Stationary coverslip hybridizations were performed on robotically spotted arrays. A standard microarray hybridization protocol was used (see Appendix E). Slides were UV-crosslinked following printing, but not exposed to any pre-hybridization blocking baths. The same hybridization buffer was used as for flow hybridizations. Spots were located on the slide, 35 gl of hybridization buffer was pipetted over the spots, and covered with a 20 x 20 mm cover slip. The slide was placed in a hybridization chamber along with 10 ptl of 3xSSC to preserve humidity. The sealed chamber was placed in a Ziploc bag and submerged in a 42 °C water bath for 2 to 24 hours. Following hybridization, the slide was removed from the chamber and gently submerged in a single wash solution to remove the coverslip, then blow-dried and scanned.
Technical Note 2:
For sample volumes from 0.3 pgl to 0.5 pl, flow times usually ranged from 50 s to 180 s. Two or three channels could be filled at once (it became difficult to simultaneously keep track of flow times for more channels), so filling and draining of a 8-channel chip typically took between 10 and 20 minutes. The hybridization buffer was slightly more viscous than the print solution, so flow times for hybridizations were generally longer than for printing, and flow disruptions were more likely to occur during hybridization.
The same 8-channel chip could be used to print and hybridize a slide, with rinsing between the two steps. The chip only had to be turned 90° so that the channels were perpendicular to their previous orientation. Printed lines were usually visible on the printed slides, so they could be used to place the hybridization chip in the correct region of the chip, with channels as perpendicular to the previous lines as possible.
Chapter 4: A Mass Transfer Theory of DNA Hybridization
A more complete theoretical analysis is needed to further develop the potential of microfluidic microarrays for use as rapid accurate hybridization platforms. This will enable optimization of the platforms, a more in-depth analysis and validation of sample test data, comparison of the performance of flow-based hybridization assays with conventional microarrays, and will facilitate exploring the potential for accurate high-throughput low cost testing by using the unique features of multiplexed microfluidic microarrays. We developed a theoretical model, validated by experimental data, for predicting hybridization rates in both stationary systems and microfluidic channels that includes both diffusion resistance and hybridization reaction resistance. A series of experiments were performed using an 8-channel elastomeric microfluidic microarray where parameters such as probe/target concentrations, probe printing methodologies, and sample flow rates and residence times in the microfluidic channels were varied. The results were then compared to standard microarrays. Experiments and results are discussed in Chapter 5.
4.1
Background
In a hybridization reaction, labeled molecular targets are transported from a bulk sample volume to a hybridization site by diffusion and convection. At the hybridization site, they react with, or hybridize, to a complimentary immobilized group of molecular probes. Analytical solutions for standard microarrays, where the sample volume remains stationary, have been reported for labeled targets diffusing vertically down to a hybridization surface with a finite reaction rate, and for labeled targets diffusing radially to a hybridization surface with an infinite reaction rate 23, 24. Computational solutions have also been reported
for fluidic microarrays where the sample is flowing during hybridization 5'8. There remains a need for an
analytical approach that allows prediction of overall hybridization rates in both stationary and flowing hybridization systems. Exact solutions for the combined diffusion and reaction equations governing these cases are difficult to achieve. Numerical solutions for mass transfer and chemical reaction problems are routinely used in the chemical process industry. However these solutions require extensive effort and are difficult to use for device optimization.
4.2
Theoretical Analysis
We report on linking exact solutions for diffusion equations to the hybridization reaction equations, by use of the assumption that the concentration of sample target at the hybridization site is constant. This
assumption is valid when either diffusion rates or reaction rates dominate overall hybridization rates. This results in a relatively simple analytical expression for designing and optimizing microfluidic irnicroarrays, for comparing hybridization results between different samples, and comparing results with stationary microarrays. In section 4.2.1 the overall microarray mass transfer and hybridization reaction is modeled by using a diffusion mass transfer coefficient and reaction mass transfer coefficient. Mass conservation at the hybridization site is used to link target diffusion to hybridization rate, using these
coefficients. In order to use this model, values must be obtained for the relevant mass transfer
coefficients. Sections 4.2.2 through 4.2.6 derive expressions for these values for both standard stationary microarrays and microfluidic flowing microarrays.
4.2.1 Mass conservation equation, introduction of mass transfer coefficient
Solutions to both the mass transport and kinetic reaction equations can be formulated in terms of a mass transfer coefficient, h, which relates mass concentration gradients to mass transport rates. The transport rate of target to the site is equal to the hybridization rate of target at the site, by mass conservation, and can be expressed using the mass transfer coefficient as:
Mhyb =
hdiff
(Cmean - Cwall )hyb = hreact CwallthybEquation
la
where Mhyb is the mass per unit area of a reactant that has been immobilized at a specific hybridization site, hdiff is the mass transfer coefficient resulting from diffusing and flowing target, (Cmean - CwaI ) is the difference between mean target concentration in a sample volume and concentration of the target at the hybridization site, hreact is the mass transfer coefficient resulting from target hybridization, and thyb is
total hybridization time. The reciprocal of the mass transfer coefficients can be added to eliminate Cwall
from this equation to define a total mass transfer coefficient, Htot for a hybridization platform:
Mhyb = HtotCmeanthyb Equation lb
where Hto = dif react Equation lc
When a microarray reader measures signal intensity at a hybridization site, the value recorded is proportional to the number of labels attached to the hybridized targets per unit area of the hybridization site, Mhyb. Therefore Equation lb can be rearranged to present a relationship between signal intensity
and target concentration:
SignalIntensity
Const.
= Const.
Equation ldHtotthyb Cmean
Using Equation d, the target concentration in a sample can be determined by measuring the hybridization site signal intensity, and knowing the values of
Hto
tand thyb .4.2.2 Derivation of a diffusion mass transfer coefficient for a standard microarray
Standard microarrays consist of flat surfaces that contain spots of immobilized probes. These surfaces are immersed in a stationary sample solution containing labeled targets for 16 to 24 hours to allow
hybridization to take place. Mechanically spotted microarrays typically have collections of
approximately 150 pm diameter hybridization spots at 250 gm center-to-center distances. In some cases a cover slip is placed on top of the sample, generating a container approximately 2.5 cm2 by 35 gtm high. In other cases hybridization takes place in a sample well where the height of the sample volume over the hybridization sites is in the 1 mm range.
In an attempt to develop a useful analytic model of hybridization on standard microarrays, at least two approximate approaches have been used. Pappaert modeled the hybridization process as labeled probes diffusing perpendicularly to the surface containing the hybridization site, where a first-order hybridization reaction took place 23. Gadgil modeled the hybridization process as labeled probes diffusing only radially
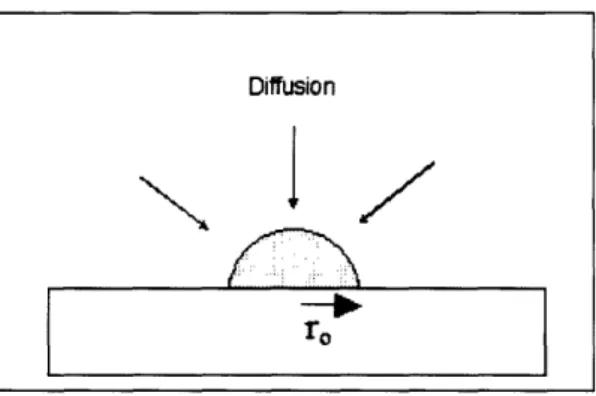
and parallel to the hybridization site, which is treated as a perfect sink. We propose a third model of the hybridization process, that of labeled probes diffusing spherically to the hybridization site, which is itself modeled as a half-sphere with radius r, as shown in Figure 4.1.
Figure 4.1: Immobilized spot of targets on a microarray, modeled as a half-sphere hybridization site with radius r0.
Labeled probe diffuses spherically towards the surface of the half-sphere.
Using spherical coordinates, the following mass transport equation applies:
ac
=
Da
-
(
r
2aC
-
,
Equation
2
At
r
2ar
arwhere r is the spherical distance from the hybridization site. Boundary conditions are C = Cwal, at
=r
0for all time, and C
=Cint at r
== = = ~~~~~~~~~~erfcl---/
o
. Substituting C = (Ci it-
Cw I) r f (r
-r
where
heifc refers to Gauss' error integral, and integrating Equation 2 with respect to time results in the following analytic expression, in terms of a mass transfer coefficient:
hdm=2
2
1 + 1.13
Drb
Equation
3
where hdiffm is the mean or average mass transfer coefficient for the total hybridization time. Equation 3 was arrived at by assuming that the wall concentration, Cwall, does not change over the hybridization time, that hdiff is independent of time, and that the sample volume had an infinite height over the hybridization site. Constant Cwall is a valid assumption for standard microarrays, as diffusion resistance
controls the overall hybridization rate, causing Cwall to be near zero. hdiff decreases with time for about the first 100 seconds, using realistic values of diffusion coefficient and hybridization site radius. It
Diffusion
X.,. J } /
then becomes independent of time, causing only a small error for hybridization times lasting hours. The heights of sample volumes on microarrays are not infinite, but are restricted in height, generally by a
coverslip placed over the sample to prevent evaporation. The sample target diffusion front will reach this
boundary in a characteristic time of ° , where do is the height of the sample volume above the
hybridization site. Standard microarray samples covered with a coverslip on a glass slide generally result in a sample volume height of 35 gl. The characteristic time for this height is about 3.2 hours, using a realistic DNA diffusion coefficient. After this time, Equation 3 provides an upper bound to mass transfer. Modeling a flat circular hybridization spot by a sphere of the same radius will over-predict
diffusion rates for the first few seconds of diffusion. However, as diffusion lengths become much longer than the sphere radius, diffusion rates become controlled by the volume around the hybridization site rather than at the site itself.
4.2.3 Derivation of a diffusion mass transfer coefficient for a microfluidic microarray
The microfluidic channels most often reported and those used in our experiments are rectangular and contain a series of individual hybridization sites on one wall, as shown in Figure 4.2.
b
Figure 4.2: Channel with aspect ratio -, where target can only hybridize to the bottom wall.
a
As sample flows down the channel, labeled targets that are exposed to complimentary hybridization sites become attached to the sites, causing a concentration profile to be established in the fluid over these sites.
Targets that are not complimentary to sites they flow over will not hybridize, and no concentration profile will develop. Because the ratio of momentum diffusivity to mass diffusivity (Re Sc ) is generally high for these systems (103), the hydrodynamic velocity profile is fully established at any given hybridization site, however the mass transfer concentration profile only begins to develop. The following mass
transport equation applies:
b
a
AC
a
2c
vx -=D
~vX
/y'-,ac~
= D '01Equation 4where vx is the fluid velocity along the channel, and y is the height from the hybridization site. Boundary conditions are C = Cwanl at y = 0, and at all other walls there is no concentration gradient.
Karlsson approximated mass transport rates in the channel shown in Figure 4.2 by use of the exact solution for mass transfer in a sample flowing between parallel-plates, as part of analyzing kinetic association and disassociation rates for proteins and DNA generated by the BiaCore SPR instrument 2 26. Mass transfer between parallel plates represent a close approximation to the case of hybridization on one surface of a wide rectangular channel for values of the non-dimensional length in the downstream
x
direction of the hybridization site, , less than 0.005, where x is the distance from the entrance dh ReSc
of the channel, and dh is the hydraulic diameter of the channel. For this case, the mass flux boundary layers developing along each plate do not intersect, therefore the mass flux characteristics of each plate are independent of each other 27. For channels with large aspect ratios, edge effects from the side walls
are minimal. Where side wall effects are significant, the parallel plate solution represents an upper bound. Adapting the parallel plate approximation suggested by Karlsson, the diffusion mass transfer coefficient can be defined as:
2 1 hdiffx =
0.98d
]
w]Equation
5a
and 21 D 3 3 hdiffm = 1.47-
]
Equation 5bwhere do is the height of the channel, w is the width of the channel, x is the distance along a
hybridization site, Q is the volumetric flow rate of the sample through the channel, and hdiffx is the local mass transfer coefficient at the position x along the hybridization site. In Equation 5b, 1 is the length of the hybridization site, and hdiffm is the average mass transfer coefficient for that length, derived by integrating Equation 5a in a mass balance equation along the length 1. Similar to the assumptions used
with stationary systems, equations 5a and 5b were arrived at by assuming that the wall concentration,
Cwai does not change over the length of the channel.
4.2.4 Reported values for DNA diffusion coefficients
DNA diffusion coefficients are proportional to absolute temperature, inversely proportional to the viscosity of the solvent, and are also influenced by the shape and dimensions of the molecules 28,29. The
DNA targets diffusing in a hybridization device are single-stranded, and can range from tens to thousands of bases long. These targets carry labels such as biotin or a fluorophore, which can generate steric hindrance effects and retard DNA diffusion rates. Stellwagen demonstrated that Equation 6a, proposed by Liu, predicted reported single-strand DNA diffusion coefficients from about 8 to 80,000 bases at 20 °C
in water 29, 30
D
= 7.38x 10⁻⁶ (B)0 53 9- Equation 6awhere D is the DNA single-strand diffusion coefficient, and B is the number of bases in the DNA strand. Tinland et al used both pKS-fluorescein and pKS-YOYO at 21
°C,
and Nkodo et al used Rox at 30°C
to measure the diffusion coefficients of labeled single-strand DNA 31, 32. Their reported diffusioncoefficients are predicted by Equation 6b:
DI
=4x10 - 6(B) -0 539, Equation 6bwhere D1 is the labeled DNA single-strand diffusion coefficient. This represents an apparent reduction
in single strand diffusion coefficient of 46% due to the presence of a label on the strand. As our data was generated with Cy3 and Cy5 labels, similar in size to the Rox label, we used these values, corrected for the increased viscosity of hybridization solution for calculating the diffusion coefficient for labeled DNA targets.
4.2.5 Derivation of a reaction mass transfer coefficient for any microarray
Hybridization kinetics follows second-order reaction dynamics in that the rate of hybridization is dependent on both the concentration of the target and probe. The conventional model of reaction rate kinetics, modified for one analyte attached to a surface, can be expressed as:
d M = kassocMimmCwa -Mhyb(kassocCwall + kdiss) Equation 7a
dt
hybwhere Mimm is moles of immobilized probe per unit area of hybridization surface available for hybridization, and kasoc and kdiss are the hybridization forward and reverse reaction rate constants. If the value of Mhyb (kassocCwall + kdiss ) remains small, then hreact remains constant over the course of a
hybridization protocol, and can be defined as:
hreact =kassocMimm Equation 7b
When the value of Mhyb (kassocCwall + kdiss ) becomes significant over the course of a hybridization, the value of hreact does not remain a constant, but will decrease until it becomes the overall rate limiter for
hybridization, and Cwall will approach Cmean. For this case an approximate value for hreact can be obtained by using:
hreact = kassocMimm - Mhyb kassoc + Ci Equation 7c
Lassoclmm
~~~~C
wallOverall mass transfer can be estimated by guessing values for Mhyb and Cwall upon completion of the
hybridization process, then solving Equation 2b for these values, and adjusting the guessed values until the two match. To achieve higher accuracy, iterative methods can be used where Htotis calculated for
one time step, then values for Mhyb and Cwall are calculated, then these are used to calculate a new Htotto
use for a new time step.
4.2.6 Reported values for DNA kinetic hybridization reaction constants
There are two reports of measuring DNA kinetic hybridization reaction rate constants using a BiaCore SPR instrument, where probes were immobilized on a dextran polymer hydrogel bonded onto a gold surface. Gotoh et al report a value for kassoc of 3 x 10⁸, and a value for kdiss of 1.3 x 1 0-4, for perfectly
matched 20-bp DNA, for a printed probe concentration of 4.8 x 10-" moles/cm2, at 37 °C 33.
Dramatically reduced equilibrium values for strands with one or more mismatched base pairs were also demonstrated. Jensen et al report values for kassoc of 1.2 x 10⁷, and a value for kdiss of 2.9 x 10- 4
, for perfectly matched 15-bp DNA, for a printed probe concentration of 1.7 x
1 0
- 8moles/cm2 at 3 5°C 34.Different vendors offer microarray slides with different substrates, which are designed to increase DNA binding capacity and reduce steric hindrance. It is expected that these substrates will act differently than
that used with the BiaCore instrument, resulting in different effective kinetic reaction rate values. Differences temperatures are also expected to affect these values 35in hybridization
Chapter 5: 8-channel Microfluidic Device: Results and Discussion
The majority of experiments were carried out using 8-channel microfluidic devices, according to the procedures described in Chapter 3. Experimental parameters and conditions were varied to characterize and optimize performance of the chips, and to streamline the protocols for their use. Quantitative data was used to validate the theoretical model developed in Chapter 4. Results of flow hybridizations were also compared to results obtained from standard stationary microarray hybridizations.
5.1
Preliminary Results, Device Characterization and Optimization
Qualitative results demonstrated that microfluidic microarrays can be used to rapidly detect specific DNA targets in the presence of competing probes and targets. Results from the variation of print times,
hybridization times, and washing steps showed that flow hybridization is preferred to stationary rnicrofluidic hybridization, and that arrays could be produced with strong, specific signals and low background fluorescence even without washing.
5.1.1 Initial testing of device design concept
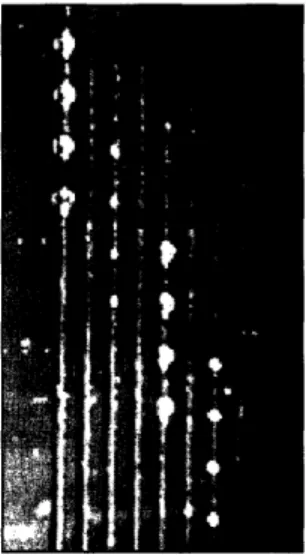
To demonstrate that the PDMS microfluidic devices could be used to deposit DNA on a glass slide, a slide was printed with labeled DNA. Figure 5.1 a shows the result of flowing decreasing 1 Ox dilutions (from right to left) of labeled 18-mer primers in 3xSSC through a chip. Clear lines of printed DNA were obtained, filling only widths of the channels without leaking into spaces between channels. Higher concentrations of DNA led to greater amounts of deposited DNA, shown by higher intensities on the scanned slide. DNA was deposited evenly along the length of the channel. Figure 5. lb shows the first 8x8 hybridization completed with the microfluidic devices. Each horizontal channel contained the same print solution, and each vertical channel contained the same hybridization solution, so the resulting array consisted of 64 identical assays. 64 independent hybridization spots were obtained, with strong signals and very low background. Spot intensities were not constant across the array, but variations were systematic; individual spot intensities could be normalized by both print and hybridization channel, yielding much more uniform results.
Figure 5.1: Results of early experiments with 8-channel microfluidic devices, demonstrating that (a) labeled DNA can be deposited on a glass slide by flowing fluid through microchannels, with deposited concentration proportional to the concentration in the fluid sample. Conditions: One hour stationary print of pure 3xSSC on the left, then increasing concentrations of 0.3 Cy3-labeled 18-mer primer from 1 pm to 1 M on the right. No chasers or washing. Slide was UV-crosslinked before scanning. (b) 64 hybridization assays in a checkerboard format produced by the microfluidic chip. Conditions: Print solution with 3xMagl, hybridization solution containing its
labeled complement, both 200 nM. All volumes were 0.5 p.l 2-hour stationary print at room temperature and 4-hour stationary hybridization at 42 C. Slide was UV-crosslinked and washed, no chasers were used.
5.1.2 Effect of printing and hybridization time on signal intensity
Two series of stationary microfluidic hybridization experiments were conducted to investigate the relationship between print and hybridization time, and intensity. The amount of time that fluid was
allowed to be stationary in the channels was varied between 0 minutes and 2 hours. Figure 5.2 shows a sample experimental setup. Each horizontal print channel (row) was filled with 200 nM 3xMagl for the specified amount of time. Hybridization channels (columns) were filled with the specific concentration of solution, and the chip was hybridized for 2 hours at 42 °C. Five similar experiments were performed with five other slides, keeping the same sample configuration, but varying hybridization times. A second series of experiments was also carried out in the same manner, varying print times across slides and hybridization times within each slide.
l M I p O.lpM O.1lpM 0.OOlpMI 1 hour 45 min 30 min 15mrain 10 min 5mnU 2 min 0 min
Figure 5.2: Sample experimental setup showing how parameters were varied in each channel. Rows represent print channels and columns represent hybridization channels. 200 nM 3xMagl was printed for different lengths of time in each print channel, and varying concentrations of 3xMag 1*3 were printed in each hybridization channel. 6 slides were prepared in this manner, and each was hybridized for a different amount of time, between 5 minutes and 2 hours. Intensity data for the shaded column is shown in Figure 5.3.
Figure 5.3 shows a cross-section of results from the first set of time-variation experiments. Intensity data points for 10 nM hybridization spots (those shaded in gray in Figure 5.2) on all 6 slides are shown. The measured intensity of hybridization spots decreased as print time increased for each of the 6 slides. There
was not a consistent relationship between intensities and hybridization times from this data set, most likely to due to slide-to-slide variation caused by inconsistencies in washing. When data from the second series of experiments was plotted, slide-to-slide variation also occurred, but within slides, a trend of decreasing intensity with increasing hybridization time was also observed.
- .
l
-.
7
14000 12000 ooo I 10000 )
k
C I 2 8000 -.S "6000-z
4000Z 4000O 2000 0 I X X. M U B *120 90 60 x30 X15 *5 M m X...
x!~~~~~~~~~
_ . A X ,t.
S
x#~*
S
I * 0 * X , / I X I 0 20 40 60 80 100 120 140Stlonary Print lime (minuts)
Figure 5.3: Normalized intensity (spot intensity - background intensity) vs. print time over varying hybridization
times (all data points for 200 nM print and 10 nM hybridization). All volumes were 0.5 pd, all slides were crosslinked and washed. Each data series represents one slide, hybridized at 42 °C for the length of time shown in the legend. Spot intensity decreased as print time increased.
The phenomenon of decreasing intensity with increasing hybridization time has also been observed with standard stationary microarrays. The most likely explanation is that DNA is rapidly deposited on the surface of the slide as fluid is flowed through the channels. While the fluid stays stationary in the channels, DNA diffuses away from the hybridization site into the fluid. The maximum rate of DNA deposition on the slide occurs when the fluid flow is continuous and the diffusion length is small.
5.1.3 Effect of washing
Data from the experiments described above illustrates the variability in results caused by washing. Stationary microarrays are washed to remove hybridization solution from the surface of the slide, and to remove loosely bound DNA that may not be fully complementary to the intended target. However, there
is a great deal of variation that can occur between different washes, considering factors such as the composition and temperature of the wash buffers, and the amount of agitation that occurs. All of these factors influence the measured intensity of the hybridization spots and the slide background. Different slides in the same batch, and even different regions of the same slide, can experience non-uniform
,ql
washing stringencies, making traditional spot-to-spot comparisons possible only after extensive calibration, and slide-to-slide comparisons extremely difficult. Elimination of wash steps from the hybridization protocol would greatly reduce slide-to-slide variability, but that benefit might come at the cost of increased background fluorescence and non-specific binding.
Using a microfluidic flow-based hybridization system, sample can be easily introduced to and removed from the slide surface by application of negative pressure to the microchannels, eliminating the need to rinse away excess solution. Flow hybridizations were performed varying hybridization temperature and the inclusion of chasers and washing in the protocol, to determine the effects on background fluorescence and hybridization specificity.
In general, background fluorescence due to the spotting and hybridization solutions was low in
comparison to the strength of positive hybridization intensities. The spotting solution, 3xSSC, was found to fluoresce at the Cy3 excitation wavelength, occasionally causing entire channels to appear green to the eye, but the image analysis software was still able to distinguish spots from background in these cases. There was usually extremely low background fluorescence in hybridization channels, due to the relatively low concentrations of labeled probe and the presence of a blocking agent (herring sperm). Chasers caused large reductions in signal with no noticeable change in background levels. Washing resulted in cleaner slides with lower backgrounds compared to unwashed slides, but also significantly reduced signal intensities, sometimes completely erasing hybridization spots resulting from low probe concentrations. Highly specific results were obtained from hybridizations performed at room temperature, even in the presence of much higher concentrations of competing probe.
It was concluded that washing led to wide slide-to-slide variation and reduction in signal, with minimal benefits. Elimination of the wash step improved detection at lower probe concentrations, while also reducing the slide-processing time by 30 minutes. In cases where a clean scan of the slide was prevented by precipitated crystals on the slide surface, a full or partial wash could be performed, and the slide then re-scanned.
5.1.4 Hybridization specificity and detection limits
4x4 arrays of serial dilutions of both spotting and hybridization solutions were flow hybridized. Figure 5.4 shows two such arrays on the same slide. 10 pM targets were detected in approximately 5 minutes. Print and hybridization times for each channel are given in parentheses to the left or top of the channel in
the figure. The calculated printed probe concentration was 10- ° moles/cm2. The Cy3 labeled targets could be detected down to the 100 pM range, and the Cy5 labeled targets could be detected down to the
10 pM range. Thee 10 pM spots are not visible in the image, but image analysis software identified spots with signal to noise ratios (SNR) above 3, the accepted threshold for registration of a positive
hybridization event. Labeled probe crossed non-complementary targets in the top-right and bottom-left areas of the image, but no non-specific binding occurred.
Figure 5.4: Two 4x4 arrays printed and hybridized using 8-channel microfluidic devices. Printed DNA
concentration was 1 010 moles/cm2. Samples were flowed through the channels, without stopping, in the times shown in parentheses next to the channels. Print concentration of both Magi and Apnl were 800 nM, and
hybridization concentrations are shown above the channels. Hybridization was conducted at room temperature. The slide was UV-crosslinked, no chasers were used, and no washing occurred.
Figure 5.5 shows successful detection of targets in the presence of competitive probe and target. While not observable from the image, 10 pM concentrations of both the Magl and Apnl DNA bar code targets could be detected in the presence of 0lx concentration of the competitive nonOcomplimentary target (e.g. concentrations of 1 pM Magl and 1 nM Apnl in the same sample). They could also be detected by probes that were 1:1 mixtures of complimentary and non-complimentary probe. Probe concentrations were 10-10°moles/cm2. Print times were about 1 minute and hybridization times were about 5 minutes.
Target DNA Magl*3 Apnl *5
_Printed
DNA
e # to ._ _
SB o U 0 Printed DNA (87s) Magi (53s) (55s) (52s) (50sos) (47s) Apnl (64s) (75s)Concentration ratio of Magi 100 10 1 1k 1k 1k 1k 1k 100 10
I
Printed probes MagI Mag 1 Apnl ApnlI
I
to Apnl, pM 1k 11
Figure 5.5: Flow hybridization of mixtures of targets at different concentration ratios, showing specific
hybridization in the presence of competing probe. Print concentrations were 800 nM of each target. All volumes were 0.5 ,tl, the slide was UV-crosslinked, no washing or chasers.
5.1.5 Flow Hybridization of Pin-spotted Slides
Figure 5.6 shows the result of an experiment where a slide printed by a robotic arrayer was hybridized using a microfluidic chip. The printed DNA probe concentrations shown were calculated to be 10-9 mroles/cm2. Target sample concentrations were 100pM, which were easily detected within the 5 minutes hybridization time.
Figure 5.6: A robotically spotted slide flow hybridized at room temperature with an 8-channel microfluidic chip. Hybridization concentration was 100 pM, no washing, no chasers.
5.2
Experimental Validation of Theoretical Model
The theory developed in Chapter 4 accurately predicted sample target concentrations where the values of diffusion and reaction mass transfer coefficients were varied over a wide range. Data was gathered in experiments where probe printing was performed by using microfluidic channels and also using a robotic quill spotter. The total mass transfer coefficient (Htot) for each hybridization site was calculated, and
was then used to predict the signal intensity that would result from hybridization, according to Equation 2d. The predictions were then compared to recorded fluorescent signal intensities for each site. Htot was
calculated as follows. The concentration of the probe printed on the slide was determined, then multiplied by the forward kinetic reaction rate constant to obtain the reaction mass transfer coefficient (hreact )
according to Equation 7b. Then the diffusion mass transfer coefficient (hdif ) was calculated using the flow parameters and diffusion coefficient for the target DNA according to Equation 5a. These were then combined and used in Equation 2 to arrive at a value for Htot, which was used to predict signal intensity as a function of target concentration and hybridization time. To calculate printed probe concentration resulting from using microfluidic channels, Equation 5 was first used in a mass-balance equation (using
the mean mass transfer constant) to calculate Cmean, the mean concentration of DNA in the flowing probe sample at the specific hybridization sites. This was necessary because the DNA is printed on the
microarray slide the full length of the microfluidic channel, resulting in a significant portion of the print DNA sample becoming lost from the sample volume to the slide before reaching the intended
hybridization site. Then this calculated concentration was used again with Equation 5 (now using the local mass transfer constant) to calculate the concentration per unit area of spotted probe (Mirm). This was then used in Equation 7b to calculate hreact. To calculate printed probe concentrations resulting from using a robotic quill pin spotter, the concentration of the probe spotting sample was multiplied by the estimated volume of probe sample volume spotted by a quill, then divided by the measured area of the resulting hybridization site.
It is proposed that reported values for DNA diffusion coefficients are valid for use with any microarray platform, because they are only influenced by fluid properties. Accordingly, the value used for the diffusion coefficient for labeled 60-mer target was 3 x 1 0-7 cm2/sec, and for non-labeled 60-mer was
7.81 x 10- 7 cm2/sec, both calculated from Equation 6a and corrected for viscosity, where the ratio of
viscosity of print solution to water was measured at 1.04, and the ratio of viscosity of hybridization solution to water was measured at 1.46. However, it is expected that reported values for reaction rate constants can only be used as first estimates, because surface-bound reaction kinetics are strongly affected by surface characteristics such as porosity and steric hindrance. Therefore, a single reaction mass transfer coefficient (hreact) was selected for best fit of all the data from all 4 slides to theory. These two constants
alone resulted in good data correlation for 82 total hybridization tests performed on 4 separate
![[PDF] Formation Perl pour débutant](data:image/gif;base64,R0lGODlhAQABAIAAAP///wAAACH5BAEAAAAALAAAAAABAAEAAAICRAEAOw==)