Contents lists available atScienceDirect
Applied Clay Science
journal homepage:www.elsevier.com/locate/clay
Research paper
Removal of Methylene Blue from aqueous solutions by adsorption on Kaolin:
Kinetic and equilibrium studies
Lot
fi Mouni
a,⁎, Lazhar Belkhiri
b, Jean-Claude Bollinger
c, Abdelkrim Bouzaza
d, Aymen Assadi
d,
Amar Tirri
b, Farid Dahmoune
e, Khodir Madani
e, Houcine Remini
eaLaboratoire de Gestion et Valorisation des Ressources Naturelles et Assurance Qualité, Faculté SNVST, Université Akli Mohand Oulhadj, Bouira 10000, Algeria bDépartement d'Hydraulique, Université de Batna, 05000, Algeria
cGroupement de Recherche Eau-Sol-Environnement (GRESE), Université de Limoges, 123 Avenue Albert Thomas, 87060 Limoges, France
dLaboratoire Sciences Chimiques de Rennes– Equipe Chimie et Ingénierie des Procédés, UMR 6226 CNRS, ENSCR, Avenue du Général Leclerc, 35700 Rennes, France eResearch laboratory of Biomathematics Biochemistry, Biophysics and Scientometrics, Université de Bejaia, 06000 Bejaia, Algeria
A R T I C L E I N F O
Keywords: Kaolin Adsorption Methylene Blue KineticsA B S T R A C T
Removal of Methylene Blue (MB) from aqueous solutions is studied using a raw Algerian kaolin sample as a low-cost adsorbent. The effects of pH, contact time, dye concentration and temperature are all taken into con-sideration. The adsorption kinetics results are adjusted to bestfit the pseudo-second order model. The experi-mental data are analyzed by Langmuir isotherms, revealing that the maximum adsorption capacity of MB on this kaolin sample equals 52.76 mg/g at T = 25 °C and pH = 6.0. The calculated thermodynamic data demonstrates that adsorption is spontaneous and enhanced at higher temperatures. Desorption studies with water indicate that the adsorbent could successfully retain MB, even after four cycles. From these results, it can be considered that the raw Algerian kaolin sample tested herein is effective in the removal of MB from aqueous solutions and moreover may be used as an alternative to high-cost commercial adsorbents.
1. Introduction
The textile industry is the major source of dyes and generates co-lored wastewater that is capable of causing severe water pollution. According to Allègre et al. (Allègre et al., 2006), dyeing 1 kg of cotton with reactive dyes requires an average of 70–150 L water, 0.6 kg NaCl and 40 g reactive dye. > 80,000 metric tons of reactive dyes are pro-duced and consumed each year, but up to 20%–30% of these applied dyes (approx. 2 g/L) is notfixed to the fabric and thus contributes to the coloration and toxicity of the effluent. Such wastewater is commonly associated with a high pH (10−11) and temperature (50°–70 °C). Co-lored dye effluents are generally considered to be toxic to the animal and plant life of a particular region and habitat (Walsh et al., 1980). Moreover, almost all dyes are poorly biodegradable or resistant to en-vironmental conditions and, therefore, create major problems in the treatment of wastewater stemming from the dyeing industry (Hao et al., 2000). As afinal consideration, dyes cannot be completely removed by means of conventional biological treatment processes, such as activated sludge and anaerobic digestion: due to their low biodegradability, nearly 90% of reactive dyes remain unchanged after undergoing an activated sludge process. Several physicochemical technologies,
including coagulation/flocculation, membrane separation, ion ex-change, chemical oxidation, electrochemical techniques, adsorption and photocatalysis, have been studied for the purpose of removing dye from wastewater (Marrot and Roche, 2002; Allègre et al., 2006; Holkar et al., 2016).
Compared with the methods cited above, the adsorption of dyes from aqueous solution has proven to be an excellent approach to treating effluents as well as a cost-effective technique. After the seminal paper by Crini in 2006 (Crini, 2006), several reviews have compiled works dedicated to removing exhausted dyes from effluent water using low-cost adsorbents, e.g. natural minerals or biological species, agri-cultural byproducts, wastes from various industrial processes (Mondal, 2008; Gupta and Suhas, 2009; Rodríguez et al., 2012; Yagub et al., 2014; Ngulube et al., 2017). Adsorption kinetics describes the decrease in aqueous adsorbate concentration from solution versus reaction time variation. During the adsorption process, four distinct steps are con-sidered: i) transport of the aqueous adsorbate to thefilm surrounding the adsorbent particle surface (this first step can be neglected if the system has been perfectly stirred); ii) external diffusion; iii) intra-par-ticle diffusion; and iv) physical or chemical surface reactions (Gadd, 2009).
https://doi.org/10.1016/j.clay.2017.11.034
Received 7 March 2017; Received in revised form 21 November 2017; Accepted 24 November 2017
⁎Corresponding author.
E-mail address:lotfimouni@gmail.com(L. Mouni).
0169-1317/ © 2017 Elsevier B.V. All rights reserved.
Clay minerals act as good adsorbents owing to their high cation exchange capacity and high specific surface areas relative to their small particle size; moreover, these minerals offer the advantage of being abundant and available at lower cost. Their surface reactions therefore produce strong biochemical and ecological effects on soils and water, hence justifying use of these materials in decontamination and re-mediation treatments (Quintelas et al., 2011; Sánchez-Jiménez et al., 2012). Kaolin is the most abundant mineral in soils and sediments; it interacts with other soil elements in contributing to the mechanical stability of the soil column (Chen et al., 2000). Kaolin has been widely used in: ceramics manufacturing (Bouzerara et al., 2009; Schroeder and Erickson, 2014), dye adsorption (Harris et al., 2001), pesticides (Sanchez-Martin et al., 2006), metal ions (Gupta and Bhattacharyya, 2012), and oil well drilling due to its rheological properties (Au and Leong, 2013).
Methylene Blue (MB), a cationic dye, was selected herein because of its widespread application in textile dyeing and by virtue of being present in the human and veterinary pharmacopoeia for a long time (DiSanto and Wagner, 1972; Oz et al., 2010). Another well-known use of MB adsorption pertains to the determination of surface properties in either (hydrated) clays or activated carbon materials (Hang and Brindley, 1970; Raposo et al., 2009). The removal of Methylene Blue, one of the most extensively applied textile dyes, from aqueous media has recently been reviewed by Kannan and Sundaram (Kannan and Sundaram, 2001) for activated carbon, and by Rafatullah et al. (Rafatullah et al., 2010) for various kinds of low-cost adsorbents.
This article will present the results obtained from experimental in-vestigations performed on MB adsorption with a low-cost sorbent, i.e. natural raw (Algerian) kaolin, denoted here as KT3B. The effects of contact time, initial dye concentration, temperature, pH and adsorbent dosage on the static adsorption of the dye onto the KT3B kaolin sample will all be examined. The pseudo-first order and pseudo-second order models will be introduced to correlate the adsorption kinetics data of MB onto kaolin. Also, the equilibrium data will be analyzed using the Langmuir isotherm model and the adsorption thermodynamics will be evaluated. Moreover, the reuse of kaolin after MB desorption will be assessed in order to minimize the method's economic cost. This fun-damental study will prove helpful for subsequent application in de-signing an adsorber for the treatment of dye-containing effluent dis-charged by the textile industry.
2. Materials and methods 2.1. Materials
The Tamazert kaolin deposit is located about 60 km north of the town of Jijel, in Eastern Algeria. A kaolin material originating from Tamazert, and industrially treated with sodium carbonate, was supplied by ENOF Ltd. (Algeria). The material was not ground because its grain size was already adequate for test purposes (i.e.≤ 60 μm); it was only air dried,first at ambient temperature (25 °C) then at 110 °C in an oven. This raw kaolin sample will be denoted KT3B in the following discus-sion.
Methylene Blue (MB, or tetramethylthionine chloride,Fig. 1; CAS Number: 122965-43-9; Color Index number CI-52015), supplied by Panreac (Spain), was selected as an adsorbate and not purified prior to use. The MB molecular properties are: molar mass (319.85 g/mol),
molar volume (241.9 cm3/mol), width (14.3 Å), depth (6.1 Å), thick-ness (4 Å), and molecular diameter (0.8 nm), according to the evalua-tions conducted by Pelekani and Snoeyink (Pelekani and Snoeyink, 2000).
2.2. Characterization
The cation exchange capacity (CEC) of the KT3B sample was de-termined by relying on BaCl2-triethanolamine (Primo-Yúfera and
Carrasco Dorrién, 1981). The specific surface area (SSA) of the KT3B sample (previously outgassed at 200 °C for 8 h under 0.1 Torr vacuum) was determined by N2adsorption at 77 °K using a Micromeritics ASAP 2020 analyzer. The particle size distribution was measured with the MICRO-P laser granularity instrument (Malvern Instruments Ltd.).
An X-ray diffraction (XRD) analysis of the samples was carried out with a Powder X-ray Diffractometer (Bruker AXS) in the 2θ angle ran-ging from 2° to 65° incremented by a 0.025° step. A scanning electron microscopy (SEM) analysis of the samples was performed using a Philips SEM-505 scanning electron microscope, operated at 300 kV/SE and 50° inclination. We also made use of an Olympus BX50 polarizing microscope.
To estimate the pH of KT3B dispersion, the following procedure was adopted (Pansu and Gautheyrou, 2003): a 2:1 (v:w) water:KT3B dis-persion was prepared and shaken for 24 h at 30 °C (Labwit ZWY-304); after 24 h, the dispersion was filtered through a Millipore 0.45 μm (Z227366 - Millex syringefilter units); and the pH of the filtrate was determined with a Jenway 3010 digital pHmeter. The FTIR spectra were obtained using a Spectrum GX spectrometer (Perkin-Elmer) at a 4 cm− 1 resolution: undiluted KT3B samples in powder form were scanned and recorded between 4000 and 400 cm− 1.
Chemical components were obtained by dry chemical analysis. Real density (volumetric mass) was measured according to the pycnometric method. The loss on ignition (LOI) was determined by weighing the sample in a crucible both before and after overnight heating at 100 °C in a muffle furnace in order to remove water.
The point of zero charge (PZC) of the KT3B was determined (Noh and Schwarz, 1989) by applying a solid-to-liquid ratio of 1:1000. To carry this step out, 0.1 mg of KT3B was added to 100 mL of water at pH varying from 2 to 12 (adjusted with concentrated HNO3and NaOH) and then stirred for 24 h. Some of the physicochemical properties of the KT3B kaolin sample are presented inTable 1.
2.3. Analysis of Methylene Blue concentration
Methylene Blue (C16H18ClN3S·2H2O, MB) was selected as the ad-sorbate species. The dye stock solutions were prepared by dissolving accurately weighted dye powder in Milli-Q water at a concentration of 1000 mg/L. The experimental solutions were derived by diluting the dye stock solutions in precise proportions to different initial con-centrations. The pH of these solutions was adjusted to the desired value
Fig. 1. The chemical structure of MB.
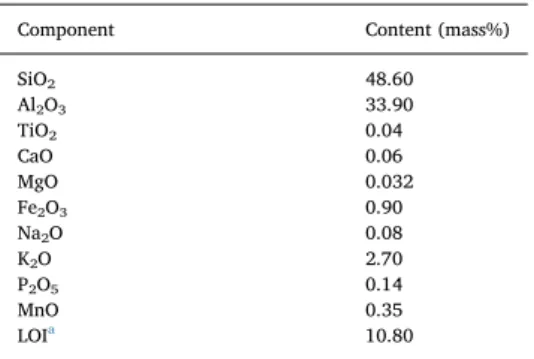
Table 1
Composition of the raw kaolin sample KT3B.
Component Content (mass%)
SiO2 48.60 Al2O3 33.90 TiO2 0.04 CaO 0.06 MgO 0.032 Fe2O3 0.90 Na2O 0.08 K2O 2.70 P2O5 0.14 MnO 0.35 LOIa 10.80 aLoss on ignition.
by adding a small quantity of 0.1 mol/L HCl and/or 0.1 mol/L NaOH. The MB concentration in the supernatant solution before and after adsorption was determined using a UV spectrophotometer (Shimadzu UV Mini-1240) at 663 nm. The calibration curve was highly re-producible and linear over the concentration range targeted by this work (i.e. from 2 to 80 mg/L). All experiments were carried out in triplicate, with all data being calculated and the average values taken to represent the result.
2.4. Adsorption studies
Batch adsorption experiments were performed in a set of Erlenmeyerflasks (250 mL), each of which contained 100 mL of dif-ferent MB concentrations (80–250 mg/L) along with 50 mg of ad-sorbent. An orbital shaker (Labwit ZWY-304) was introduced at a de-sired temperature and pH. To reach steady-state adsorption, a time contact equal to 180 min was set for all experiments. After 180 min, the dispersion wasfiltrated with Millipore 0.45 μm (Millex syringe filter units) and thefiltrate was analyzed by UV/visible spectrophotometry at λ = 663 nm.
Equilibrium experiments were conducted for various times, while the pH was gradually adjusted by adding small amounts of diluted HCl or NaOH solutions (0.1 mol/L). The adsorbed amount of MB at equili-brium was calculated by the following equation:
= − ×
qe (C0 Ce) V m/ (1)
where qe(mg/g) denotes the equilibrium adsorption capacity of MB adsorbed per gram of the KT3B, C0 and Ce (mg/L) the initial and equilibrium MB concentrations respectively, V the volume of the MB solution (L), and m the kaolin mass (g). Each experiment was performed at least in duplicate under identical conditions. Two separate tests showed that the standard deviation of the measurement equaled ± 2.0%. The adsorption percentage (% removal) of MB from aqueous solution can be calculated as follows:
= × C −C C
Removal percentage 100 ( 0 e)/ 0 (2)
2.5. Desorption experiments
First of all, the kaolin was heavily loaded with MB by mixing 0.1 g of the KT3B sample with 100 mL of the dye solution (80 mg/L); the mixture was shaken for 2 h. The KT3B loaded with MB was separated by filtration and then mixed several times with 100 mL of distilled water on the orbital shaker; the concentrations of MB in the eluate were de-termined in order to investigate desorption efficiency.
2.6. Error analysis
Each experiment or analysis was at least duplicated, often tripli-cated; in allfigures, the size of symbols includes the standard deviation from experimental data (3% to 5%).
The unknown constants in the model equations for kinetics and isotherm studies were obtained using nonlinear least-squares (NLLS) data processing with the Origin 8.0 software at the 95% confidence level.
In these single-component isotherm studies, the optimization pro-cedure requires an error function to be defined in order to evaluate the fit of the isotherm equation to the experimental equilibrium data. In this study, the linear coefficient of determination (R2), the non-linear Chi-square test (χ2) and the root mean square error (RMSE) statistical tests were all performed for both the kinetics and isotherm models. The corresponding mathematical equations are then:
∑
= −
χ2 (qe exp qe calc) /qe calc
, , 2 , (3)
∑
= −
RMSE [ (qe exp, qe calc, ) / ]2 n1/2
(4)
where qe,exp (mg·g− 1) is the experimental data of the equilibrium ca-pacity, and qe,calc (mg·g− 1) the equilibrium capacity obtained from model calculations. If the model data are similar to the experimental data, thenχ2will be a smaller number; if they differ, χ2will be a higher one. It is necessary therefore to analyze the data using the non-linear Chi-square test so as to confirm the best-fit isotherm for this adsorption system (Vimonses et al., 2009).
3. Results and discussion
3.1. Characterization of the KT3B kaolin sample
The chemical composition of the KT3B sample used for sorption experiments is provided inTable 1. The material analysis has revealed that the sample contained mainly silica and alumina, which accounted for 82.5% of the total mass. The X-ray diffraction of this KT3B raw sample indicated the presence of quartz (12.36%) and kaolinite (61.78%) as major phases (Fig. 2). Kaolinite is a well-defined, naturally occurring 1:1 aluminosilicate mineral [Al2Si2O5(OH)4or Al2O3·2 SiO2·2 H2O] with an anorthic (triclinic) lattice structure composed of one sheet of corner-sharing tetrahedrons and one of Al octahedra. The potential adsorption sites on kaolin include the silanol≡SiOH and aluminol ≡AlOH (either at the surface or inside), hydroxyl groups on the mi-neral edges and the permanently charged sites≡X−on the basal sur-face, although such negative charges due to isomorphous substitution are usually very small.
The CEC value of the KT3B sample is 2.7 cmol(+)/kg, lower than that reported by Miranda-Trevino and Coles (Miranda-Trevino and Coles, 2003); thisfinding is mainly due to the high amount of illite (27.02%), which is capable of increasing the PZC, CEC and SSA of the kaolin (Tschapek et al., 1974). The grain-size distribution of KT3B was characterized by values typically < 2μm (Fig. S1 - see the Supple-mentary Informationfile); a distribution maximum is observed in the
2–0.5 μm fraction with about half the total mass.
The BET/N2 specific surface area of flakes equaled 21.27 m2/g while their average pore diameter was 212.38μm (Table 2); such va-lues are similar to those given byZhang et al. (2015). Hence, the MB species can easily enter into the kaolin pores; such a finding can be confirmed by both the polarizing microscope and SEM images (Fig. S2 in the Supplementary information file). As regards the surface mor-phology of KT3B, SEM data indicate that this kaolin sample presents flaky-shaped particles. The FTIR spectrum revealed (Fig. 2) bands be-tween 3697 cm− 1and 3622 cm− 1, corresponding respectively to the OH stretching vibrations of the surface and inner AleOH groups of kaolinite. The bands at 992 cm− 1to 1112 cm− 1can be ascribed to the stretching vibrations of the SieOeSi of kaolinite or quartz; the band at 696 cm− 1is commonly attributed to out-of-plane SieO stretching, and that at 798 cm− 1 to OH deformation linked to Al. The band at 3598 cm− 1was attributed to the stretching of the OH bonded to Fe3 +, with a slight shoulder at 875 cm− 1(strain OH) corresponding to the presence of iron in the kaolinite structure, with Fe3 +ions occupying octahedral sites by means of substitution for Al3 +cations (Zhang et al.,
2015).
3.2. Effect of contact time on MB removal
The adsorption dynamics of the MB solution/KT3B system strongly depend on the contact time. A contact time optimization for the above system was therefore carried out in batch mode. The extent of MB re-moval by KT3B at different shaking times up to 180 min, while im-posing a constant settling time, is shown in Fig. 3. MB adsorption reached a maximum after a very short time of equilibrium, thus sug-gesting an almost instantaneous MB removal from water. From these data, we selected a contact time of 120 min for all adsorption experi-ments.
3.3. Effect of pH on MB adsorption
The adsorption process is greatly affected by the change in pH of the solution. The effect of solution pH generally depends on the ions pre-sent in the reaction mixture as well as on electrostatic interactions with the adsorption surface. Solution pH would influence both aqueous chemistry and surface binding sites of the adsorbents.
The highest adsorption capacity was obtained at pH = 9, while the maximum adsorption efficiency amounted to 99.9 mg/g (Fig. 4).
The variation in MB uptake with respect to the initial solution pH can be explained with respect to the point of zero charge (PZC) of KT3B. For the raw kaolin sample, the point of zero charge was measured at 6.7 ± 0.1. Above this pH value, the kaolin particles acquired negative surface charges, leading to a stronger electrostatic attraction relative to the MB cationic dye. At a pH below PZC, the kaolin surface acquired positive charges and given that the dye molecules also carried a positive charge, an electrostatic repulsion caused a decrease in dye uptake.
3.4. Effect of ionic strength
The effect of ionic strength on dye uptake was studied by adding an NaCl concentration ranging from 0.01 to 0.50 mol/L. An increase in ionic strength resulted in the decrease in MB removal capacity of KT3B (Fig. 5), as had previously been observed by others (Rida et al., 2013). The presence of salt (NaCl) in the solution may have shielded the electrostatic interaction between opposing charges at the solid sorbent surface and on dye molecules, which resulted in the adsorbed amount decreasing with the increase in NaCl concentration (i.e. salting out
Table 2
Surface properties of the raw kaolin sample KT3B.
Parameter Value
Average particle size (μm) ˂15
BET specific surface area (m2/g) 21.27
Total pore volume (mL/g) 0.056
Average pore diameter (μm) 212.38
Density (g/cm3) 0.6
PZC 6.7
CEC (cmol(+)/kg) 2.7
Fig. 3. Effect of initial MB concentration and contact time with regard to MB adsorption onto kaolin at pH = 6.0, S/L = 0.5 g/L.
Fig. 4. Effect of pH on MB adsorption on the KT3B kaolin sample at 25 °C (C0= 100 mg/
L, S/L = 0.5 g/L, contact time = 120 min).
Fig. 5. The effect of ionic strength (NaCl) on dye removal efficiency at pH = 6 (C0= 100 mg/L, S/L = 0.5 g/L).
effect).
3.5. Effect of temperature
To evaluate the effect of temperature on the adsorption capacities of the kaolin for MB, batch adsorption studies were carried out in the 25°–50 °C temperature range. The adsorption capacities of the kaolin for MB increased slightly with an increase in temperature (Fig. 6). This behavior was obvious because as temperature rises, solution viscosity drops, which is favorable to the subsequent adsorption stages: external transfer, and diffusion of adsorbate within the adsorbent solid. This increase may be due to: i) the increase in dye mobility, allowing it to penetrate the sample pores; ii) the increase in chemical interactions between the adsorbate and surface functionalities of the adsorbent; and iii) the change in chemical potentials, correlated with adsorbate species solubility.
3.6. Effect of adsorbent dosage
Several steps were observed (Fig. 7) from the results of experiments with varying adsorbent concentrations (from 0.1 to 1 g/L). Initially, a rapid increase in adsorption with an increase in adsorbent quantity can be attributed to a greater surface area and the availability of more adsorption sites. Beginning with an adsorbent concentration equal to
0.5 g/L, at which point approx. 97.5% of the dye becomes adsorbed, the adsorption rate was gradually lowered until reaching a maximum value of around 97% adsorption. Thus, an optimal KT3B dosage for MB ad-sorption was found to be 1.0 g/L. All active sites on the adsorbent surface were then occupied, and any increase in adsorbent dosage did not yield a higher MB uptake.
3.7. Kinetic studies
Wefirst of all investigated the kinetics of adsorption, which is cri-tical to process efficiency. Two well-known adsorption kinetic models were used in this work: the pseudo-first order Lagergren equation and the pseudo-second order rate equation were bothfitted with the ex-perimental data (Limousin et al., 2007).
The pseudo-first order equation is based on the assumption that the rate of change in solute adsorption over time is directly proportional to the difference in saturation concentration and the amount of adsorptive solid uptake over time (Ho, 2004). The corresponding differential equation is written as:
= −
dq dtt/ k q1( e qt) (5)
Integrating Eq.(5)for the boundary conditions t = 0 to t = t and qt= 0 to qt= qtyields:
− = −
q q q k t
Ln( e t) Ln e 1 (6)
Let's note that k1and qecan be determined from the slope and in-tercept of the plots of Ln(qe− qt) vs. t for various experimental con-ditions.
The removal data were also analyzed by the pseudo-second order kinetic model, expressed as follows (Ho, 2006):
= −
dq dtt/ k q2( e qt)2 (7)
Integrating Eq.(7), using the boundary conditions at t = 0, qt= 0 and for any time t, with the amount of dye adsorbed being qtand in rearranging the corresponding rate law, generates:
= +
qt k q2 e2t/(1 k q t2 e ) (8)
In Eq.(8), k2(g/(mg.min)) is the pseudo-second order rate constant, and qeand qt(mg/g) are the values of the amount adsorbed per unit mass at equilibrium and at any time t, respectively.
Thefirst-order kinetic curves from this study did not fit well with the experimental data (not shown). The pseudo-second order equation however did provide an excellentfit (Fig. 8), with a regression coeffi-cient R2≥ 0.99 for all systems and a favorable value of RMSE (Table 3). The calculated qevalues from the model were also in good agreement with experimental values (Table 3). The kinetics of MB sorption on the KT3B sorbent thus follow the pseudo-second order rate expression.
Fig. 6. Influence of temperature on MB dye removal efficiency for KT3B kaolin (ad-sorbent dosage S/L = 0.5 g/L, pH = 6.0, contact time = 120 min).
Fig. 7. Effect of adsorbent concentration on the MB adsorption percentage, C0= 100 mg/
L.
Fig. 8. Pseudo-second order plots for the adsorption of MB onto KT3B at various initial concentrations, pH = 6.0, S/L = 0.5 g/L, T = 25 °C.
3.8. Isotherm experiments
An adsorption isotherm describes the equilibrium between ad-sorbent and adsorbate, i.e. in this case the relationship between the quantity of dye adsorbed and that remaining in aqueous solution at a fixed temperature at equilibrium. The isotherm thus yields a number of parameters whose values express the surface properties and affinity of the adsorbent. In order to optimize the design of an adsorption system to remove dyes from effluents, it is important to establish the most appropriate correlation for the equilibrium data.
The Langmuir isotherm equation (Limousin et al., 2007), which assumes a monolayer sorption of dye molecules on the sorbent surface, is expressed as follows:
= +
qe qmaxK CL e/(1 K CL e) (9)
where qeis the adsorbed amount of dye at equilibrium (mg/g), Cethe equilibrium concentration of the dye in solution (mg/L), qmax the maximum adsorption capacity (mg/g), and KLthe constant related to the free energy of adsorption (L/mg). According to the plot of experi-mental data at different pH values (Fig. 9), the Langmuir isotherm model was found tofit closely with these experimental data, as wit-nessed by the coefficient of determination R2inTable 4. The other two statistical parameters (χ2and RMSE) also confirmed the quality of this fit.
One essential characteristic of the Langmuir equation can be ex-pressed in terms of the dimensionless factor RL(Hall separation factor), which is calculated (Weber and Chakravorti, 1974) as follows:
= +
RL 1/(1 K CL e) (10)
where KLis the Langmuir constant (L/mg) and C0the initial MB con-centration (mg/L); RLis indicative of the isotherm shape and predicts whether a sorption system is favorable (0 < RL< 1) or unfavorable (RL> 1).
In the present study, the calculated RLvalues for the adsorption of
MB on the KT3B kaolin sample were found to equal 0.0118, 0.0094, 0.0079 and 0.0063 at initial concentrations of 80, 100, 120 and 150 mg/L, respectively. These RL values confirmed that KT3B is fa-vorable for adsorbing MB from water under the conditions applied in this study.
3.9. Thermodynamic analyses
Thermodynamic parameters, including Gibbs free energy change (ΔG°), enthalpy change (ΔH°) and entropy change (ΔS°), serve to eval-uate the effect of temperature on the adsorption of MB onto kaolin and provide in-depth information regarding the inherent energy changes associated with the adsorption process (Salvestrini et al., 2014). These parameters are calculated from the following equation:
= −
° °
ΔG RTLnKL (11)
where R is the universal gas constant (8.314 J/mol K), T the tempera-ture (K), and KL° the (dimensionless)‘thermodynamic’ Langmuir con-stant for the adsorption process. To obtain this value from the value KL (in L/mg) calculated from isotherm data (seeSection 3.8), we had to change all concentrations to molar form and take into account the standard state C° = 1 mol/L (Salvestrini et al., 2014; Zhou and Zhou, 2014):
= × × ×
° °
KL KL(L/mg) 1000 (mg/g) MMB(g/mol) C (mol/L) (12) where MMB= 319.85 g/mol is the MB molar mass, and the factor 1000 allows converting g to mg.
The enthalpy (ΔH°) and entropy (ΔS°) parameters were estimated from the classical relationships:
= − ° ° ° K ΔS R ΔH RT Ln L ( / ) ( / ) (13) = − ° ° ° ΔG ΔH T ΔS (14)
The plot of LnKL° versus 1/T yielded a straight line (Fig. S3 in the Supplementary Informationfile), and the values of ΔH° (kJ/mol) and ΔS° (J/mol K) can be calculated from the intercept and slope of these Van 't Hoff plots, respectively. The values of ΔG° (kJ/mol) were re-calculated fromΔH° and ΔS° (seeTable 5). The positive values ofΔH° are indicative of an endothermic adsorption process; bothΔH° and ΔS° decreased with an increase in pH. The negative values of ΔG° were
Table 3
Kinetic parameters involved in MB removal by KT3B (pH = 6.0, T = 25 °C). C0(mg/L) k2(g/mg·min) Pseudo 2nd order model
qe,(exp)(mg/g) qe(cal)(mg/g) R2 RMSE
80 0.037 36.80 36.98 0.997 0.333
100 0.042 42.90 43.03 0.991 1.727
120 0.040 44.7 43.96 0.986 1.686
Fig. 9. The Langmuir adsorption isotherm for MB adsorption on KT3B (adsorbent dosage: 0.5 g/L, T = 25 °C), as a nonlinear expression.
Table 4
Parameters of Langmuir isotherm for MB adsorption onto KT3B kaolin (T = 25 °C).
pH qmax(mg/g) KL(L/g) R2 χ2 RMSE
2 42.60 0.84 0.997 0.218 1.028
6 52.76 1.04 0.975 0.407 3.47
9 72.57 0.96 0.980 0.361 2.67
Table 5
Thermodynamic parameters for MB adsorption on KT3B. pH T (K) KL (L/ mg) KL° (dimensionless) LnKL° ΔG° (kJ/ mol) ΔH° (kJ/ mol) ΔS° (J/ K/mol) 2 298 0.84 268674 12.50 −31.90 25.08 191.22 303 1.03 329445.5 12.70 −32.85 313 1.18 377423 12.84 −34.76 323 1.47 470179.5 13.06 −36.68 6 298 1.04 332644 12.71 −31.54 17.11 163.28 303 1.27 406209.5 12.91 −32.36 313 1.47 470179.5 13.06 −33.99 323 1.85 591722.5 13.29 −35.62 9 298 1.17 376143.6 12.83 −31.05 16.51 159.62 303 1.57 502164.5 13.12 −31.85 313 2.00 641299.25 13.37 −33.45 323 2.71 866793.5 13.67 −35.04
found to slightly increase as temperature increases from 298° to 323 K. NegativeΔG° values confirmed the feasibility and spontaneity of the adsorption process.
3.10. Desorption studies
Recycling the adsorbent is considered to be an important economic aspect in minimizing material costs. Since the present study was un-dertaken within the framework of a sustainable development approach, we decided to limit our desorption tests to water rinses only. The use of chemical reagents would indeed be more efficient, but such an ap-proach would simultaneously produce potentially hazardous leachates, which would need to be disposed of properly and, hence, outside the scope of our project.
The adsorption/desorption experimental cycles were carried out up to three times. After four cycles, the adsorption capacity of MB on ad-sorbent decreased from 56% to 23% (Fig. 10). This behavior indicates that the adsorbent can successfully hold MB after its adsorption from aqueous solution.
3.11. Comparison of adsorption capacity with other available adsorbents The adsorption capacity of KT3B kaolin was compared with a se-lection of other clayey adsorbents (Table 6). These data clearly
demonstrated that the present raw kaolin KT3B sample adsorbent was effective in the removal of MB dye from the aqueous phase and, as expected, compared well with other clay materials.
4. Conclusion
The selected raw kaolin KT3B sample proved to be an effective adsorbent for the removal of MB from aqueous solution. The percentage of adsorption was maximal at a pH value of 9.0 and decreased in more acidic MB solutions. At an initial dye concentration of 100 mg/L, the percentage of adsorption decreased from about 98% to 68% as pH dropped from 10 to 2. The adsorption equilibrium was attained within times of < 30 min. The adsorption kinetics was well described by the pseudo-second order model equation. An adsorption isotherm was fitted by the Langmuir model, with the maximum adsorption capacity of MB on KT3B was calculated at 52.76 mg/g at 25 °C and pH = 6. These results also revealed that the process was more efficient at higher temperatures. The thermodynamic activation parameters showed that the process was endothermic.
Our results therefore indicate that a raw kaolin sample, like the KT3B used in this work, can be successfully utilized for the adsorption of Methylene Blue dye from aqueous solutions.
Disclosure statement
No potential conflict of interest was reported by the authors. Funding
This research did not receive any specific grant from funding agencies in the public, commercial, or not-for-profit sectors.
Appendix A. Supplementary data
Supplementary data to this article can be found online athttps:// doi.org/10.1016/j.clay.2017.11.034.
References
Allègre, C., Moulin, P., Maisseu, M., Charbit, F., 2006. Treatment and reuse of reactive dyeing effluents. J. Membr. Sci. 269, 15–34.
Almeida, C.A.P., Debacher, N.A., Downs, A.J., Cottet, L., Mello, C.A.D., 2009. Removal of methylene blue from colored effluents by adsorption on montmorillonite clay. J. Colloid Interface Sci. 332, 46–53.
Au, P.I., Leong, Y.K., 2013. Rheological and zeta potential behaviour of kaolin and bentonite composite slurries. Colloids Surf. A 436, 530–541.
Auta, M., Hameed, B.H., 2012. Modified mesoporous clay adsorbent for adsorption iso-therm and kinetics of methylene blue. Chem. Eng. J. 198–199, 219–227. Bouzerara, F., Boulanacer, S., Harabi, A., Boudaira, B., Achour, S., 2009. Preparation and
characterization of macroporous ceramic supports for membranes. Phys. Procedia 2, 1449–1453.
Chen, J., Anandarajah, A., Inyang, H., 2000. Porefluid properties and compressibility of kaolinite. J. Geotech. Geoenviron. Eng. 126, 798–807.
Crini, G., 2006. Non-conventional low-cost adsorbents for dye removal: a review. Bioresour. Technol. 97, 1061–1085.
DiSanto, A.R., Wagner, J.G., 1972. Pharmacokinetics of highly ionized drugs I: methylene blue– whole blood, urine and tissue assays. J. Pharm. Sci. 61, 598–602. El-Mekkawi, D.M., Ibrahim, F.A., Selim, M.M., 2016. Removal of methylene blue from
water using zeolites prepared from Egyptian kaolins collected from different sources. J. Environ. Chem. Eng. 4, 1417–1422.
Gadd, G.M., 2009. Biosorption: critical review of scientific rationale, environmental im-portance and significance for pollution treatment. J. Chem. Technol. Biotechnol. 84, 13–28.
Gao, W., Zhao, S., Wu, H., Deligeer, W., Asuha, S., 2016. Direct acid activation of kao-linite and its effects on the adsorption of methylene blue. Appl. Clay Sci. 126, 98–106. Ghosh, D., Bhattacharyya, K.G., 2002. Adsorption of methylene blue on kaolinite. Appl.
Clay Sci. 20, 295–300.
Gupta, S.S., Bhattacharyya, K.G., 2012. Adsorption of heavy metals on kaolinite and montmorillonite: a review. Phys. Chem. Chem. Phys. 14, 6698–6723.
Gupta, V.K., Suhas, 2009. Application of low-cost adsorbents for dye removal– a review. J. Environ. Manag. 90, 2313–2342.
Gürses, A., Dogar, C., Yalçın, M., Açıkyıldız, M., Bayrak, R., Karaca, S., 2006. The ad-sorption kinetics of the cationic dye methylene blue onto clay. J. Hazard. Mater. B131, 217–228.
Fig. 10. Effect of desorption cycles on MB removal (adsorbent dosage = 0.5 g/L, dye solution pH = 6.0).
Table 6
Maximum loading capacity (Langmuir model) for MB on selected clayey materials.
Adsorbent Capacity (mg/g) at
given T (°C)
Reference
Montmorillonite 289.12 (35 °C) Almeida et al. (2009) Natural clay (Turkey) 58.2 (20 °C) Gürses et al. (2006) Ball clay (Malaysia) Raw 25.01 Auta and Hameed (2012)
Modified 62.50 (30 °C)
Kaolinite 45.45 Sarma et al. (2011)
Montmorillonite 163.93 (30 °C)
Kaolin (Persia) 28.95 (25 °C) Tehrani-Bagha et al. (2011) Natural zeolite 21.78 (30 °C) Wang and Zhu (2006) Natural clay (Portugal) 22.2 Hajjaji et al. (2016) Commercial kaolin 23.1 (20 °C)
Raw coal-bearing kaolin 78.1 Gao et al. (2016) Acid-activated kaolin 101.5 (22 °C)
Zeolites from kaolin (Egypt)
11.13 to 21.41 (25 °C)a
El-Mekkawi et al. (2016)
Kaolin Raw 13.99 Ghosh and Bhattacharyya
(2002) Pure 15.55 (RT)b
Kaolinite 102.04 (25 °C) Krishnan et al. (2015) Raw KT3B kaolin (Algeria) 52.76 (25 °C) Present study
aAccording to sample. bRT = at room temperature.
Hajjaji, W., Andrejkovičová, S., Pullar, R.C., Tobaldi, D.M., Lopez-Galindo, A., Jammoussi, F., Rocha, F., Labrincha, J.A., 2016. Effective removal of anionic and cationic dyes by kaolinite and TiO2/kaolinite composites. Clay Miner. 51, 19–27. Hang, P.T., Brindley, G.W., 1970. Methylene blue absorption by clay minerals.
Determination of surface areas and cation exchange capacities [clay-organic studies XVIII]. Clays Clay Miner. 18, 203–212.
Hao, O.J., Kim, H., Chiang, P.C., 2000. Decolorization of wastewater. Crit. Rev. Environ. Sci. Technol. 30, 449–505.
Harris, R.G., Wells, J.D., Johnson, B.B., 2001. Selective adsorption of dyes and other organic molecules to kaolinite and oxide surfaces. Colloids Surf. A Physicochem. Eng. Asp. 180, 131–140.
Ho, Y.S., 2004. Citation review of Lagergren kinetic rate equation on adsorption reac-tions. Scientometrics 59, 171–177.
Ho, Y.S., 2006. Review of second-order models for adsorption systems. J. Hazard. Mater. B136, 681–689.
Holkar, C.R., Jadhav, A.J., Pinjari, D.V., Mahamuni, N.M., Pandit, A.B., 2016. A critical review on textile wastewater treatments: possible approaches. J. Environ. Manag. 182, 351–366.
Kannan, N., Sundaram, M.M., 2001. Kinetics and mechanism of removal of methylene blue by adsorption on various carbons– a comparative study. Dyes Pigments 51, 25–40.
Krishnan, K.A., Ajmal, K., Faisal, A.K., Liji, T.M., 2015. Kinetic and isotherm modeling of methylene blue adsorption onto kaolinite clay at the solid-liquid interface. Sep. Sci. Technol. 50, 1147–1157.
Limousin, G., Gaudet, J.P., Charlet, L., Szenknect, S., Barthès, V., Krimissa, M., 2007. Sorption isotherms: a review on physical bases, modelling and measurement. Appl. Geochem. 22, 249–275.
Marrot, B., Roche, N., 2002. Wastewater treatment and reuse in textile industries, a re-view. Res. Adv. Water Res. 3, 41–53.
Miranda-Trevino, C., Coles, C.A., 2003. Kaolinite properties, structure and influence of metal retention on pH. Appl. Clay Sci. 23, 133–139.
Mondal, S., 2008. Methods of dye removal from dye house effluent: an overview. Environ. Eng. Sci. 25, 383–396.
Ngulube, T., Ray Gumbo, J., Masindi, V., Maity, A., 2017. An update on synthetic dyes adsorption onto clay based minerals: a state-of-art review. J. Environ. Manag. 191, 35–57.
Noh, J.S., Schwarz, J.A., 1989. Estimation of the point of zero charge of simple oxides by mass titration. J. Colloid Interface Sci. 130, 157–164.
Oz, M., Lorke, D.E., Hasan, M., Petronaiou, G.A., 2010. Cellular and molecular actions of methylene blue in the nervous system. Med. Res. Rev. 31, 93–117.
Pansu, M., Gautheyrou, J., 2003. L'analyse du sol: minéralogique, organique et minérale. Springer, Paris.
Pelekani, C., Snoeyink, V.L., 2000. Competitive adsorption between atrazine and me-thylene blue on activated carbon: the importance of pore size distribution. Carbon 38, 1423–1436.
Primo-Yúfera, E., Carrasco Dorrién, J.M., 1981. Química Agrícola. vol. 1 Alhambra, Barcelona.
Quintelas, C., Figueiredo, H., Tavares, T., 2011. The effect of clay treatment on
remediation of diethylketone contaminated wastewater: uptake, equilibrium and kinetic studies. J. Hazard. Mater. 186, 1241–1248.
Rafatullah, M., Sulaiman, O., Hashim, R., Ahmad, A., 2010. Adsorption of methylene blue on low-cost adsorbents: a review. J. Hazard. Mater. 177, 70–80.
Raposo, F., De La Rubia, M.A., Borja, R., 2009. Methylene blue number as useful indicator to evaluate the adsorptive capacity of granular activated carbon in batch mode: in-fluence of adsorbate/adsorbent mass ratio and particle size. J. Hazard. Mater. 165, 291–299.
Rida, K., Bouraoui, S., Hadnine, S., 2013. Adsorption of methylene blue from aqueous solution by kaolin and zeolite. Appl. Clay Sci. 83–84, 99–105.
Rodríguez, A., Ovejero, G., Mestanza, M., García, J., 2012. Dyes adsorption on low cost adsorbents: inorganic materials. Desal. Water Treat. 45, 191–205.
Salvestrini, S., Leone, V., Iovino, P., Canzano, S., Capasso, S., 2014. Considerations about the correct evaluation of sorption thermodynamic parameters from equilibrium iso-therms. J. Chem. Thermodyn. 68, 310–316.
Sánchez-Jiménez, N., Sevilla, M.T., Cuevas, J., Rodríguez, M., Procopio, J.R., 2012. Interaction of organic contaminants with natural clay type geosorbents: potential use as geologic barrier in urban landfill. J. Environ. Manag. 95, S182–S187. Sanchez-Martin, M.J., Rodriguez-Cruz, M.S., Andrades, M.S., Sanchez-Camazano, M.,
2006. Efficiency of different clay minerals modified with a cationic surfactant in the adsorption of pesticides: influence of clay type and pesticide hydrophobicity. Appl. Clay Sci. 31, 216–228.
Sarma, G.K., SenGupta, S., Bhattacharyya, K.G., 2011. Methylene blue adsorption on natural and modified clays. Sep. Sci. Technol. 46, 1602–1614.
Schroeder, P.A., Erickson, G., 2014. Kaolin: from ancient porcelains to nanocomposites. Elements 10, 177–182.
Tehrani-Bagha, A.R., Nikkar, H., Mahmoodi, N.M., Markazi, M., Menger, F.M., 2011. The sorption of cationic dyes onto kaolin: kinetic, isotherm and thermodynamic studies. Desalination 266, 274–280.
Tschapek, M., Tcheichvili, L., Wasowski, C., 1974. The point of zero charge (pzc) of kaolinite and SiO2+ Al2O3mixtures. Clay Miner. 10, 219–229.
Vimonses, V., Lei, S., Jin, B., Chow, C.W.K., Saint, C., 2009. Adsorption of congo red by three Australian kaolins. Appl. Clay Sci. 43, 465–472.
Walsh, G.E., Bahner, L.H., Horning, W.B., 1980. Toxicity of textile mill effluents to freshwater and estuarine algae, crustaceans andfishes. Environ. Pollut. Ser. A. Ecol. Biol. 21, 169–179.
Wang, S., Zhu, Z.H., 2006. Characterisation and environmental application of an Australian natural zeolite for basic dye removal from aqueous solution. J. Hazard. Mater. B136, 946–952.
Weber, T.W., Chakravorti, R.K., 1974. Pore and solid diffusion models for fixed-bed ad-sorbers. AICHE J. 20, 228–238.
Yagub, M.T., Sen, T.K., Afroze, S., Ang, H.M., 2014. Dye and its removal from aqueous solution by adsorption: a review. Adv. Colloid Interf. Sci. 209, 172–184. Zhang, H., Niu, Z., Liu, Z., Wen, Z., Li, W., Wang, X., Wu, W., 2015. Equilibrium, kinetic
and thermodynamic studies of adsorption of Th(IV) from aqueous solution onto kaolin. J. Radioanal. Nucl. Chem. 303, 87–97.
Zhou, X., Zhou, X., 2014. The unit problem in the thermodynamic calculation of ad-sorption using the Langmuir equation. Chem. Eng. Comm. 201, 1459–1467.