ISSN : 2437-1114
www.aljest.org
A
LJEST
Copyright © 2020, Algerian Journal of Environmental Science and Technology, All rights reserved
Adsorption kinetics modelling of methylene blue solution by
activated carbon using Peleg’s equation
N. Bourfis (1,2*),F.Benaissa(3), S. Benamara(1),H. Gougam(1) , K. Louhab(1) 1Food Technology Research Laboratory (LRTA) Faculty of Sciences Engineer
University of M'hamed Bougara, Boumerdes, BP 70, 35000 Boumerdes–Algeria
2 University of Akli Mohand Oulhadj Bouira–Algeria.
3Faculty of Sciences, University of M'hamed Bougara, Boumerdes, BP 70, 35000
Boumerdes–Algeria
*Corresponding author: [email protected]
ARTICLE INFO
ABSTRACT/RESUME
Article History:
Received : 17/11/2018 Accepted : 26/06/2019
Abstract:
The aim of this study is to envisage the possibility of
modelling the adsorption kinetics of methylene blue (MB) by
activated carbon using the Peleg’s model. Equation often used to
describe the sorption and absorption kinetics of water by the
material. The study of equilibrium adsorption was also envisaged in
this study and the isotherms of Langmuir and Freundlich were tested.
The activated carbon was prepared from almond shells bitter, fruit of
plants growing in parts of Algeria, especially in the Setif region.
Statistical analyses, have proved that the adsorption kinetics of MB
by activated carbon is perfectly (R² = 0.9999) described by the Peleg
model. On another hand, the study showed that, compared to the
Langmuir model, Freundlich model is most appropriate to describe
the equilibrium adsorption.
Key Words: Activated carbon; Absorption; Bitter almond; Modelling; Peleg model. I. Introduction
Activated carbon is commonly defined as a carbonaceous material showing a well-developed surface area and porous texture [1]. In various forms, this product has been widely used as adsorbent [2] and in catalysis [3, 4] or separation processes [5]. Most of the activated carbons are produced by a two-stages process, carbonization followed by activation. The first step is to enrich the carbon content and to create an initial porosity and the second step is the activation process which helps in enhancing the pore structure [6]. The commonly used precursors to prepare the activated carbon are of different types: bituminous coal, wood, coconut shell, peat, petroleum, pitch, and polymers. Despite its prolific use in adsorption process, the biggest barrier (limiting factor) of its application in the industry is the cost-prohibitive adsorbent and difficulties associated with regeneration [7].
Adsorption is a separation process by which certain components of a fluid phase are attracted to
the surface of a solid adsorbent and form attachments via physical or chemical bonds, thus removing the component from the fluid phase [8]. In general, adsorption processes may be classified as physical or chemical depending on the nature of the involved forces [8]. There are two important physicochemical aspects for the evaluation of adsorption processes as a unit operation: the adsorption equilibrium and the adsorption kinetics [9]. Equilibrium relationships between adsorbent and adsorbate are described by adsorption isotherms, usually by taking into account the ratio between the quantity adsorbed and that remaining in the solution at a fixed temperature at equilibrium. Kinetic study is an important step in the investigation of the adsorption process because it depicts the uptake rate of adsorbate, and controls the residual time of the whole adsorption process [10]. Also, it is important to establish the most appropriate correlation for the isotherms curves in order to optimize the design of an adsorption system [11]. For this reason, several models areused for equilibrium adsorptionmodellingby
adsorption kinetic modelling by activated carbon from bitter almonds, using the Pelegmodel [18]. Before, Peleg’s model is employed for modelling the phenomenon of water sorption by various foods: corn [19], chickpea [20], orange [21], chicken [22], olive leaves [23]... , it was also used to model dehydration by osmosis [24]. Only one case was reported on the application of Peleg’s model outside water exchange and concerns the extraction of soluble matters such as polyphenols [25, 26]. Knowing that this process is a physical phenomenon, it seems it is possible to introduce the Peleg’s equation to describe the adsorption kinetics by activated carbon.
The activated carbon used in the present study was prepared from the shells of bitter almonds, fruit of a plant wild which grows in certain regions of north Algeria, especially in Aith- Ouertilène (Setif region). By its considerable proportion in the fruit, the shell is a very valuable linocellulosic material deserving to be evaluated.
II. Material and methods II.1. Material
The raw material used for the preparation of activated carbon (AC) is the seeds shells of wild bitter almonds (SBAS, hereafter). These are the fruits (Fig.1) of a plant that grows wild in the region of Aith-Ouartilène (Setif region, Algeria). HSBAS analyzed were collected in July 2013.
Figure1. Some seeds of the analysed wild better
almonds.
II.2. Preparation of activated carbon
SBAS were washed with distilled water, dried, ground in a laboratory mill and sieved to various particle-size fractions using a conventional sieve shaker. The activation of SBAS was performed according to the procedure followed by Soleimaniet
al. (2008) [27] with some minor modifications.
SBAS were impregnated with phosphoric acid solution in 1:1 weight ratio. This mixture was left in a drying oven (MEMMERT, Beschickung – Loading Modell 100 - 800) at 100 °C for 24h. The activated material was washed with distilled water
The batch adsorption experiments were performed using shaker Jartest (JLT6-VELP).
II.3.1. Adsorption kinetic study
Kinetic study is important for investigation of an adsorption process because it allows a best comprehension of the whole adsorption [10]. In the present work, 200 ml of MB solution (100 mg/L) was contacted with a given weight of activated carbon in glass bottles
.
Samples were shaken at ambient temperature (26 °C). During the tests, samples of the slurry were taken at time varied in the range 0–300 min. Then, the carbon was then separated from the liquid. From a curve plotted by the variation of the MB solution concentration (0.0 – 0.1mM), the concentration (Ct, mg/L) of thesolution at any time was subsequently analyzed by measuring theabsorbance at 665 nm using UV-visible spectrophotometer (Jasco V-530, Japan), and the amount of the adsorbed MB (qt, mg/g) by the carbon is calculated according to the following equation:
W
C
C
V
q
t t)
(
0
(1) Where Co is the MB concentration (mg/L) at t = 0, V is the volume of the solution (L) and W is themass of the adsorbent (g).
II.3.2. Equilibrium studies
Batch adsorption studies were performed at 22 °C (room temperature) to obtain the equilibrium isotherms. A series of 250 ml glass vessels were employed. Each vessel was filled with 100 ml of methylene blue (MB) solution of various concentrations (0.10; 0.15; 0.20; 0.25 and 0.30 g/L). The equilibrium test study was performed according to the following initial adsorption conditions (preliminary determined by Taguchi designs): pH 2.2 and dried carbon sample of 2 grams per vessel (Ø of particles = 0.2-0.63 mm). The solution was mixed at 150 rpm and equilibrated for about 5 h. Subsequently, the carbon particles were separated from the solution by filtration (with Whatman No. 42 filter paper) [27] and clear solutions were analyzed for the MB concentrations by UV-visible spectrophotometer (Jasco V-530, Japan) at a wavelength of 600 nm. The equilibrium concentration (Ce, mg/L) is found experimentally
when adsorption reaches its equilibrium state. The equilibrium concentration (qe, mg/g)
retained in the adsorbent phase was calculated by the following equation:
ISSN : 2437-1114
www.aljest.org
A
LJEST
W
C
C
V
q
e e)
(
0
(2)II.4. Modelling of adsorption kinetics using Peleg’sequation
It is important to establish the most appropriate correlation for the isotherms curves in order to optimize the design of an adsorption system [11]. Peleg [18] proposed the following two parameters sorption equation for prediction accuracy during water vapour adsorption of milk powder and whole rice, and soaking of whole rice:
t
K
K
t
X
X
.
2 1 0
(3) where X0 and X are the initial moisture content andmoisture content at time t expressed as dry basis respectively, K1 is the Peleg rate constant, and K2 is
the Peleg capacity constant. In (3), “±” becomes ‘‘+’’ if the process is absorption or adsorption and ‘‘-’’ if the process is drying or desorption.
Peleg rate constant K1 related to desorption rate
at the very beginning (t = t0):
i
K
dt
dX
11
(4) The Peleg capacity constant K2 is related to themaximum reached moisture content. As t, (5) gives the relation between equilibrium moisture content (Xe) and K2: 2 0
1
K
X
X
e
(5) Linearization of (5) gives: it
K
K
X
X
t
.
2 1 0
(6)The plotting of (6) is a straight line, where the first term of the second member is the intercept (K1) and
K2 is the slope.
II.4.1. Using Peleg’s equation in the adsorption phenomena
Similarly, for salt gain the Peleg model can be also written as:
t
C
C
q
q
t
t.
2 1 0
(7)Where qt is the MB quantity retained in the
adsorbent phase (mg/g) at time t, q0 is the initial
MB quantityand C1 is the Peleg rate constant, and
C2 is the Peleg capacity constant.
In the phenomenon of adsorption, the quantity (q0) is null: no quantity of BM adsorbed at t0. Equation 7 can then be written:
t
C
C
q
t
t.
2 1
The Peleg rate constant C1 is related to qtat
the very beginning, t = t0:
1
1
C
dt
dq
t
(8) The Peleg capacity constant C2 is proportionalto the maximum reached qt. As t→∞, (9) gives the
relation between qe and C2:
i e t
C
q
q
2 ,1
(9)Regarding the modelling of adsorption kinetics others models have been used: Pseudo-first-order; Pseudo-second-order; Elovich and Diffusion model.
II.5. Adsorption isotherm
II.5.1. Langmuir equation
The Langmuir adsorption describes the surface as homogeneous assuming that the adsorption sites have equal adsorbate affinity and that adsorption at one site does not affect adsorption at an adjacent site [29]. This model can be described by the following form: 0 0
1
Q
C
b
Q
q
C
e e e
(10)Where qe is the amount of MB adsorbed at
equilibrium (mg/g), Ce is the equilibrium
concentration (mg/l), Q0 is the monolayer
adsorption capacity (mg/g) and b is the constant related to the free adsorption energy (Langmuir constant, l/mg). A plot of Ce/qe versus Ce gives a
straight line with the slope 1/Q0 which corresponds
to complete coverage (mg/g) and the intercept is 1/ Q0 b.
II.5.2. Freundlich equation
The Freundlich isotherm describes the equilibrium on heterogeneous surfaces and does not assume monolayer capacity [29]. The Freundlich equation is described as follow:
e f e
C
n
K
q
log
1
log
log
(11)Where Kf is an indicative constant of the relative
adsorption capacity of the adsorbent (mg/g) and the constant 1/n indicates the intensity of the adsorption. These constants were calculated from the slope and intercept of the Freundlich plots.
II.6. Data analysis
The fit between the experimental and predicted data was determined using the correlation coefficient (R2), hybrid fractional error function
p
iq
en
1,
exp
2exp
,
,
exp
,
1
100
i n p n e e eq
cal
q
q
p
n
MPSD
(13) i n i e e eq
cal
q
q
n
ARE
1,
exp
,
exp
,
100
(14) 2 1)
exp
,
(
1
calc
q
q
n
RMSE
n i e e
(15)Microsoft Excel 2007 was used to perform statistical analysis.
III. Results and discussion
III.1. Modelling of adsorption kinetic
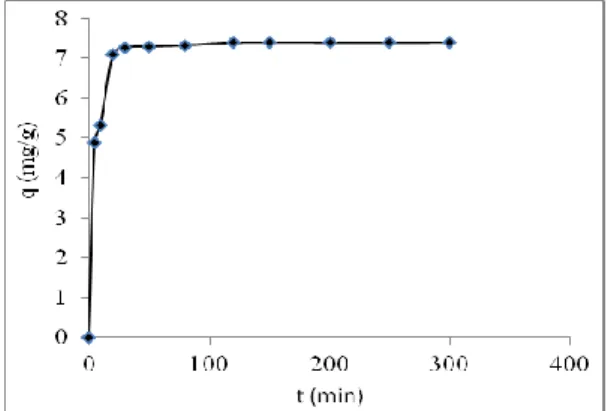
Fig. 2 shows the chart of the BM amount adsorbed by the AC at various time intervals of a liquid phase which is characterized by an initial concentration of 74.7 mg/l. As it can be seen, the carbon adsorption capacity (qe) increases with time,
reaching at the end maximum value of 7.399 mg/g of AC) after a contact time of 100 min approximately. At this time, an equilibrium state, during which ceases any transfer of matter between AC and the liquid medium of immersion, is established.
Figure 2. Adsorption kinetics of the MB by AC (at
26 °C).
Really, the curve of adsorption kinetic which is obtained (Fig. 2) takes a similar form to that obtained by Dadali et al. (2008) [31] describing the water uptake kinetic of dried spinaches using Peleg’ equation. Obviously, this similarity enables us to envisage the possibility to introduce the Peleg model to investigate the adsorption phenomena.
Figure 3. Modeling of the MB adsorption by AC
using Peleg’s equation.
The found values, together with corresponding statistical parameters, are summarized in Table 1.
Table 1. Values of Peleg’s constants (C1 and C2)
and statistics parameters related to the MB adsorption by AC. Peleg constants C1 (min.g.mg-1) 0.232 C2 (g.mg-1) 0.134 qe, calc (mg/g) 7.457 Statistics parameters R² 0.9999 HYBRID 3.316 ARE 3.827 RMSE 0.114 MPSD 7.927
The good adequacy of the model tested is supported by the high value of the determination coefficient (R²), as well as low values of the four other applied statistics. This result is confirmed by the Fig. 4 illustrating experimental results and predicted by the model curves since the two curves stacked almost perfectly.
ISSN : 2437-1114
www.aljest.org
A
LJEST
predicted BM adsorption kinetics by AC according to Peleg’s model.
This concordance is also established by the good correlation (R² = 0.9717) between the experimental data (qtexp) and those calculated (qtcalc) by the model (Fig.5).
Figure 5. Correlation between the experimentally
obtained values of MB adsorbed amount vs. calculated concentrations using Peleg’s model.
On the other hand, the adsorption capacity (qecalc = 7,457 mg/g) evaluated through (Eq.9) agrees well with that obtained in experiments (qeexp = 7,399 mg/g). This is another confirmation of the aptitude Peleg model to describe the BM adsorption process by the activated carbon.
As one had to expect it, the Peleg constants values (C1and C2) obtained in this work are
different with those communicated by various authors (Table 2).
These observed differences can be indeed imputed to: 1) the great difference of mechanisms taking place during absorption and adsorption and 2) the nature of the studied material. In all cases, constant C1 is inversely proportional to the dye fixing what is in concordance with literature data [32].
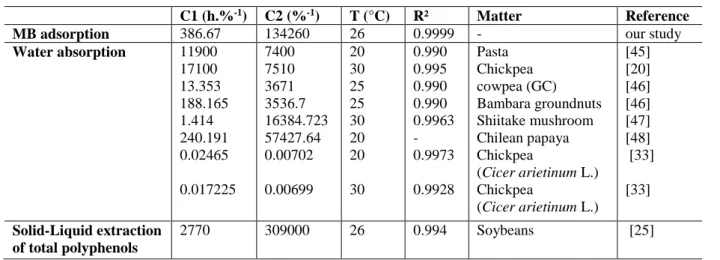
Table 2. Comparison between Peleg’s constants of MB adsorption by AC and those of water absorption.
According to Table 2, the adsorption speed of the dye molecules are greater than that of the water absorption by certain foods, with a factor ranging from 29 (case of Cowpea (GC)) to 22447 (case of chickpeas). As previously underlined, the high observed difference in the C1 values can be attributed to the difference in the mechanisms staked: the adsorption concerns the interface phenomena, where as the absorption integrates mass transfer into the whole volume of the product.
On the other hand, the adsorption speed (C1)
found in this work is 7 times lower than that of the solid-liquid extraction of total polyphenols from soya [25].
Concerning the constant C2 ,the value is higher than those of the literature.The adsorption capacity found in this work is higher than those related to the water absorption by various foods with a factor ranging from about 2.3 (Chilean Papaya) to 38 (Bambara groundnuts); it is moreover 2.3 times lawer than the extraction capacity of the phenolic compounds by ethanol.
It should be noted that the Peleg parameters (C1and C2) are affected by the experimental conditions, more particularly the treatment temperature. Several authors [20, 32, 34, 35, 36]
C1 (h.%-1) C2 (%-1) T (°C) R² Matter Reference
MB adsorption 386.67 134260 26 0.9999 - our study
Water absorption 11900 17100 13.353 188.165 1.414 240.191 0.02465 0.017225 7400 7510 3671 3536.7 16384.723 57427.64 0.00702 0.00699 20 30 25 25 30 20 20 30 0.990 0.995 0.990 0.990 0.9963 - 0.9973 0.9928 Pasta Chickpea cowpea (GC) Bambara groundnuts Shiitake mushroom Chilean papaya Chickpea (Cicer arietinum L.) Chickpea (Cicer arietinum L.) [45] [20] [46] [46] [47] [48] [33] [33] Solid-Liquid extraction of total polyphenols 2770 309000 26 0.994 Soybeans [25]
Copyright © 2020, Algerian Journal of Environmental Science and Technology, All rights reserved IV.2. Adsorption isotherm
The adsorption isotherm shows how the adsorption molecules are distributed between the liquid phase and the solid phase when adsorption reaches equilibrium.
It is well-known that the modelling of adsorptions isotherms is the first objective to be reached in any scientific investigation since it is used as rational mathematical tool for moving from the experimental laboratory to the design of wide prototype.
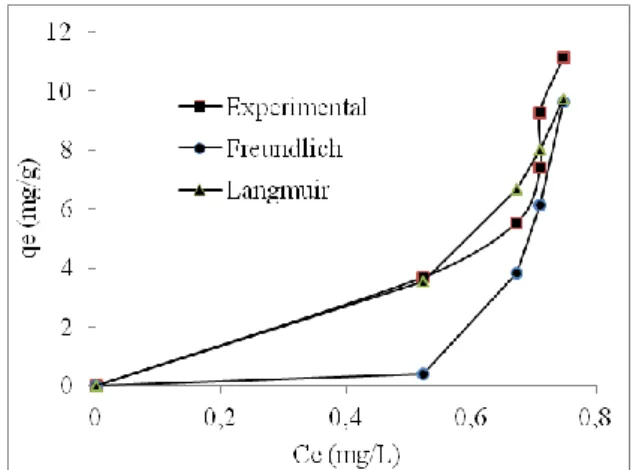
The variation of the adsorbed dye quantity (qe)
according to the equilibrium concentration (Ce) is
shown in Fig. 6.
Figure 6. Equilibrium adsorption isotherm of MB
by AC (at 26 °C).
It follows that the equilibrium adsorption amount (qe) increases with the increase of dye concentration
(Ce). This finding is consistent with bibliographic
data: BM adsorption by bentonite [9], adsorption of the 4-chlorophenol by the activated carbon prepared starting from rattan sawdust [39, 40]), adsorption of copper by the coal of the hazel nut shell [10], adsorption of copper by coal of the almond shell [11], adsorption of the basic dyes (methylene blue, basic 22, yellow red basic 21) by the activated carbon [8], and absorption of the basic dyes (basic blue 3, basic red 22, basic yellow 11) by kudzu [41].
On the other hand, several models are cited in the literature to describe the experimental data related to adsorption isotherms. The Langmuir model and Freundlich model are the most frequently used [40].
Table 3. Langmuir and Freundlich isotherm
constants for MB dye by activated carbon at 26°C. Langmuir Freundlich Constants Q0 (mg/g) b (L/mg) Kf (mg/g) N -3.146 -1.012 124.882 0.114 R² 0.802 0.898 HYBRID 21.488 162.317 ARE 11.861 38.638 MPSD 16.937 58.837
From Table 3, the determination coefficient values (R²), as well as (unfortunately) other statistical cheracteristics are highest for Freundlich model. At the same time, the negative constants of the Langmuir model imply the inadequacy of this one for the description of the experimental data [42]. Thus it becomes clear that the Freundlich model fit correctly experimental data. It must be recalled that this last, which is of empirical nature, can be employed to describe heterogeneous adsorption, while the Langmuir model suggests that the molecules adsorption is done on a homogeneous surface into full-course without interaction between the adsorbed molecules [40]. However, generally most of authors [8, 10, 11, 39, 40, 43] observed that: 1) equilibrium adsorption isotherm is of type II and that 2) with this type, the Langmuir model is associated. But no theory postulates on automaticity between the type and the model. Moreover, Demirbas et al. (2009) [10] found for the same type II, an almost identical adequacy between the models of Langmuir (R2 = 0.999) and Freundlich
(R2 = 0.915). Lastly, our results (concerning the
isotherm type and the model type) are in conformity with those communicated by Estevinho et al. (2006) [44] worked on the adsorption of pentachlorophenol by the sweet almond hull in a rough state (without any treatment of neither activation nor carbonization).
This adequacy is proved by the good correlation between qe exp and qe calc (Fig. 7).
ISSN : 2437-1114
www.aljest.org
A
LJEST
Copyright © 2020, Algerian Journal of Environmental Science and Technology, All rights reserved Figure 7. Correlation between the experimentally
obtained values of MB adsorbed amount vs. calculated concentrations using Freundlich model. IV. Conclusion
In this study, the obtained results show clearly that the preparation of an activated carbon from bitter almond shells is possible.
In addition, the adsorption kinetics of the methylene blue is correctly described by Peleg's model. This one, to our knowledge is never introduced earlier for analysis of the adsorption processes.
On other hand, the experimental data reveal that the adsorption capacity of the obtained activated carbon is satisfactory since it is comparable with that of the traditional activated carbon resulting from other types of biomaterials. Moreover, the study proves that, compared with Langmuir model, Freundlich model describes best the adsorption isotherm.
Consequently, the bitter almonds can arouse an interest near the various industrial sectors which will contribute to the safeguard of the biodiversity.
V. References
1. Ould-Idriss, A.; Stitou, M.; Cuerda-Correa, E.M.; Fernández-González, C.; Macías-García, A.; Alexandre-Franco, M.F.; Gómez-Serrano, V. Preparation of activated carbons from olive-tree wood revisited. I. Chemical activation with H3PO4.
Fuel Processing Technology 92 (2011) 261–265.
2. Rivera-Utrilla, J.; Sanchez-Polo, M.; Gomez-Serrano, V.; Alvarez, P.M.; Alvim-Ferraz, M.C.M.; Dias, J.M. Activated carbon modifications to enhance its water treatment applications. Journal of hazardous materials 187 (2011) 1–23.
3. Lee, J.; Kim, J.; Hyeon, T. Recent progress in the synthesis of porous carbon materials, Advanced
Materials 18 (2006) 2073–2094.
4. Reimerink, W. M. T. M.; The use of activated carbon as catalyst and catalyst carrier inindustrial applications. Studies in Surface Science and Catalysis
A120 (1999) 751–769.
5. Dabrowski, A.; Adsorption from theory to practice.
Advances in Colloid and Interface Science93 (2001) 135–224.
6. Prakash Kumar, B.G.; Shivakamy, K.; Miranda, L. R.; Velan, M. Preparation of steam activated carbon from rubberwood sawdust (Heveabrasiliensis) and its adsorption kinetics. Journal of hazardous materials B136 (2006) 922–929.
7. Chen, J.P.; Lin, M. Surface charge and metal ion adsorption on an H-type activated carbon: experimental observation and modelling simulation by the surface complex formation approach. Carbon 39 (2001) 1491–1504.
8. El Qada, E. N.;. Allen, S. J; Walker, G. M. Adsorption of basic dyes from aqueous solution onto activated carbons. Chemical Engineering Journal135 (2008) 174–184.
9. Hong, S.; Wen, C.; He, J.; Gan, F.; Ho, Y.S. Adsorption thermodynamics of methylene blue onto bentonite. Journal of hazardous materials 167 (2009) 630–633.
10. Demirbas, E.; Dizge, N.; Sulak, M.T.; Kobya, M. Adsorption kinetics and equilibrium of copper from aqueous solutions using hazelnut shell activated carbon. Chemical Engineering Journal148 (2009) 480–487.
11. Demirbas, E.; Kobya, M.; Konukman, A.E.S. Error analysis of equilibrium studies for the almond shell activated carbon adsorption of Cr(VI) from aqueous solutions. Journal of hazardous materials 154 (2008) 787–794.
12. Langmuir, I. Adsorption of gases on plain surfaces of glass mica platinum. Journal of the American
Chemical Society 40 (1918) 1361–1403.
13. Freundlich H.M.F. Über die adsorption in lösungen.
Zeitschrift für Physikalische Chemie A57 (1906) 385–470.
14. Lagergren S. About the theory of so called adsorption of soluble substances. Ksver Veterskapsakad Handl 24 (1898) 1–6.
15. McKay, Y. S. Ho, G. Pseudo-second order model for sorption processes. Process Biochemistry34 (1999) 451–465.
16. Chien, S. H.; Clayton, W. R. Application of Elovich equation to the kinetics of phosphate release and sorption in soils. Soil Science Society of America
Journal 44 (1980) 265–268.
17. Urano, K.; Tachikawa, H. Process development for removal and recovery of phosphorus from wastewater by a new adsorbent. II. Adsorption rates and breakthrough curves. Industrial & Engineering
Chemistry Research 30 (1991) 1897–1899.
18. Peleg, M. An empirical model for the description of moisture sorption curves. Journal of Food Science 53 (1988) 1216–1219.
19. Peng, G.; Chen, X.; Jiang, W.; Wu, X. Modeling of water sorption isotherm for corn starch. Journal of
Food Engineering 80 (2007) 562–567.
20. Turhan, M.; Sayar, S.; Gunasekaran, S. Application of Peleg model to study water absorption in chickpea during soaking. Journal of Food Engineering 53 (2002) 153–159.
21. Díıaz, G. R.; Martínez-Monzó, J.; Fito, P.; Chiralt, A. Modelling of dehydration-rehydration of orange slices in combined microwaveyair drying. Innovative
Food Science and Emerging Technologies 4 (2003)
203–209.
22. Schmidt, F.C.; Carciofi, B. A. M.; Laurindo, J. B. Application of diffusive and empirical models to hydration, dehydration and salt gain during osmotic treatment of chicken breast cuts. Journal of Food
Engineering 91 (2009) 553–559.
23. Bahloul, N.; Boudhrioua, N.; Kechaou, N. Moisture desorption–adsorption isotherms and isostericheats of
Copyright © 2020, Algerian Journal of Environmental Science and Technology, All rights reserved
Czech Journal of Food Sciences28 (3) (2010) 206-212.
26. Boussetta, N.; Lanoisellé, J. L.; Bedel-Cloutour, C.; Vorobiev, E. Extraction of soluble matter from grape pomace by high voltage electrical discharges for polyphenol recovery: Effect of sulphur dioxide and thermal treatments. Journal of Food Engineering 95 (2009) 192–198.
27. Soleimani, M.; Kaghazchi, T. Adsorption of gold ions from industrial wastewater using activated carbon derived from hard shell of apricot stones–An agricultural waste. Bioresource Technology99 (2008) 5374–5383.
28. Cimino, G.; Cappello, R.M.; Caristi, C.; Toscano, G. Characterization of carbons from olive cake by sorption of wastewater pollutants. Chemosphere 61 (2005) 947–955.
29. Akkaya, G.; Özer, A. Biosorption of Acid Red 274 (AR 274) on Dicranellavaria: Determination of equilibrium and kinetic model parameters. Process
Biochemistry 40 (2005) 3559–3568.
30. Deng, Y.; Zhao, Y. Effects of pulsed-vacuum and ultrasound on the osmodehydration kinetics and microstructure of apples (Fuji). Journal of Food
Engineering 85 (2008) 84–93.
31. Dadali, G.; Demirhan, E.; Özbek, B. Effect of drying conditions on rehydration kinetics of microwave dried spinach. Food and Bioproducts Processing86 (2008) 235–241.
32. Moreira, R.; Chenlo, F.; Chaguri, L.; Fernandes, C. Water absorption, texture, and color kinetics of air-dried chestnuts during rehydration. Journal of Food
Engineering 86 (2008) 584-594.
33. Yildirim, A.; Öner, M. D.; Bayram, M. Modeling of water absorption of ultrasound applied chickpeas (CicerarietinumL.) using Peleg’s equation.
Journal of Agricultural Science 16 (2011) 278-286.
34. Moreira, R.; Chenlo, F.; Torres, M.D.; Vázquez, G. Effect of stirring in the osmotic dehydration of chestnut using glycerol solutions. LWT 40 (2007). 1507–1514.
35. García-Pascual, P.; Sanjuán, N.; Melis, R.; Mulet, A. Morchellaesculenta (morel) rehydration process modeling. Journal of Food Engineering 72 (2006) 346–353.
36. Maskan, M. Drying shrinkage and rehydration characteristics of kiwifruits during microwave drying.
Journal of Food Engineering 48 (2001) 177-182.
39. Hameed, B.H.; Chin, L.H.; Rengaraj, S. Adsorption of 4-chlorophenol onto activated carbon prepared from rattan sawdust. Desalination 225 (2008) 185– 198.
40. Hameed, B.H.; Ahmad, A.L.; Latiff, K.N.A. Adsorption of basic dye (methylene blue) onto activated carbon prepared from rattan sawdust. Dyes
and Pigments 75 (2007) 143-149.
41. Allen, S.J.; Gan, Q.; Matthews, R.; Johnson, P. A. Kinetic modelling of the adsorption of basic dyes by kudzu. Journal of Colloid and Interface Science 286 (2005) 101–109.
42. Uçar, B.; Güvenç, A.; Ülkü, M. Use of Aluminium hydroxide sludge as adsorbents for the removal of reactive dyes: equilibrium, thermodynamic, and kinetic studies. Hydrology: Current Research 2 (2) (2011) 1-8.
43. Alhamed, Y. A. Adsorption kinetics and performance of packed bed adsorber for phenol removal using activated carbon from dates’ stones. Journal of
hazardous materials 170 (2009) 763–770.
44. Estevinho, B.N.; Ratola, N.; Alves, A.; Santos, L. Pentachlorophenol removal from aqueous matrices by sorption with almond shell residues. Journal of
hazardous materials B137 (2006) 1175–1181.
45. Cunningham, S.E.; McMinn, W.A.M.; Magee, T.R.A.; Richardson, P.S. Modelling water absorption of pasta during soaking. Journal of Food Engineering 82 (2007) 600–607.
46. Kaptso, K.G.; Njintang, Y.N.; Komnek, A.E.; Hounhouigan, J.; Scher, J.; Mbofung, C.M.F. Physical properties and rehydration kinetics of two varieties of cowpea (Vignaunguiculata) and bambara groundnuts (Voandzeiasubterranea) seeds. Journal of
Food Engineering. 86 (2008) 91–99.
47. García-Segovia, P.; Andrés-Bello, A.; Martínez-Monzó, J. Rehydration of air-dried Shiitake mushroom (Lentinusedodes) caps: Comparison of conventional and vacuum water immersion processes.
LWT - Food Science and Technology 44 (2011)
480-488.
48. Zura, L.; Uribe, E.; Lemus-Mondaca, R.; Saavedra-Torrico, J.; Vega-Gálvez, A.; Di Scala, K. Rehydration capacity of chilean papaya (Vasconcellea pubescens): Effect of process temperature on kinetic parameters and functional properties. Food and Bioprocess Technology 6 (2013) 844-850.
Please cite this Article as:
Bourfis N., Benaissa F., Benamara S., Gougam H., Louhab K., Adsorption kinetics modelling of methylene blue solution by activated carbon using Peleg’s equation, Algerian J. Env. Sc.