Processus gravitaires dans la vallée Tasiapik (Nunavik) :
témoins géomorphologiques de la dynamique de
versant récente et passée
Mémoire
Samuel Veilleux
Maîtrise en sciences géographiques - avec mémoire
Maître en sciences géographiques (M. Sc. géogr.)
Résumé
Ce projet de recherche, mené près d’Umiujaq (Nunavik), a été réalisé afin de documenter les processus gravitaires dominants qui se manifestent sur les versants escarpés de la vallée Tasiapik. Des relevés topographiques, granulométriques, morphométriques, pétrographiques et de végétation ont permis de caractériser 18 talus d’éboulis situés sur les versants sud-ouest et nord-est. Les résultats obtenus ont permis d’établir que l’éboulisation importante sur les versants de la vallée est un phénomène à la fois ancien, engendré par des processus paraglaciaires, et récent, résultat de processus périglaciaires toujours actifs aujourd’hui. Cela se traduit notamment par différents stades de développement des talus d’éboulis subactuels, illustrés par certains dépôts de versant frais et d’autres très anciens, mais aussi avec des topographies de pente très variables. Sur une échelle de temps plus courte, entre août 2017 et juillet 2018, les avalanches se sont avérées être un processus majeur, tel qu’observé sur les 14 000 photographies obtenues grâce à trois caméras à déclenchement automatique installées à l’été 2017. Ces avalanches, souvent déclenchées par des chutes de corniches à neige, ont été particulièrement fréquentes au printemps 2018, résultant de conditions météorologiques propices telles qu’une hausse rapide des températures journalières et des épisodes de pluie abondante. Des dépôts d’avalanches sales témoignent d’une grande capacité érosive, et incidemment de leur grand apport en débris vers les talus d’éboulis. Dans certains cas, les dépôts d’avalanche avoisinaient la route située en contrebas, démontrant ainsi un risque potentiel pour ses usagers.
Abstract
This research project was conducted near Umiujaq (Nunavik) to document the main gravitational processes that occur on the slopes of Tasiapik Valley. 18 talus slopes on the southwest and northeast sides of the valley were characterized using topographic, granulometric, morphometric petrographic and vegetation surveys. Results show that talus formation in the valley is an ancient phenomena, due to paraglacial processes, and recent - and still ongoing – periglacial processes. This is evidenced by different development stages among the talus slopes, with fresh and very old debris covering the slopes, as well as contrasting slope topographies. On a shorter and more recent time scale, from August 2017 to July 2018, snow avalanches have proven to be a major process, as observed on the 14,000 photographs obtained using three automatic timelapse cameras installed in the summer of 2017. Snow avalanches were often triggered by a collapsing snow-cornice and were very frequent in the spring of 2018 due to favourable meteorological conditions such as a rapid increase in daily temperatures and abundant rainfall events. Dirty snow-avalanche deposits have shown the great erosive capacity of these snow avalanches, thus their important debris supply toward the talus slopes. In some cases, runout zones were located only a few meters from the road below, thus showing the potential risk for people travelling on the road.
Table des matières
Résumé ... iii
Abstract ... iv
Table des matières ... v
Liste des figures ... vii
Liste des tableaux ... ix
Remerciements ... xi
Avant-propos ... xii
Introduction générale ... 1
I. Introduction ... 1
II. Région et site d’étude ... 3
Localisation ... 3
Géologie régionale ... 3
Géomorphologie quaternaire ... 4
Climat et végétation ... 5
III. Problématique, objectifs et hypothèses ... 7
Énoncé du problème ... 7 Objectif général ... 7 Objectifs spécifiques... 8 Hypothèses ... 8 IV. Méthodologie ... 9 Références ... 13 Chapitre 1 ... 17 Résumé ... 18 Abstract ... 19 I. Introduction ... 20
II. Study area ... 21
III. Methods ... 24
IV. Results and interpretation ... 28
1. Topography of slope deposits ... 28
4. Debris runout ... 40
5. Short-term slope dynamics ... 42
V. Discussion ... 43
1. Talus slope formation ... 43
2. Slope debris redistribution ... 45
3. Rockwall erosion ... 48 VI. Conclusion ... 51 References ... 52 Chapitre 2 ... 59 2.1 Résumé ... 60 2.2 Abstract ... 61 I. Introduction ... 62
II. Study area ... 63
III. Methods ... 65
1. Time-lapse cameras ... 65
2. Meteorological analysis ... 65
3. Fieldwork ... 65
IV. Results and interpretation ... 67
1. Snow cornice formation and collapses ... 67
2. Snow-avalanche events ... 69
3. Snow-avalanche deposits ... 73
Discussion ... 76
1. Meteorological and topographic control ... 76
2. Runout and proximity to the road ... 79
3. Limitations ... 81
Conclusion ... 82
References ... 83
Liste des figures
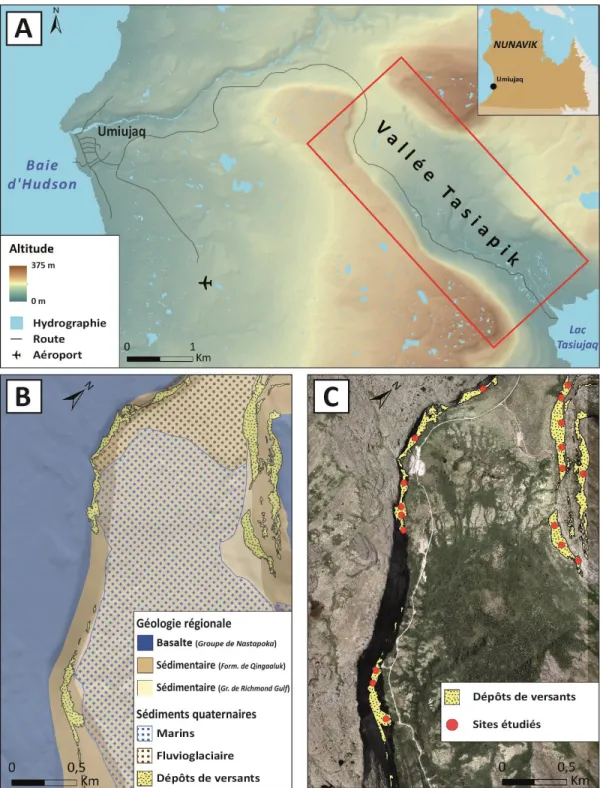
Figure 1: Localisation de la vallée Tasiapik et les environs d'Umiujaq; géologie régionale et couverture
sédimentaire dans la vallée Tasiapik; distribution des dépôts de versant et localisation des sites étudiés ... 6
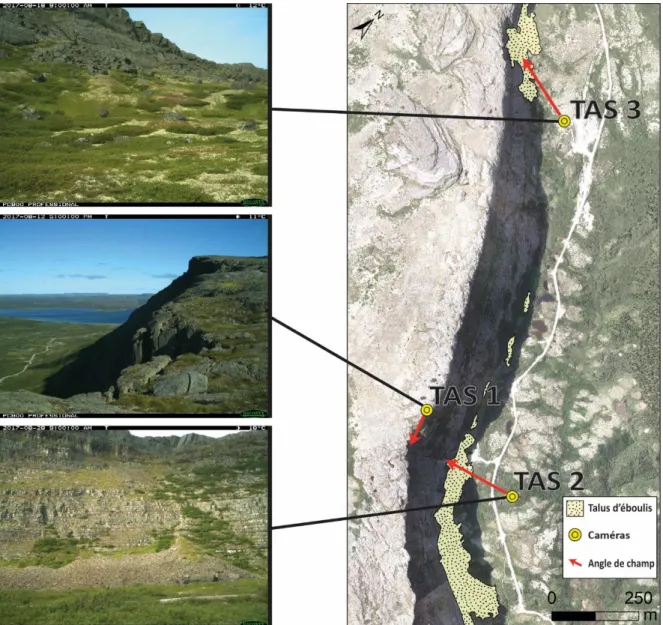
Figure 2: Localisation des caméras dans la vallée, avec leur angle de champ et leur cadre ... 12
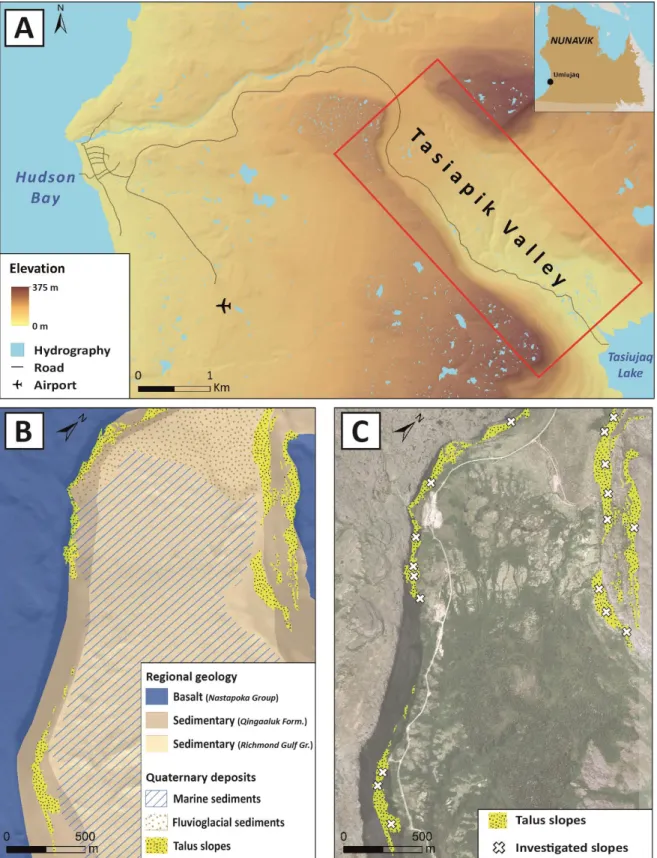
Figure 3: Location of Tasiapik Valley within the Umiujaq area; regional geology and quaternary sediments in Tasiapik Valley; distribution of the talus slopes and investigated slopes ... 23
Figure 4: Location of the cameras along the SW side of Tasiapik Valley ... 27
Figure 5: Longitudinal cross-section of the investigated slopes ... 29
Figure 6: Vegetation stages along the talus slopes ... 32
Figure 7: Slope development stage according to three parameters: 1) vegetation; 2) Ho/Hi index and 3) a combination of the two ... 33
Figure 8: Proportion of the different lithologies along the talus slope ... 36
Figure 9: Distribution of the debris size (a-axis) along the talus slopes. Close-up of the largest sampled debris along SW-09 profile and NE-09 profile ... 37
Figure 10: Cross-section of the slopes (talus/rockwall) showing the reach and shadow angle for the farthest slope debris, and the hypothetical travel distance from the source area ... 41
Figure 11: Snow-avalanche event exhibiting a dirty deposit, as the result of incorporated debris; discrete rockfall event and debris sliding onto the snow-covered talus ... 42
Figure 12: Recent notches formed in the rockwall along SW-07 and NE-09 profiles; dense shrub cover at the base of the slope near SW-07 and SW-08 profiles and mid-slope near NE-05 and NE-06 profiles ... 44
Figure 13: Cluster of basalt boulders located ~250 m away from the slope, overlying littoral sediments ... 47
Figure 14: Erosion of the basalt layer at the top of the cuesta on the SW side, with tall monolith on the verge of falling, resulting in a sawtooth shape exposed on the rockwall; frost heave and extensive jointing of the basalt bedrock; basalt and sandstone layers overhanging quartz arenite layers on the NE side ... 48
Figure 15: Location of Tasiapik Valley in the Umiujaq region; oblique view toward the north, showing the cuesta frontslope on the SW side ... 64
Figure 16: Location of the cameras along the SW side of Tasiapik Valley ... 66
Figure 17: Meteorological conditions during the cornice accretion period: temperature, snowfall, wind speed and wind direction ... 67
Figure 18: Schematic cross-section and photographs representing the accretion, the creeping and collapsing/melting periods ... 68
Figure 21: 3D view of the SW side of Tasiapik Valley, highlighting the snow avalanche deposits observed in the field in June 2018, with topographic long profiles and on-site photographs for deposits respectively located downstream, mid-valley and upstream ... 75 Figure 22: Schematic cross-section showing the snow redistribution by the wind, and the formation of a lee zone deposition on the slope below the snow cornice ... 77 Figure 23: Snow cover on the SW side and NE side on June 12, 2018. Shaded SW side in June 2018 ... 78 Figure 24: Wet snow-avalanche deposits with runout distances near the road ... 79 Figure 25: Dirty snow avalanche deposits in June 2018. Comparison of a shorter runout distance from this event with another wet snow avalanche with a longer runout occurring in late May 2018 and a slab avalanche occurring in April 2018 ... 80 Figure 26: Days with poor visibility on the three cameras installed in Tasiapik Valley ... 81
Liste des tableaux
Table 1: Topographic parameters of the investigated slopes. ... 28
Table 2: Calculation of Ho/Hi index. ... 31
Table 3: Debris size and morphometric parameters along the longitudinal profiles. ... 38
Mental toughness, la dureté du mental. Pis
icitte présentement, y’en a pas mal plus
qu’on pense du mental.
Bob Chicoine
Remerciements
J’aimerais remercier tous ceux et celles qui, de près ou de loin, ont contribué à l’aboutissement de ce mémoire. D’abord, un énorme merci à Najat Bhiry et Armelle Decaulne pour leurs nombreux et judicieux conseils, leur rigueur scientifique et leur disponibilité. Je les remercie également de m’avoir fait découvrir le Nunavik au cours des trois dernières années. Ensuite, je tiens à remercier Michel Allard et Thorstein Saemundsson pour leurs conseils et pour les discussions qui m’ont aidé à approfondir mes réflexions. Je remercie également les gens de la communauté d’Umiujaq et du parc national Tursujuq pour l’intérêt porté envers ce projet, ainsi que les collègues qui ont prêté assistance sur le terrain, dans des conditions parfois difficiles. Enfin, je souhaite remercier mes proches et mes ami(e)s qui ont su m’encourager et me donner un coup de main toujours très apprécié.
Avant-propos
Ce mémoire est rédigé sous forme de deux articles soumis à des revues scientifiques pour publication. Les chapitres 1 et 2 du mémoire reprennent l’essentiel de ces articles, rédigés en anglais, portant respectivement sur l’étude des processus d’éboulisation et des avalanches de neige. L’introduction et la conclusion générale du mémoire sont rédigées en français.
Les sections se détaillent comme suit :
Introduction générale
Chapitre 1 – Veilleux, S., Bhiry, N., & Decaulne, A. - Talus slope characterization in Tasiapik Valley
(subarctic Québec): evidence of past and present slope processes. Soumis à la revue
Geomorphology.
Chapitre 2 – Veilleux, S., Bhiry, N., & Decaulne, A. - Snow cornice and snow avalanche monitoring
using automatic time-lapse cameras in Tasiapik Valley, Nunavik. Soumis à la revue Cold Regions
Science and Technology.
Introduction générale
I. Introduction
Les hauts reliefs se font plus rares dans le Nord québécois que dans les grands massifs montagneux connus, la majorité du territoire étant constituée de plateaux, de bassins et de basses collines (MRNF, 2010). Ainsi, peu de chercheurs se sont intéressés à la dynamique et la géomorphologie des versants dans cette région, bien que cette thématique soit largement étudiée dans les milieux froids (Luckman, 2013). Les versants qui ont été étudiés sont situés en région isolée, notamment au lac Wiyâshâkimî (Bégin et Filion, 1985 ; St-Cyr, 1986 ; Marion et al., 1995 ; Decaulne et al., 2018) et à la presqu’île de Manitounuk (Belzile, 1984). Quelques hauts reliefs se profilent néanmoins à proximité d’établissements humains, et comme des lacunes subsistent quant à la compréhension de la dynamique de ces versants, il convient de s’y intéresser. L’avalanche mortelle de 1999 à Kangiqsualujjuaq est un cas concret où un manque dans la documentation des mouvements de versants a eu des conséquences directes sur la population (Hétu et al., 2008). Il est d’autant plus logique d’adresser l’enjeu de la vulnérabilité des populations face aux risques naturels dans le contexte actuel de croissance démographique et de création de parcs nationaux au Nunavik, où l’on peut envisager d’éventuelles hausses de fréquentation des lieux publics (Duhaime, 2007).
Parmi ces hauts reliefs, les cuestas hudsoniennes forment un escarpement qui longe la côte est de la baie d’Hudson, révélant des parois rocheuses dépassant 200 mètres de hauteur. Ces versants abrupts font partie intégrante des paysages du lac Tasiujaq et du village d’Umiujaq, et sont l’un des principaux attraits du parc national Tursujuq (ARK, 2007). Or, la présence de dépôts de versant au pied de cet escarpement témoigne d’une occurrence de processus gravitaires dans la région. C’est notamment le cas dans la vallée Tasiapik qui, bien que ne représentant qu’un petit échantillon de la région naturelle des cuestas hudsonniennes, constitue un corridor naturel faisant la liaison entre Umiujaq et le lac Tasiujaq, dont le rivage représente les limites du parc national Tursujuq. Conséquemment, il s’agit d’un endroit très fréquenté où circulent les employés et visiteurs du parc, les chercheurs, mais surtout les Inuit d’Umiujaq, pour qui cet endroit a une signification particulière puisqu’ils y pratiquent des activités traditionnelles telles que la chasse, la pêche et la cueillette de petits fruits (ARK, 2007). D’ailleurs, une route carrossable construite au milieu des années 2000 permet de faciliter l’accès à ce secteur, mais sa proximité avec la paroi rocheuse et les dépôts de
Des campagnes de terrain durant trois étés consécutifs (2016, 2017 et 2018) ont permis d’investiguer les versants de la vallée Tasiapik. Ce projet de recherche vise à documenter les mouvements gravitaires, plus spécifiquement les éboulements rocheux et les avalanches, ainsi que leurs processus de déclenchement. L’étude se concentre sur l’évolution des versants au cours de l’Holocène, soit la période postérieure au retrait de l’inlandsis laurentidien, ainsi que sur une échelle de temps plus récente, soit par l’étude des dépôts avalancheux. Enfin, bien que ce projet aborde les risques associés aux mouvements gravitaires, il ne s’agit pas d’un exercice d’évaluation de la vulnérabilité, mais plutôt d’un mémoire visant l‘avancement des savoirs et la compréhension de ces aléas naturels en milieu subarctique.
II. Région et site d’étude
Localisation
La vallée Tasiapik (56°33'N, 76°28'O) se situe à l’extrémité nord du lac Tasiujaq (anciennement nommé lac Guillaume-Delisle et Richmond Gulf), environ 5 km à l’est du village d’Umiujaq sur la côte est de la baie d’Hudson, au Nunavik (Figure 1a). La vallée fait environ 4,5 km de long et 1,5 km de large, suivant une orientation nord-ouest sud-est. La hauteur des versants varie entre 50 m à l’amont de la vallée à près de 230 m à l’aval, près du lac Tasiujaq. Ce dernier est connecté à la baie d’Hudson par un étroit passage nommé Tursujuq (Le Goulet) situé 40 km au sud d’Umiujaq. Le lac fait partie du parc national Tursujuq.
Géologie régionale
La vallée Tasiapik est située à la rencontre de deux grands ensembles géologiques. D’abord, le socle précambrien de la province du Supérieur affleure au sud-est de la vallée, constitué de roches ignées et métamorphiques (granite, granodiorite et gneiss) d’âge néoarchéen, soit entre -2,73 et -2,68 Ga (Chandler et Schwarz, 1980 ; Chandler, 1988 ; Percival, 2007 ; Eaton et Derbyshire, 2010). Les versants sud-ouest et nord-est (colline Umiujaaluk) correspondent au groupe de Nastapoka et à la formation de Qingaaluk, une séquence volcano-sédimentaire paléoprotérozoïque (Figure 1b). Sous cette séquence se trouve le groupe de Richmond Gulf, aussi constitué d’un étagement de roches volcano-sédimentaires, mais n’affleurant qu’au sud-est la vallée (Stockwell et al., 1979 ; Chandler et Schwarz, 1980 ; Chandler, 1988 ; Eaton et Derbyshire, 2010). Cette séquence supracrustale a été mise en place lors de l’accrétion de la ceinture circum-supérieure, une marge passive paléoprotérozoïque, au craton du Supérieur pendant l’Orogénèse trans-hudsonienne (-1,8 Ga). Cet événement a d’ailleurs provoqué l’affaissement du graben du golfe de Richmond (Chandler et Schwarz, 1980 ; Chandler, 1988 ; Chandler et Parrish, 1989). Le pendage des couches forme un relief monoclinal asymétrique, appelé cuesta, se caractérisant par un revers faiblement incliné en direction de la baie d’Hudson vers l’ouest et d’un front abrupt orienté vers l’est ; cet escarpement s’étend sur 650 km le long de la côte est de la baie d’Hudson (Dionne, 1976 ; Guimont et Laverdière, 1980). La colline Umiujaaluk au nord-est, qui fait également partie du complexe de cuestas hudsoniennes, est une butte témoin dissociée de l’escarpement principal à la suite de processus érosifs. Les versants de la vallée Tasiapik expose, du haut vers le bas, des couches de basalte, de
d’érosion glaciaires telles que des stries, des cannelures et des broutures dans le substrat basaltique passablement poli situé au sommet des cuestas. Leur orientation témoigne d’un écoulement glaciaire vers l’ouest lors de la dernière glaciation (Craig, 1969 ; Hillaire-Marcel, 1976 ; Allard et Séguin, 1985).
Géomorphologie quaternaire
Les dépôts quaternaires dans la vallée Tasiapik témoignent d’une succession d’environnements sédimentaires postérieurs à la glaciation wisconsinienne (Figure 1b). Suite au retrait de l’inlandsis laurentidien à partir de 8200 ans cal. BP, l’affaissement glacio-isostatique a permis l’invasion des eaux marines de la mer de Tyrrell vers l’intérieur du continent. Les terres de la côte est de la baie d’Hudson ont été immergées à partir de 8000 ans cal. BP, jusqu’à une altitude d’environ 270 m au-dessus du niveau marin actuel (Hillaire-Marcel, 1976 ; Lavoie et al., 2012). De nombreuses crêtes de plages soulevées, édifiées lors de périodes de forte activité marine où les taux de relèvement glacio-isostatique et de remontée eustatique s’annulaient l’un par rapport à l’autre, sont visibles autour d’Umiujaq et du lac Tasiujaq (Fraser et al., 2005). Le taux de relèvement glacio-isostatique sur la côte est de la baie d’Hudson était d’abord rapide jusqu’à 6000 ans cal. BP, puis a progressivement diminué jusqu’à nos jours ; cet ajustement isostatique est néanmoins considéré comme étant l’un des plus rapides et importants au monde (Andrews, 1968 ; Hillaire-Marcel, 1976 ; Lavoie et al., 2012). Dans la partie basse de la vallée Tasiapik se sont déposés des faciès d’eau profonde (silts et argiles) et des faciès d’eau peu profonde (sables). Dans la partie amont de la vallée, la présence de sédiments fluvioglaciaires témoigne d’une stabilisation de la marge glaciaire autour de 8000 ans cal. BP, qui a entre autres permis l’édification d’un fan de contact sous-glaciaire ainsi que de petites moraines frontales (Lajeunesse et Allard, 2003). De nos jours, diverses formes périglaciaires dominent le paysage de la vallée, tels que des buttes et plateaux cryogéniques ainsi que des palses (Allard et Séguin, 1987 ; Lavoie et al., 2012 ; Pelletier et al., 2018).
Enfin, de nombreux dépôts de versant se sont accumulés sur les deux versants de la vallée, au pied de hautes parois ou de ressauts rocheux. Pour la présente étude, 18 zones d’accumulation de dépôts de versant ont été étudiés (Figure 1c).
Climat et végétation
La vallée Tasiapik est située en zone de pergélisol discontinu et est caractérisée par un climat subarctique. Les températures moyennes annuelles de l’air enregistrées entre 2013 et 2017 varient entre -5,6 et -4,2°C, mais avec de grands écarts, allant de 23°C à -36°C (Fortier, 2017). Les précipitations annuelles atteignent en moyenne 500 mm, dont 40% tombent sous forme de neige (Ménard et al., 1998).
La région d’Umiujaq se trouve à l’interface de la toundra arbustive et de la toundra forestière. La limite des arbres, qui délimite ces deux zones bioclimatiques, parcourt la vallée Tasiapik ; une mosaïque d’arbustes bas, d’éricacées et de lichens recouvre l’amont de la vallée alors qu’un couvert forestier dense occupe l’aval (Payette, 1983 ; Allard et Séguin, 1987 ; Provencher-Nolet et al., 2014 ; Pelletier et al., 2018). La strate arbustive, dominée par l’aulne crispé (Alnus crispa), le bouleau glanduleux (Betula glandulosa) et le saule (Salix sp.), a connu une expansion importante (arbustation) au cours du 20e siècle (Ménard et al., 1998 ; Provencher-Nolet et al., 2014 ; Pelletier et
al., 2018). L’épinette noire (Picea mariana), aussi présente sous forme arbustive, constitue l’unique
espèce arborescente. Enfin, plusieurs petites tourbières minérotrophes (fen) et mares thermokarstiques sont situées à proximité du rivage du lac Tasiujaq (Ménard et al., 1998 ; Pelletier et
Figure 1: Localisation de la vallée Tasiapik et les environs d'Umiujaq (A); géologie régionale et couverture sédimentaire dans la vallée Tasiapik (B); distribution des dépôts de versant et localisation des sites étudiés (C). Sources : MRNF, UMI orthomosaic, 2010.
III. Problématique, objectifs et hypothèses
Énoncé du problème
Au Nunavik, peu d’études ont porté sur les mouvements gravitaires et la géomorphologie des versants. Parmi ces travaux, St-Cyr (1986), Marion et al. (1995) et Decaulne et al. (2018) au lac Wiyâshâkimî, situé dans le parc national Tursujuq 120 km à l’est de la vallée Tasiapik, et Belzile (1984) à la péninsule de Manitounuk à 100 km au sud d’Umiujaq, ont étudié les processus d’éboulisation sur des versants rocheux. Ces travaux ont été réalisés dans des lieux isolés et peu fréquentés. D’importants dénivelés pointent toutefois à proximité d’établissements humains et méritent que l’on s’y attarde en raison des risques naturels qui pourraient leur être associés. D’ailleurs, de nombreux processus avalancheux ont été observés dans quelques villages du Nunavik, notamment l’avalanche de Kangiqsualujjuaq en 1999 (Lied et Domaas, 2000 ; Germain, 2016). La vallée Tasiapik, à proximité du parc national Tursujuq, est un lieu très fréquenté par les Inuit d’Umiujaq. Située à quelques kilomètres du village, elle fait office de corridor d’accès au lac Tasiujaq. La route pour s’y rendre longe le bas du versant, et la présence de talus d’éboulis à proximité de celle-ci suggère que ces versants sont - ou ont déjà été - actifs. Ainsi, sans le savoir, les usagers de cette route pourraient s’exposer à des risques. L’évaluation des risques passe néanmoins par la documentation et la compréhension des processus dynamiques se manifestant sur les versants. À première vue, l’étendue de ces processus est non négligeable considérant la vaste distribution des dépôts de versant dans la vallée, faisant partie intégrante du paysage. Enfin, telle qu’observé sur le terrain en juin 2018, la vallée semble propice au déclenchement d’avalanches de neige, et plus particulièrement du côté sud-ouest, à proximité de la route.
Ce projet de recherche cherche à répondre aux questions suivantes : 1) quels sont les processus gravitaires dominants? ; 2) comment se manifestent-ils dans la vallée selon les différents types de versants? ; et 3) comment ces processus sont-ils intervenus dans l’évolution holocène des versants?
Objectif général
Ce projet de recherche a comme objectif principal de documenter les processus gravitaires se manifestant dans la vallée Tasiapik et leur incidence sur la géomorphologie des versants.
Objectifs spécifiques
1) Documenter la géomorphologie associée aux éboulis rocheux et le développement des talus d’éboulis dans la vallée Tasiapik à partir de relevés géomorphologiques, depuis la dernière déglaciation jusqu’à nos jours ;
2) Documenter l’occurrence des avalanches sur les versants de la vallée Tasiapik en mettant en relation leur déclenchement avec les différents paramètres topographiques et météorologiques sur l’évolution du couvert de neige.
Hypothèses
À partir de résultats préliminaires et des observations faites sur le terrain, les hypothèses suivantes ont été émises :
1) La géomorphologie des talus d’éboulis est étroitement liée au contrôle géologique du versant, la séquence lithologique jouant un rôle prépondérant dans la dispersion des débris au bas du versant ;
2) La récurrence des périodes d’activité des versants semble obéir à deux modèles théoriques, soit le modèle de tarissement (exhaustion model) et le modèle bimodal (ou plurimodal) ;
3) Les conditions météorologiques sont favorables à la formation d’une corniche neigeuse au sommet des cuestas, et la chute de celle-ci est la principale cause de déclenchement d’avalanches dans la vallée.
IV. Méthodologie
La collecte des données s’est échelonnée sur quatre campagnes de terrain au cours des étés 2016, 2017 et 2018. Avant d’entamer les travaux sur le terrain, plusieurs talus ont pu être identifiés par photo-interprétation. Deux jeux d’orthophotographies provenant du Ministère des Ressources naturelles et de la Faune du Québec (MRNF) ont été utilisés, datant de 2004 (échelle 1/10 000, 25 cm de résolution) et de 2010 (échelle 1/10 000, 15 cm de résolution). Leur analyse a permis de constater une distribution inégale des dépôts de versant dans la région d’Umiujaq. Néanmoins, ceux-ci sont particulièrement abondants au front des cuestas ; deux secteurs de la vallée Tasiapik ont été identifiés, soit la colline Umiujaaluk (nord-est) et le versant sud-ouest. Ce dernier est d’autant plus intéressant qu’il est bordé par une route connectant Umiujaq au lac Tasiujaq.
Des relevés topographiques ont été réalisés le long de 18 transects longitudinaux sur les dépôts de versant à l’aide d’un DGPS (Differential Global Positioning System). Les points de cheminement ont été enregistrés à partir de l’apex des dépôts de versant jusqu’à leur base, perpendiculairement à la paroi rocheuse. La grande précision du DGPS permet d’exposer la forme générale des talus et d’obtenir des détails de microtopographie tels que l’inflexion et la texture des dépôts. Les données ont été traitées dans ArcGIS et Excel afin de produire des profils topographiques. Différents paramètres topographiques ont aussi été produits et analysés avec les points GPS, dont l’estimation du stade d’évolution à partir du rapport Ho/Hi, où Ho correspond à la hauteur du talus et Hi à la hauteur totale du versant (Francou, 1988 ; Sellier, 1992). Un versant dont le rapport s’approche de 1 témoigne d’un stade avancé en raison de la faible hauteur de la paroi résiduelle comparativement à la hauteur du talus.
Sur 12 de ces 18 transects longitudinaux ont été réalisés des relevés granulométriques et pétrographiques, en échantillonnant 25 fragments rocheux sélectionnés aléatoirement à chaque station d’échantillonnage. Ces stations sont disposées à intervalles d’environ 10-15 m le long des transects, depuis l’apex jusqu’à la base. Les débris ont été mesurés selon trois axes, soit longueur, largeur et épaisseur. Les mesures ont été compilées dans Excel et puis analysées afin d’en ressortir des statistiques descriptives. Des indices morphométriques ont également été calculés à partir de ces mesures (Pérez, 1998 ; Hétu et Gray, 2000). L’indice d’aplatissement (Fi) est calculé :
𝐹𝑖 =𝑎 + 𝑏 2𝑐
où a correspond à la longueur, b à la largeur et c à l’épaisseur du fragment mesuré (Cailleux, 1947). Plus la valeur Ai est élevée, plus le débris a une forme aplatie. Puis, l’indice d’allongement (Li) est
calculé :
𝐿𝑖 = 𝑎 𝑏
où a et b correspondent à la longueur et à la largeur du fragment mesuré (Schneiderhöhn, 1954). Une valeur Li élevée indique que le débris tend à avoir une forme allongée. Enfin, l’indice de
sphéricité (Si) est calculé :
𝑆𝑖 = ( 𝑏𝑐 𝑎2)
1 3
où a, b et c correspondent à la longueur, à la largeur et à l’épaisseur du fragment mesuré (Krumbein, 1941). Une valeur Si s’approchant de 1 indique que le débris tend à avoir une forme plus massive,
soit sphérique dans le cas d’un fragment arrondi et cubique dans le cas d’un fragment anguleux. Ces paramètres renseignent sur le comportement de chute des fragments, alors qu’un débris sphérique pourra davantage rouler tandis qu’un débris allongé et plat aura tendance à glisser.
Les relevés pétrographiques ont permis d’obtenir la lithologie des débris rocheux à partir de cassures fraîches. La provenance des débris, soit locale (associée au versant) ou exogène (origine glaciaire) est étroitement liée à leur lithologie et à leur dispersion sur le talus. L’aspect des arêtes a aussi été relevé et renseigne sur la provenance des débris ; un fragment anguleux aura une provenance locale, ayant subi peu d’érosion, alors qu’un fragment arrondi aura subi davantage de transport, notamment par la glace ou l’eau. Ensuite, la couverture végétale a été décrite à chacune des stations d’échantillonnage. Pour ce faire, des valeurs hiérarchisées ont été attribuées à chaque station en fonction du type de végétation et de l’estimation visuelle du pourcentage de recouvrement de la végétation sur les débris :
2) Débris récent : couverture faible à moyenne (20-40%), quelques espèces de lichens ; 3) Débris moyen : couverture moyenne (40-60%), plusieurs espèces de lichens ;
4) Débris ancien : couverture moyenne à élevée (60-80%), plusieurs espèces de liches et mousses ;
5) Débris très ancien : couverture élevée (80-100%), plusieurs espèces de lichens et mousses, potentiellement couvert d’arbustes bas.
Trois caméras à déclenchement automatisé ont été installées à l’été 2017 afin de suivre l’évolution du versant sud-ouest et ainsi distinguer les mouvements gravitaires qui ont lieu au cours d’une année, et particulièrement pendant l’hiver et au printemps. Deux caméras sont situées au pied de la paroi rocheuse près de zones d’accumulation de débris rocheux, alors que la troisième est située au sommet de la cuesta. Des photos sont prises à chaque jour et à toutes les heures entre 9h00 et 17h00 pour la période entre août 2017 et juin 2018, puis à toutes les quinze minutes entre juin 2018 et août 2018. Les conditions météorologiques qui prévalent lors de certaines périodes critiques peuvent être relevées grâce aux photos, et il est possible de corréler ces conditions avec les données météorologiques des stations climatiques SILA du Centre d’études nordiques d’Umiujaq, tout comme l’évolution du couvert nival au cours de l’hiver et au printemps. Enfin, des relevés héliportés ont été réalisés, au cours desquels il a été possible de photographier les versants sous divers angles, et d’y observer les particularités du terrain à plus petite échelle. Le sommet des cuestas a aussi été arpenté à pied afin de discerner les différents processus de démantèlement du substrat.
Références
Allard, M., & Seguin, M. (1985). La déglaciation d’une partie du versant hudsonien québécois: bassins des rivières Nastapoca, Sheldrake et à l’Eau Claire. Géographie
physique et Quaternaire, 39(1), 13-24.
Allard, M., & Seguin, M. K. (1987). The Holocene evolution of permafrost near the tree line, on the eastern coast of Hudson Bay (northern Quebec). Canadian Journal of Earth
Sciences, 24(11), 2206-2222.
Andrews, J. T. (1968). Postglacial rebound in Arctic Canada: similarity and prediction of uplift curves. Canadian Journal of Earth Sciences, 5(1), 39-47.
ARK (2007). Projet de parc national des Lacs-Guillaume-Delisle-et-à-l’Eau-Claire. État
des connaissances. Administration régionale Kativik, Service des ressources
renouvelables, de l’environnement, de territoire et des parcs, Section des parcs, Kuujjuaq, Québec.
Bégin, C., & Filion, L. (1985). Analyse dendrochronologique d'un glissement de terrain de la région du Lac à l'Eau Claire (Québec nordique). Canadian Journal of Earth
Sciences, 22(2), 175-182.
Belzile, M. C. (1984). Les versants rocheux périglaciaires à la presqu’île des Manitounouc Kuujjarapik, Nouveau-Québec. Mémoire de maîtrise. Département de
géographie, Université Laval.
Cailleux, A. (1947). L’indice d’émoussé des grains de sable et grès. Revue de
Geomorphologie Dynamique, 3, 78-87.
Chandler, F. W. (1988). The early Proterozoic Richmond Gulf Graben, East Coast of
Hudson Bay, Quebec (Vol. 362). Geological Survey of Canada.
Chandler, F. W., & Schwarz, E. J. (1980). Tectonics of the Richmond Gulf area, northern Quebec—a hypothesis. Current Research, Part C, Geological Survey of Canada,
Paper, 80, 59-68.
Chandler, F. W., & Parrish, R. R. (1989). Age of the Richmond Gulf Group and implications for rifting in the Trans-Hudson Orogen, Canada. Precambrian
Research, 44(3-4), 277-288.
Craig, B. G. (1969). Late-glacial and postglacial history of the Hudson Bay region. In Earth Science Symposium on Hudson Bay (Vol. 68, pp. 63-77). Pap. Geol. Surv. Can. Decaulne, A., Bhiry, N., Lebrun, J., Veilleux, S., & Sarrazin, D. (2018). Geomorphic evidence of Holocene slope dynamics on the Canadian shield–a study from Lac à l’Eau-Claire, western Nunavik. Écoscience, 1-15.
Dionne, J. C. (1976). Les grandes cuestas de la mer d'Hudson. GÉOS (Energie, Mines
et Ressources Canada), 5(1), 18-20.
Duhaime, G. (2007). Profil socioéconomique du Nunavik. Chaire Condition Autochtone. Eaton, D. W., & Darbyshire, F. (2010). Lithospheric architecture and tectonic evolution of the Hudson Bay region. Tectonophysics, 480(1-4), 1-22.
Fortier, R. (2017). Groundwater monitoring network from the Umiujaq region in Nunavik, Quebec, Canada, v. 1.3 (2012-2016). Nordicana D19, doi: 10.5885/45309SL-15611D6EC6D34E23.
Francou, B. (1988). L’éboulisation en haute-montagne – Andes et Alpes –, six contributions à l’étude du système corniche-éboulis en système périglaciaire. Thèse
d’État, Université Paris, 7.
Fraser, C., Hill, P. R., & Allard, M. (2005). Morphology and facies architecture of a falling sea level strandplain, Umiujaq, Hudson Bay, Canada. Sedimentology, 52(1), 141-160. Germain, D. (2016). Snow avalanche hazard assessment and risk management in northern Quebec, eastern Canada. Natural Hazards, 80(2), 1303-1321.
Guimont, P., & Laverdiere, C. (1980). Le sud-est de la mer d'Hudson: un relief de cuesta. The Coastline of Canada, SB McCann (edit.), Geological Survey of Canada,
Paper, 80-10.
Hétu, B., & Gray, J. T. (2000). Effects of environmental change on scree slope development throughout the postglacial period in the Chic-Choc Mountains in the northern Gaspé Peninsula, Québec. Geomorphology, 32(3-4), 335-355.
Hétu, B., Brown, K., & Germain, D. (2008). L’inventaire des avalanches mortelles au Québec depuis 1825 et ses enseignements. In Proceedings of the 4th Canadian
conference on geohazards, Université Laval, Québec (pp. 20-24).
Hillaire-Marcel, C. (1976). La déglaciation et le relèvement isostatique sur la côte est de la baie d’Hudson. Cahiers de géographie du Québec, 20(50), 185-220.
Krumbein, W. C. (1941). Measurement and geological significance of shape and roundness of sedimentary particles. Journal of Sedimentary Research, 11(2), 64-72. Lajeunesse, P., & Allard, M. (2003). The Nastapoka drift belt, eastern Hudson Bay: implications of a stillstand of the Quebec–Labrador ice margin in the Tyrrell Sea at 8 ka BP. Canadian Journal of Earth Sciences, 40(1), 65-76.
Lavoie, C., Allard, M., & Duhamel, D. (2012). Deglaciation landforms and C-14 chronology of the Lac Guillaume-Delisle area, eastern Hudson Bay: a report on field evidence. Geomorphology, 159, 142-155.
Lied, K., & Domaas, U. (2000). Avalanche hazard assessment in Nunavik and on Côte-Nord, Québec, Canada. Norwegian Geotechnical Institute.
Luckman B.H. (2013) Talus Slopes. In: Elias S.A. (ed.), The Encyclopedia of Quaternary Science, vol. 3, pp. 566-573. Amsterdam: Elsevier.
Marion, J., Filion, L., & Hétu, B. (1995). The Holocene development of a debris slope in subarctic Québec, Canada. The Holocene, 5(4), 409-419.
Ménard, É., Allard, M., & Michaud, Y. (1998). Monitoring of ground surface temperatures in various biophysical micro-environments near Umiujaq, eastern Hudson Bay, Canada. In Proceedings of the 7th International Conference on Permafrost. Yellowknife,
Canada (pp. 723-729).
Ministère des ressources naturelles et de la faune (2010). Portrait territorial –
Nord-du-Québec, 2010. Nord-du-Québec, Gouvernement du Québec.
Payette, S. (1983). The forest tundra and present tree-lines of the northern Québec-Labrador peninsula. Nordicana, 47, 3-23.
Pelletier, M., Allard, M., & Levesque, E. (2018). Ecosystem changes across a gradient of permafrost degradation in subarctic Québec (Tasiapik Valley, Nunavik, Canada). Arctic
Science, (0), 1-26.
Percival, J. A. (2007). Geology and metallogeny of the Superior Province, Canada. In Mineral deposits of Canada: A synthesis of major deposit-types, district metallogeny,
the evolution of geological provinces, and exploration methods (Vol. 5, pp. 903-928).
Geological Association of Canada, Mineral Deposits Division. Special Publication No. 5. Pérez, F. (1998). Talus fabric, clast morphology, and botanical indicators of slope processes on the Chaos Crags (California Cascades), USA. Géographie physique et
Quaternaire, 52(1), 47-68.
Provencher-Nolet, L., Bernier, M., & Lévesque, E. (2014). Quantification des changements récents à l'écotone forêt-toundra à partir de l'analyse numérique de photographies aériennes. Écoscience, 21(3-4), 419-433.
Schneiderhöhn, P. (1954). Eine vergleichende Studie über Methoden zur quantitativen Bestimmung von Abrundung und Form an Sandkörnern (Im Hinblick auf die Verwendbarkeit an Dünnschliffen.). Heidelberger Beiträge zur Mineralogie und
Petrographie, 4(1-2), 172-191.
Sellier, D. (1992). Évolution comparée de versants quartzitiques des Highlands d'Écosse et de Norvège centrale (Rates of quartzitic slopes evolution in the scottish Highlands and central Norway). Bulletin de l'Association de Géographes
St-Cyr, N. (1986). Formation et évolution des versants rocheux des îles centrales du lac à l’Eau Claire, Québec subarctique. Mémoire de maîtrise. Département de géographie,
Université Laval.
Stockwell, C. H., McGlynn, J. C., Emslie, R. F., Sanford, B. V., Norris, A. W., Donaldson, J. A., Fahrig, W. F. & Currie, K. L. (1979). Géologie du Bouclier canadien. In Douglas, R. J. W. & Tremblay, L. P., Géologie et ressources minérales du Canada (p. 117-119).
Chapitre 1
Talus slope characterization in Tasiapik Valley
(subarctic Québec): evidence of past and present slope
processes
Samuel Veilleux1,2, Najat Bhiry1,2 and Armelle Decaulne3
1Département de géographie, Université Laval, Québec, Canada 2Centre d’études nordiques, Université Laval, Québec, Canada
Résumé
Des relevés topographiques, granulométriques, morphométriques, pétrographiques et de végétation ont été effectués sur les versants de la vallée Tasiapik, près d’Umiujaq (Nunavik) dans le but de documenter les processus gravitaires dominants et leur impact géomorphologique. Les talus d’éboulis font partie intégrante du paysage de la vallée; on les retrouve à la fois sur le versant sud-ouest et nord-est, au pied d’abruptes falaises rocheuses. La lithologie des dépôts de versant témoigne de leur provenance locale, soit de chutes discrètes issues de la paroi adjacente. Localement, la faible couverture de lichens et de mousses sur les talus indique que les débris sont récents, alors qu’ailleurs des couverts arbustifs ont colonisés les talus, démontrant la faible activité de nos jours, concomitante avec une progression récente de la végétation arbustive. Suite à la dernière déglaciation, les processus paraglaciaires ont potentiellement favorisé l’instabilité des versants. Les processus périglaciaires actifs de nos jours induisent un démantèlement important du substrat rocheux, et par conséquent rendent disponible une grande quantité de matériel. L’utilisation de caméras automatiques au cours de l’hiver 2017-2018 a permis d’observer de nombreux événements d’avalanche, mais peu d’événements d’éboulis. Une grande quantité de débris ont été transporté vers les talus au pied du versant par les avalanches printanières, fréquentes en mai et juin 2018. La neige a également permis une redistribution des débris sur les talus.
Abstract
Topographic, granulometric, morphometric, petrographic and vegetation surveys were conducted on the slopes of Tasiapik Valley, near Umiujaq (Nunavik), to document mass wasting processes and their geomorphological impact. Talus slopes, widespread at the foot of the steep rockwalls of Tasiapik Valley, are an important landscape feature in the area. The lithology of the slope deposits attest their local origin, namely the result of rockfalls coming from the adjacent wall. Locally, poor lichens and mosses vegetation covering the clasts exhibits recently fallen debris; elsewhere, dense shrub cover has colonized the slopes demonstrating the low activity nowadays. Following the last deglaciation, paraglacial processes have potentially favoured slope instabilities. On-going periglacial processes have led to extensive dismantling of the rockface, enabling for debris supply. The use of automatic cameras during the winter 2017-2018 resulted in the observation of many snow-avalanche events; however few rockfall events have been observed. Spring snow avalanches have carried rock debris to the talus at the foot of the slope; snow also enabled debris redistribution on the slopes. Key words: morphometry, slope dynamics, snow avalanches, periglacial, Nunavik.
I.
Introduction
Northern landscapes have undergone many changes since their deglaciation. In particular, paraglacial conditions (e.g. glacio-isostatic rebound) induced talus slope formation by supplying debris through the pressure release on rock fractures and freeze-thaw processes (Ballantyne and Benn, 1994; Matsuoka and Sakai, 1999; Ballantyne, 2002; Matsuoka, 2008).
Nunavik is part of the low-Arctic region of eastern Canada and its landscape consists of low hills, basins and plateaus. The few studies that have been conducted in this vast region have demonstrated the occurrence of slope processes on slopes less than 100 m high (Belzile, 1984; Bégin and Filion, 1985; St-Cyr, 1986; Marion et al., 1995; Germain and Martin, 2012; Germain, 2016). Recent studies (Decaulne et al., 2018; Bhiry et al., 2019) conducted at Wiyâshâkimî Lake in Tursujuq National Park (Nunavik) showed that talus slope formation started after deglaciation at about 4600 BP, and that slope processes are still active today. Some of the villages in Nunavik (Salluit, Kangiqsujuaq and Kangiqsualujjuaq) are located within glacial valleys with prominent slopes, while other villages (Umiujaq) are situated near high cuesta relief (~230 m). Accordingly, it is crucial to document slope dynamics and to evaluate associated risks on the local population, visitors and infrastructures. For instance, in Kangiqsualujjuaq (northeastern Nunavik), a dreadful snow avalanche hit the gymnasium of Satuumavik school during the 1999 New Year’s Eve celebrations, causing the death of 9 people and injuring 25 (Bérubé, 2000; Lied and Domaas, 2000; Germain, 2016). However, no extensive research has been conducted on slope processes in the Umiujaq area (including snow avalanches, landslide and rockfalls), their triggering factors, their occurrence and their runout distance. General conditions are conducive for bedrock dismantling and mass wasting, even with limited slope heights, but additional knowledge about slope processes is still required.
The main objective of the study is to document landforms organisation built by gravitational processes in Tasiapik Valley and their contribution to talus development based on geomorphological surveys. This study discusses slope evolution during the Holocene, from the retreat of the Laurentide Ice Sheet in the area to the present-day, highlighting the potential risk at the valley bottom.
II.
Study area
Tasiapik Valley (56°33' N, 76°28' W) is located 5 km east of the Inuit village of Umiujaq, on the east coast of Hudson Bay in Nunavik, Québec (Figure 3a). It is approximately 4.5 km long and 1.5 km wide, following a northwest-southeast orientation. At the southeastern end of the valley lies Tasiujaq Lake (formerly named Guillaume-Delisle Lake or Richmond Gulf), a 691 km2 brackish water body connected to the Hudson Bay by a narrow cataclinal channel called Le Goulet (ARK, 2007). The lake is part of Tursujuq National Park, created in 2013.
The regional geology is characterized by a Paleoproterozoic volcano-sedimentary sequence lying unconformably on the Precambrian shield (Figure 3b). The volcano-sedimentary sequence includes limestone, quartz arenite, dolomite and sandstone strata (Qingaaluk Formation) underlying a thick (~15 m) basalt layer (Nastapoka Group) dipping westward (Stockwell et al., 1979; Chandler and Schwarz, 1980; Chandler, 1988; Eaton and Derbyshire, 2010). This asymmetrical monoclinal relief (cuesta) consists of a gentle western slope and a steep eastern slope and extends over 650 km along the east coast of Hudson Bay (Dionne, 1976; Guimont and Laverdière, 1980). Tasiapik Valley lies at the frontslope of the cuesta on its southwestern side, whereas the northeastern side consists of a residual butte called Umiujaaluk Hill.
Quaternary deposits on the east coast of Hudson Bay are the result of a succession of sedimentary environments following the retreat of the Laurentide Ice Sheet at about 8200 cal. BP (Hillaire-Marcel, 1976; Allard and Séguin, 1985; Lavoie et al., 2012) (Figure 3b). Lowlands below 271 m a.s.l, the altitudinal limit of the postglacial Tyrrell Sea in Tasiujaq Lake area (Fraser et al., 2005; Lavoie et al., 2012), are covered by deep-water and shallow-water marine sediments, and littoral deposits (raised beaches) that were formed during stages of rapid glacio-isostatic uplift (Hillaire-Marcel, 1976). A glaciomarine fan complex lies in the upstream part of the valley. It consists of fluvioglacial material that was deposited during a stillstand of the ice margin around 8000 cal. BP (Lajeunesse and Allard, 2003b).
The study area has a cold subarctic climate and it is located in the discontinuous permafrost zone (Allard and Lemay, 2012). Mean annual air temperature recorded between 2013 and 2017 varies between -5.6 and -4.2°C, with maxima of 23°C and minima of -36°C (Fortier, 2017). Mean annual
area is located at the edge of the shrub and forest tundra zones; low shrubs, ericaceous plants and lichens cover the upstream part of Tasiapik Valley, while dense forest cover occupies the downstream part (Payette 1983). Shrub cover has expanded significantly (shrubification) during the 20th century (Ménard et al., 1998; Provencher-Nolet et al., 2014; Pelletier et al., 2018).
The SW side of Tasiapik Valley has a near-vertical rockwall. It is approximately 50 m high in the upstream part of the valley, but it increases to 230 m near Tasiujaq Lake in the downstream part. Slope deposits lie at the base of the escarpment, connecting the rockwall to the valley floor, but have also accumulated on basaltic rocky outcrops in the uppermost part of the rockwall (Figure 3c). The NE side features a step-like topography, with slope deposits either located at the base of the slope or perched on basaltic and sedimentary rocky outcrops. A gravel road connecting Umiujaq to Tasiujaq Lake follows the cuesta frontslope on the SW side.
Figure 3: Location of Tasiapik Valley within the Umiujaq area (A); regional geology and quaternary sediments in Tasiapik Valley (B); distribution of the talus slopes and investigated slopes (C). Sources: MRNF (A, B), UMI orthomosaic (2010) (C).
III.
Methods
For this study, 18 talus slopes were investigated, on the SW and NE sides of Tasiapik Valley (Figure 3c). Data were collected over four field campaigns during the summers of 2016 (August), 2017 (August) and 2018 (June and August). Several slope deposits were identified by satellite imagery prior to initiating fieldwork. Two sets of orthophotos from Québec’s Ministère des Ressources naturelles et de la Faune (MRNF) were used, one dating from 2004 (scale 1/10,000, 25 cm resolution) and the other from 2010 (scale 1/10,000, 15 cm resolution).
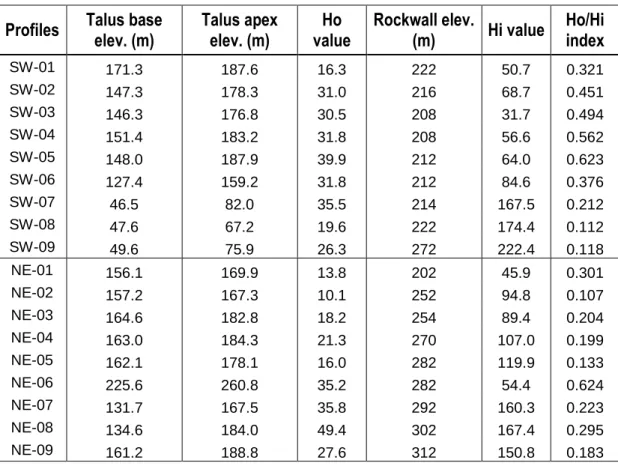
Topographic surveys were conducted along 18 longitudinal transects using a Leica DGPS (Differential Global Positioning System). Waypoints were recorded from the apex of the slope deposits to their base, perpendicular to the rock face. Data were processed in ArcGIS and Excel to produce topographic profiles, revealing the microtopographic features such as inflection and texture in accurate details. The estimation of the stage of evolution is carried out from the Ho/Hi ratio, where Ho corresponds to the height of the talus slope and Hi to the total height of the slope including the rockwall (Francou, 1988; Sellier, 1992). The ratio gives an overview of the exhaustion of the remaining rockwall (debris source) in concomitance with the talus slope formation on a longer timescale, namely since the last deglaciation. For example, a ratio approaching 1 indicates an advanced slope development stage due to the low height of the residual wall compared to the height of the talus slope.
Topographic data and satellite imagery were used to measure rockfall runout distances (horizontal travel distance) calculated from the source area to the farthest slope debris. In addition, the reach angle, calculated from the source-area to the farthest slope debris, and the shadow angle, calculated from the apex of the talus to the farthest slope debris, provide information about the extent of slope processes in the area.
On 12 of the 18 longitudinal transects, granulometric and petrographic surveys were conducted by sampling 25 randomly selected rock fragments at intervals of 10-15 m along the transects. Debris were measured along three axes: length (a-axis), width (b-axis) and thickness (c-axis). Measurements were compiled in Excel and then analyzed to produce descriptive statistics. Morphometric indices were also calculated from these measures (Pérez 1998, Hétu and Gray 2000). The flattening index (Fi) is calculated as follows:
𝐹𝑖 =𝑎 + 𝑏 2𝑐
where a corresponds to the length, b to the width and c to the thickness of the fragment (Cailleux, 1947). A high Fi value indicates that the debris has a flatter shape. The elongation index (Li) is
calculated as follows:
𝐿𝑖 = 𝑎 𝑏
where a and b correspond to the length and width of the fragment (Schneiderhöhn, 1954). A high Li
value indicates that the debris tends to be elongated. Finally, the sphericity index (Si) is calculated as
follows: 𝑆𝑖 = ( 𝑏𝑐 𝑎2) 1 3
where a, b and c correspond to the length, width and thickness of the fragment (Krumbein, 1941). A value Si approaching 1 indicates that the debris has a more massive shape, spherical in the case of a
rounded fragment and cubic for an angular fragment. These indices document the falling behavior of clasts, since spherical debris are prone to rolling, while elongated flat debris are more likely to slide. Petrographic surveys provide lithological data for the measured fragments. Their origin, either local (associated with the local slope development) or exogenous (generally from glacial transport and deposition), is closely related to their lithology, thus their general shape, and their position on the slope. The edges of the debris were characterized, with a view to determining their origin: an angular fragment has undergone very little erosion, indicating a short transportation distance/local source, while debris transported by glaciers or reworked in the Tyrrell Sea has a pronounced rounded shape. Vegetation cover was described at each sampling station in order to assess recent and current process activity. Hierarchical values were attributed to each station based on the type of vegetation and the estimated percentage of coverage on the debris, providing relative age-estimates:
3) Medium-aged debris: several lichen species partially cover the clast;
4) Old-aged debris: several species of lichens and mosses partially cover the clast;
5) Very old-aged debris: several species of lichens and mosses totally cover the clast; potentially also covered with low shrubs.
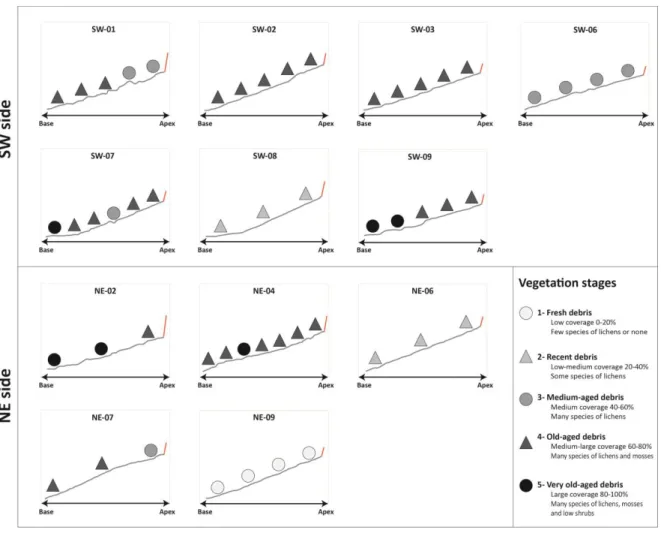
Vegetation classification values and Ho/Hi ratio values were used to estimate the stage of slope development. The addition of these two values gives an overview of the slope evolution from both short term (vegetation) and long term (Ho/Hi) perspectives. Values of 1 to 5 were assigned to each longitudinal profile according to their Ho/Hi ratio, following the Jenks natural breaks classification method (Jenks, 1967); a value approaching 1 indicates a low Ho/Hi ratio, thus a younger development stage. The vegetation values (i.e. the lowest - freshest - value per profile, ranked 1 to 5 according to the relative age estimate described above) were added to provide an overall development score. In addition, the age of shrubs at the bottom of talus along the SW-07, SW-08 and SW-09 profiles was determined using dendrochronology on 11 black spruce samples (Picea mariana).
Finally, in order to monitor slope movements on a shorter time scale, three Reconyx PC800 automatic time-lapse cameras were installed on the SW side of the valley in August 2017. One of the cameras (TAS 1) is located on the cuesta edge, above the rockwall and talus along the SW-07 and SW-08 profiles (Figure 4). The latter is covered by a second camera (TAS 2) that is located 300 m away from the rockwall. A third camera (TAS 3) is located further upstream near the base of the talus along the SW-06 profile. Approximately 14,000 photos were taken over a one-year period from August 2017 to August 2018 in the valley. Photos were taken during daytime at one-hour intervals until June 2018, then at 15 or 30 minutes intervals (depending on the location) until August 2018.
Figure 4: Location of the cameras along the SW side of Tasiapik Valley. Field of view of each camera is shown on the left. Source: UMI orthomosaic (2010).
IV.
Results and interpretation
1. Topography of slope deposits
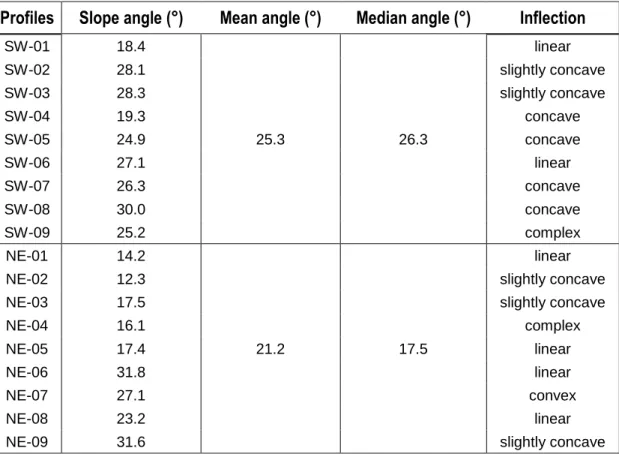
The SW profiles show a steeper slope gradient, with a mean angle of 25.3° and a median angle of 26.3°, while the NE profiles have a mean angle of 21.2° and a median angle of 17.5° (Table 1; Figure 5). A slight or distinct concavity of the talus slope is apparent on six of the nine SW profiles, while the SW-01 and SW-06 profiles are virtually linear. The SW-09 profile shows a more complex shape (linear proximal part and chaotic distal part). On the NE side, there is no distinct concave profile, yet seven of the nine profiles show either a slightly concave or a linear shape, while the NE-04 and NE-07 profiles respectively show a complex and a convex shape. Four profiles (07, SW-08, SW-09 and NE-09) exhibit a strong basal concavity (Figure 5).
Table 1: Topographic parameters of the investigated slopes.
Profiles Slope angle (°) Mean angle (°) Median angle (°) Inflection
SW-01 18.4 25.3 26.3 linear SW-02 28.1 slightly concave SW-03 28.3 slightly concave SW-04 19.3 concave SW-05 24.9 concave SW-06 27.1 linear SW-07 26.3 concave SW-08 30.0 concave SW-09 25.2 complex NE-01 14.2 21.2 17.5 linear
NE-02 12.3 slightly concave
NE-03 17.5 slightly concave
NE-04 16.1 complex
NE-05 17.4 linear
NE-06 31.8 linear
NE-07 27.1 convex
NE-08 23.2 linear
2. Relative dating of slopes
The mean Ho/Hi index on the SW (0.36) and NE sides (0.25) indicates that the remaining rockwall is generally higher than talus slopes (index < 0.5) (Table 2). However, the step-like topography on the NE side, compared to the near-vertical rockwall on the SW side, could mean that the NE side has reached a more advanced stage of development. Talus slopes near the southern margin of both sides (along the SW-07, SW-08, SW-09 and NE-09 profiles) are located under high vertical rockwalls with Ho/Hi index below 0.2, thus indicating a younger development stage. The SW-04 and SW-05 profiles indicate an older stage than the other SW profiles, with respective index values of 0.56 and 0.62.
Examination of the vegetation covering the surficial debris on the slope deposits revealed the presence and position of few fresh deposits. Most of the debris had a clear vegetation cover on the SW side (Figure 6). In the apical parts of the talus slopes, various lichens and/or mosses are abundant, while a discontinuous thin strip of herbaceous plants and low shrubs is located at the edge of the rockwall undisturbed by present-day slope activity. Distal parts also feature abundant lichens and mosses on most of the clasts along with thick mosses covering the slope deposits and low shrubs; this trend is especially evident on the SW-07 and SW-09 profiles. A similar trend was observed on the NE profiles, as most sampling stations in the apical part of the talus slopes show medium to old-age status, while sampling stations in the distal parts indicate older-age status. However, debris along the SW-08, NE-06 and NE-09 profiles appear to be more recent, with little overall coverage and the presence of few lichens. Some fresh debris were scattered along most of the profiles.
Table 2: Calculation of Ho/Hi index.
Profiles Talus base elev. (m) Talus apex elev. (m) value Ho Rockwall elev. (m) Hi value Ho/Hi index
SW-01 171.3 187.6 16.3 222 50.7 0.321 SW-02 147.3 178.3 31.0 216 68.7 0.451 SW-03 146.3 176.8 30.5 208 31.7 0.494 SW-04 151.4 183.2 31.8 208 56.6 0.562 SW-05 148.0 187.9 39.9 212 64.0 0.623 SW-06 127.4 159.2 31.8 212 84.6 0.376 SW-07 46.5 82.0 35.5 214 167.5 0.212 SW-08 47.6 67.2 19.6 222 174.4 0.112 SW-09 49.6 75.9 26.3 272 222.4 0.118 NE-01 156.1 169.9 13.8 202 45.9 0.301 NE-02 157.2 167.3 10.1 252 94.8 0.107 NE-03 164.6 182.8 18.2 254 89.4 0.204 NE-04 163.0 184.3 21.3 270 107.0 0.199 NE-05 162.1 178.1 16.0 282 119.9 0.133 NE-06 225.6 260.8 35.2 282 54.4 0.624 NE-07 131.7 167.5 35.8 292 160.3 0.223 NE-08 134.6 184.0 49.4 302 167.4 0.295 NE-09 161.2 188.8 27.6 312 150.8 0.183
Figure 6: Vegetation stages along the talus slopes.
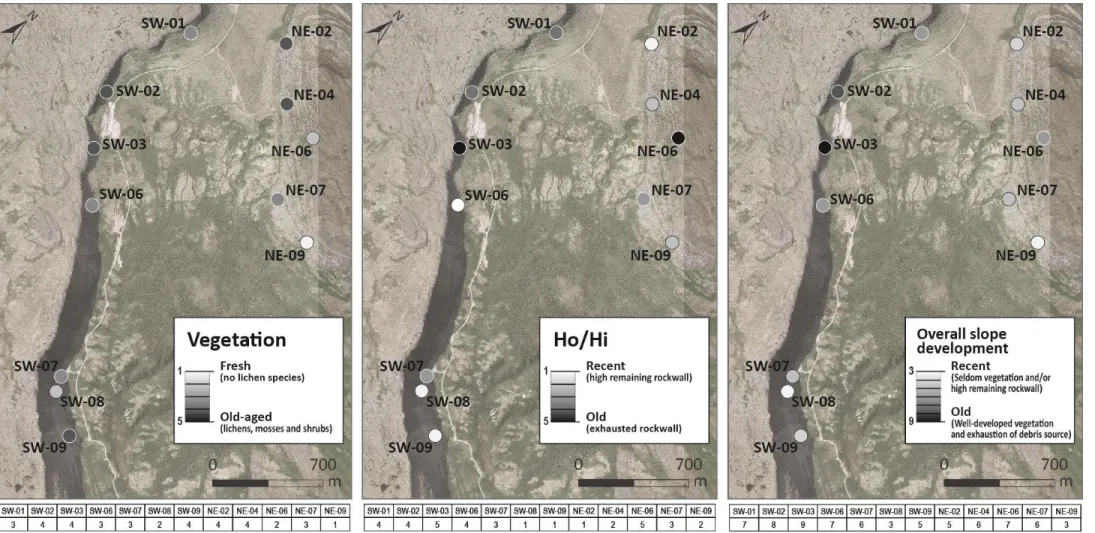
By adding up the Ho/Hi index values and the vegetation classification values, we can estimate the developmental stage of the slopes. As shown on Figure 7, the SW-08 and NE-09 profiles seem to be at the youngest developmental stage among all the talus slopes. The Ho/Hi index and the vegetation classification values are consistent for some profiles, showing a concomitance for both parameters. For example, the talus slope along NE-09 profile has a low Ho/Hi index (0.183) and there is very poor lichen cover on the debris. However, the two parameters proved to be contradictory for some talus slopes, particularly for the SW-09 profiles, due to the overly high rockwall (increased debris supply potential) and the presence of well-developed vegetation (limited debris supply on the talus slope). Both of these findings indicate that the recent debris supply is sporadic.
3. Source and morphometry of slope deposits
Three classes of debris were identified along the investigated profiles: 1) basalt, 2) sedimentary rocks (comprising dolomite, limestone, quartz arenite and sandstone), and 3) granitic gneiss (Figure 8). On the SW side, sedimentary rock debris comprised 64.5% of the sampled clasts, whereas basalt debris accounted for 35.4% and gneiss for 0.07%. Sedimentary rock debris represented a larger proportion on the NE side, accounting for 89.4% of all clasts, while basalt and gneiss accounted for 6.4% and 4.2%. Assuming the top basalt layer is ~15 m thick throughout the valley; those values coincide with the large proportion of sedimentary rock strata available for debris supply on the exposed rockwall. Sedimentary rock strata account for 90% (~140 m) of the rockwall (~155 m) above the SW-07, SW-08 and SW-09 profiles. In the upstream part of the SW side, sedimentary rock strata account for 57% (~20 m) of the rockwall (~35 m). On the NE side, the top basalt layer has considerably receded on most of the investigated slopes, revealing rocky outcrops composed of sedimentary rock strata. However, the rockwall above the NE-06 profile is mainly composed of basalt (68% of total height).
By comparing the respective proportions of each lithology at sampling stations along the profiles, many of the slope deposits show consistent ratios of sedimentary rocks and/or basalt debris from the apex to the base of the slope. On the SW side, the proportion of basalt debris varies between 80% and 84% throughout the sampling stations on the SW-02 profile and between 14% and 26% on the SW-07 profile. On the NE side, the proportion of sedimentary rock debris varies between 80% and 88% on the NE-02 profile, while the NE-08 and NE-09 profiles show no difference as sedimentary rock debris compose 100% of the talus. However, some of the slope deposits show an increasing proportion of basalt material toward the foot of the talus. For example, along the SW-08 profile, the basalt debris percentage increases from 17% at the apex to 37% at the bottom of the slope; on the SW-09 profile, it increases significantly from 12% to 100%. Finally, on the NE-06 profile, the basalt debris are only located at the bottom of the talus, whereas the sedimentary rock debris comprises the entire apical part.
Clasts were measured to document the size and morphometry of the slope deposits, and their distribution along the deposits (Figure 9). On the SW side, the debris (a-axis) range in size from 30 to 154 cm on average (Table 3). However, standard deviation values show important disparities
flatness index values range from 2.36 to 4.22. Lengthening and sphericity indices do not vary much, ranging from 1.48 to 1.86 and from 0.54 to 0.65. On the NE side, sizes range from 83 to 178 cm on average, while standard deviation values show important disparities between the measured clasts. The largest clasts range in size between 350 and 950 cm, while the mean flatness index values range from 2.29 to 3.58. Lengthening and sphericity indices show similar values as the profiles on the SW side, ranging from 1.40 to 1.82, and from 0.57 to 0.69. By comparing the calculated index values along all profiles, the clasts tend to have a flatter and more elongated shape in the downstream part of the valley on the SW side (SW-07, SW-08 and SW-09), and along the NE-06 and NE-09 profiles. This morphology is more associated with sedimentary rock debris due to the dismantling of the thin sedimentary layers which represents the majority (84.5%) of the sampled debris along these profiles (given the larger proportion of sedimentary rock within the rockwall). For most of the profiles, the mean and median a-axis values tend to increase toward the base of the slopes. As for the morphometry indices, 50% of the profiles show an increasing trend for flatness and sphericity values toward the base of the slope, while the lengthening index of clasts increases from the apex to the base for 75% of the profiles.
Debris from every sampling station on the SW side were analyzed and described as being either angular or subangular, which indicates their local slope-related provenance, whereas the NE side shows a greater diversity of debris shape. For the NE-02 and NE-04 profiles, rounded/sub-rounded debris are abundant at the base and angular debris are found near the apex of the talus slopes, meaning that slope-related debris have accumulated in the proximal part and mixed with rounded heavily reworked debris toward the distal part.
Table 3: Debris size and morphometric parameters along the longitudinal profiles.
Profiles a-axis (cm) b-axis (cm) c-axis (cm) b/a c/b Flatness Lengthening Sphericity
SW -01 median 45.00 32.00 19.00 0.70 0.63 1.96 1.43 0.65 mean 65.54 45.74 27.54 0.69 0.64 2.36 1.53 0.65 standard dev. 58.57 44.99 26.57 0.16 0.22 1.24 0.40 0.12 maximum 450.00 350.00 180.00 0.98 1.00 10.42 2.73 0.93 minimum 11.00 7.00 3.00 0.37 0.11 1.10 1.03 0.38 range 439.00 343.00 177.00 0.61 0.89 9.31 1.70 0.55 SW -02 median 60.00 37.00 21.00 0.63 0.64 2.10 1.58 0.62 mean 78.18 48.93 30.99 0.64 0.63 2.55 1.68 0.62 standard dev. 80.30 48.04 35.48 0.17 0.21 2.44 0.51 0.11 maximum 600.00 350.00 290.00 1.15 1.04 27.50 3.64 0.87 minimum 8.00 5.00 1.00 0.28 0.05 1.17 0.87 0.26 range 592.00 345.00 289.00 0.88 0.99 26.33 2.77 0.61 SW -03 median 84.00 50.00 23.00 0.67 0.57 2.21 1.50 0.60 mean 154.48 95.20 60.77 0.67 0.58 2.84 1.62 0.62 standard dev. 262.49 141.39 108.40 0.18 0.24 1.88 0.49 0.13 maximum 1900.00 1000.00 800.00 1.00 1.11 13.75 3.32 0.91 minimum 8.00 7.00 3.00 0.30 0.10 1.07 1.00 0.32 range 1892.00 993.00 797.00 0.70 1.01 12.68 2.32 0.59 SW -06 median 50.00 36.00 17.00 0.72 0.58 2.21 1.38 0.61 mean 77.14 54.89 29.70 0.72 0.56 2.69 1.48 0.64 standard dev. 78.61 55.69 34.26 0.17 0.24 1.36 0.45 0.13 maximum 470.00 310.00 190.00 1.04 1.00 7.50 3.86 0.93 minimum 5.00 5.00 3.00 0.26 0.15 1.06 0.96 0.33 range 465.00 305.00 187.00 0.78 0.85 6.44 2.90 0.60 SW -07 median 23.50 14.00 6.00 0.63 0.50 3.00 1.58 0.53 mean 30.08 17.27 8.24 0.62 0.89 4.22 1.81 0.54 standard dev. 24.17 11.83 7.91 0.18 1.33 3.78 0.76 0.13 maximum 206.00 100.00 70.00 1.00 10.00 29.50 6.80 0.94 minimum 6.00 2.00 1.00 0.15 0.04 1.10 1.00 0.21 range 200.00 98.00 69.00 0.85 9.96 28.40 5.80 0.73 SW -08 median 36.00 20.00 11.00 0.59 0.56 2.57 1.69 0.56 mean 48.16 27.31 14.29 0.60 0.57 2.96 1.86 0.57 standard dev. 42.23 26.74 12.83 0.18 0.22 1.53 0.80 0.12 maximum 280.00 223.00 100.00 1.00 1.00 11.17 10.42 0.92 minimum 4.00 3.00 1.00 0.10 0.09 1.07 1.00 0.19