HAL Id: hal-01360663
https://hal.archives-ouvertes.fr/hal-01360663
Submitted on 6 Sep 2016HAL is a multi-disciplinary open access archive for the deposit and dissemination of sci-entific research documents, whether they are pub-lished or not. The documents may come from teaching and research institutions in France or abroad, or from public or private research centers.
L’archive ouverte pluridisciplinaire HAL, est destinée au dépôt et à la diffusion de documents scientifiques de niveau recherche, publiés ou non, émanant des établissements d’enseignement et de recherche français ou étrangers, des laboratoires publics ou privés.
Interval Analysis: A New Tool for the Characterization
of an Epoxy-Amine/Aluminum System
Mickaël Pomes-Hadda, Maëlenn Aufray, Sombel Diaham
To cite this version:
Mickaël Pomes-Hadda, Maëlenn Aufray, Sombel Diaham. Interval Analysis: A New Tool for the Characterization of an Epoxy-Amine/Aluminum System. Polymers, MDPI, 2015, vol. 7 (n° 4), pp. 644-654. �10.3390/polym7040644�. �hal-01360663�
O
pen
A
rchive
T
OULOUSE
A
rchive
O
uverte (
OATAO
)
OATAO is an open access repository that collects the work of Toulouse researchers and makes it freely available over the web where possible.
This is an author-deposited version published in : http://oatao.univ-toulouse.fr/ Eprints ID : 15842
To link to this article : DOI :10.3390/polym7040644 URL : http://dx.doi.org/10.3390/polym7040644
To cite this version : Pomes-Hadda, Mickaël and Aufray, Maëlenn and Diaham, Sombel Interval Analysis: A New Tool for the Characterization of an Epoxy-Amine/Aluminum System. (2015) Polymers, vol. 7 (n° 4). pp. 644-654. ISSN 2073-4360
Any correspondence concerning this service should be sent to the repository administrator: staff-oatao@listes-diff.inp-toulouse.fr
Interval Analysis: A New Tool for the Characterization of an
Epoxy-Amine/Aluminum System
Mickaël Pomes-Hadda1
, Maëlenn Aufray1,* and Sombel Diaham2 1
Centre Interuniversitaire de Recherche et d’Ingénierie des Matériaux (CIRIMAT),
Université de Toulouse, 4 Allée Emile Monso, BP 44362, 31030 Toulouse Cedex 4, France; E-Mail: mickael.pomeshadda@ensiacet.fr
2
Laboratoire Plasma et Conversion d’Énergie (LAPLACE), Université de Toulouse, 118 route de Narbonne, 31062 Toulouse Cedex 9, France;
E-Mail: sombel.diaham@laplace.univ-tlse.fr
*Author to whom correspondence should be addressed; E-Mail: maelenn.aufray@ensiacet.fr; Tel.: +33-05-3432-3442; Fax: +33-05-3432-3498.
Abstract: Epoxy-amine/aluminum chemical systems or sandwich structures with and without interphase formation are prepared using two different curing cycles and are characterized with dielectric spectroscopy. The sample without interphase formation is obtained when the reaction between epoxy and amine groups is favored, which occurs at high temperature. The interphase formation results from the reaction between the amine group and aluminum surface at room temperature. Dielectric spectra are fitted using the Set Inversion Via Interval Analysis (SIVIA) algorithm applied to DiElectric spectroscopy algorithm (SADE) developed using the method of intervals analysis. A new approach is implemented using a sum of Debye relaxations to optimize and guarantee the fitting. The results achieved show a distribution of relaxation times, which always take place at the same time as demonstrated. In this study, five Debye relaxations were found which fit the β-relaxation with our model. Finally, we showed that the more intensive of our five β-relaxations follows the Arrhenius law.
Keywords: epoxy-amine; dielectric spectroscopy; modelisation; β-relaxation; data processing interphase
1. Introduction
Epoxy-amine/aluminum bonded assemblies present an interesting alternative to other techniques used in industry, such as riveting, bolting, welding, etc.
In this work, an epoxy-amine prepolymer is applied to an aluminum substrate and cured such as to obtain, or not, an interphase, as reported in previous works [1,2]. When an epoxy-amine mixture is deposited on the surface of aluminum, a transition zone, more or less thick, with different properties from the bulk materials is formed, and called an interphase [3]. It presumably originates from dissolution of the native oxide layer of aluminum at the surface of the metal substrate which results in the formation of organometallic complexes which are going to form the interphase in uncrosslinked prepolymer causing changes in physical, chemical and mechanical properties of the polymer [4]. The control of the chemisorption of the amine on the aluminum surface allows the control of the formation of the interphase. In this study, dielectric spectroscopy is used to characterize the behavior of epoxy-amine/aluminum bonded assemblies. This characterization gives us information about relaxations of dipoles and charges carriers of the material and the molecular dynamics versus the frequency. The complex dielectric function ε∗
(ω) is measured at different constant temperatures in function of the frequency : ε∗
(ω) = ε′(ω) − iε′′(ω) (1)
where ω is the angular frequency and i = √−1. The real ε′
(ω) and the imaginary part ε′′(ω) are measured at constant temperature as a function of the frequency. The graph deducted from Equation (1) is called the dielectric spectrum. Generally mathematical modeling of experimental data is done via numerical software using the least squares approximation. However, the use of traditional software is impossible because of the number of parameters to evaluate with the model used in this study. A new algorithm using interval analysis was used to provide a confidence interval for every parameter of the dielectric function implemented in the software [5].
In this paper, dielectric spectroscopy curves are fitted using a sum of independent Debye relaxations (Equation (2)). This sum of Debye relaxations gives information about collection of dipoles and therefore about distribution of relaxations.
2. Experimental Section 2.1. Materials
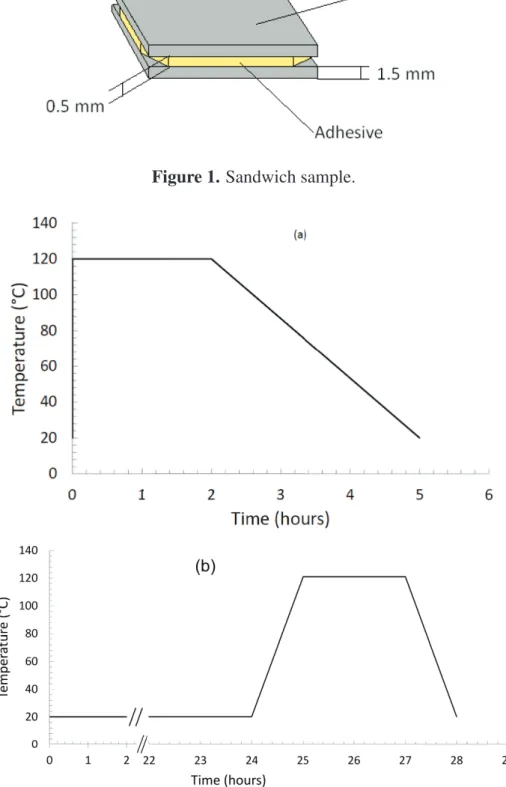
The metal substrate, provided by Goodfellow, is a commercial aluminum alloy 1050. Before the deposition of polymer, the surface of aluminum substrate was cleaned using lens cleaning paper, acetone, and then ethanol. The size of the sandwich sample was 2.5 × 2.5 cm2
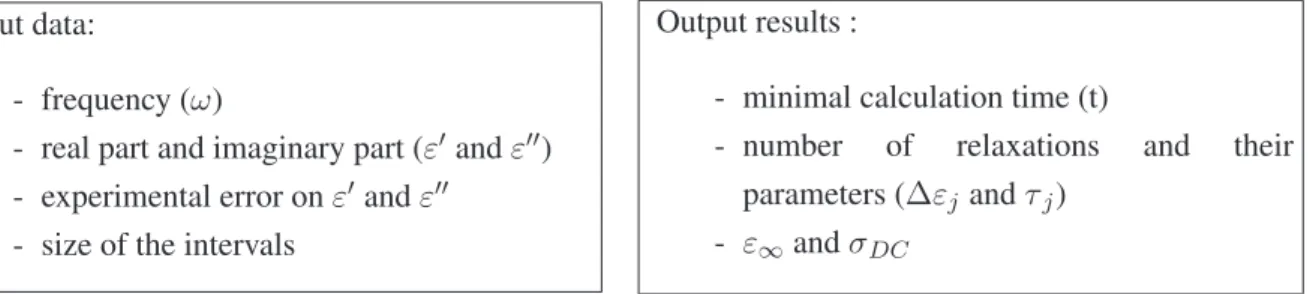
. The polymer thickness was fixed at 0.5 mm using polytetrafluoroethylene (PTFE) spacers in the sandwich structure (Figure1). To control the formation of the interphase, two kinds of curing process were used (Figure2).
A two component amine-epoxy system is studied. The epoxy resin used was Bisphenol A diglycidyl ether (DGEBA DER 332, Dow Chemical, Midland, MI, USA, Mw = 342–350 g·mol−1). The hardener
because of its widespread use in industry. The two compounds were mixed at room temperature in a stoichiometric ratio 1:1 then they undergo a curing process reported in Figure2.
Figure 1. Sandwich sample.
Figure 2. Polymerization process without interphase formation (a) and with interphase formation (b).
2.2. DSC: Differential Scanning Calorimetry
Differential scanning calorimetry (DSC) was used for the determination of the glass transition temperature (Tg) of the poly-epoxy under investigation. A DSC 204 Phoenix Series (NETZSCH, Selb,
Germany) coupled with a controller (model TASC 414/4) was used. The apparatus is calibrated against melting temperatures of In, Hg, Sn, Bi, CsCl, and Zn, applying two +10 °C/min temperature ramp, to verify the reproducibility of the Tg. The samples are placed in aluminum capsules and the mass is
measured with an accuracy of ± 0.1 mg. 2.3. Dielectric Spectroscopy
The dielectric properties were measured by broadband dielectric spectroscopy using a Novocontrol (Montabaur, Germany) Alpha-A spectrometer with a testing cell, model ZGS. Measurements have been performed under a N2 gas stream in the temperature range from −100 to 25 °C by steps
of 10 °C with an accuracy of ±0.1 °C at each setting temperature. The frequency was varied from 0.1 Hz to 1 MHz. The data have been obtained in the form of the complex dielectric permittivity , where ε′ and ε′′ are respectively the real part and the imaginary part of the
permittivity (Equation (1)). Before measurements, the sample cell was short and open-circuit corrected and the loss factor accuracy of a 100 pF low loss reference capacitor was less than 10−4
in the whole frequency range. Relaxation time, τ for the most intensive relaxation (i.e., the maximum interval of ε) allows the use of the Arrhenius law [6]:
τ(T ) = τ0exp(
Ea
kBT
) (2)
where T is the temperature, Ea is the apparent activation energy, kB is the Boltzmann’s constant, τ0 is
the pre-exponential factor and represent the relaxation time at very high temperature. 2.4. Modeling Using Interval Analysis
Dielectric spectra can be studied in many ways. The two main models are the following:
- Traditionally, Havriliak–Negami model [7] is used to fit the complex permittivity (ε∗) as a function
of frequency (ω):
ε∗
(ω) = ε∞(ω) +
εs− ε∞
[1 + (iωτ )α]β (3)
where α: peak broadening, β: peak asymmetry, εsis the static permittivity (εs= lim ω→0ε
′
(ω)), ε∞is
the optical dielectric constant and τ is the relaxation time.
Harviliak–Negami gave information about relaxation peak broadening, cooperative effects, heterogeneities, . . .
- However, another approach can be used with a sum of Debye relaxations [5,8]: ε∗ (ω) = ε∞(ω) + ∞ X j ∆εj 1 + (iωτj) − i σDC ωε0 (4) ∆εj is related to the intensity of the relaxations found by SADE (SADE is freely available on the
website of Maëlenn Aufray (http://maelenn.aufray.free.fr). SADE is protected by copyright ©2006 Brochier, and is distributed under the terms of the GNU general license.) and τj is related to the
A Direct Current conductivity (σDC) can be observed, at high temperatures and low frequency,
in the representation of a dielectric spectra. However, some relaxations can take place at low frequencies and σDC can mask them which makes difficult to fit using common algorithms like least
squares. σDC appears only on the imaginary part of the complex dielectric permittivty (Equation (1)).
Therefore, fitting the real and the imaginary part of the permittivity at the same time allows the detection of those hidden relaxations. This approach provides information on the collection of dipoles and therefore on the distribution of relaxations. However, this analytical technique has too many parameters to asses (2 × j + 2 where j is the number of relaxations), so traditional software has limitations for this method.
Interval analysis can model both the real and imaginary part at the same time, thereby without losing information. This numerical technique can also determine and ensure the number of relaxations, their position and intensity. If the sum of Debye model is not consistent (i.e., there is no solution), it will be rejected. This algorithm is named SADE [5]. SADE is a software developed by A. Brochier [5]. The calculations were made using a desktop computer HP (Palo Alto, CA, USA) Z400 2.8 GHz and 8Gb of RAM. The operating system was Linux without graphic interface. Input data given to SADE are the minimal and maximal number of desired relaxations, and the text file containing the experimental data (Table1).
Table 1. Input data and results given by Set Inversion Via Interval Analysis (SIVIA) algorithm applied to DiElectric spectroscopy algorithm (SADE).
Input data:
- frequency (ω)
- real part and imaginary part (ε′ and ε′′)
- experimental error on ε′and ε′′
- size of the intervals
Output results :
- minimal calculation time (t)
- number of relaxations and their parameters (∆εj and τj)
- ε∞and σDC
Each result obtained on output is an interval guaranteed by SADE. 3. Results and Discussion
In dielectric spectroscopy, there are many relaxations, two of them will be presented in the following : - The main relaxation (α-relaxation) related to the glass transition [9];
- The β-relaxation related to the local movements of chain segments is a secondary relaxation [10]. For temperatures T < Tamb in the case of epoxy-amine the relaxation observed is the β-relaxation
(the experiments were performed from −100 to 0 °C and from 10−1
to 106
Hz). This relaxation results from the crankshaft effect of glyceryl group and relaxation of diphenylpropane [11,12].
The dielectric permittivity spectrum as a function of the frequency of a DGEBA-DETA/aluminum sandwich sample recorded at −50 °C and polymerized without interphase is represented in Figure 3. The real (ε′
) and the imaginary (ε′′
observed for this polymerization condition at this temperature. These remarks can be made for different temperatures and for both conditions of polymerization (i.e., sandwich with and without interphase).
SADE is used for the treatment of experimental data of dielectric spectroscopy and allows us to guarantee the results (number of relaxations, . . . ) [5]. In previous works, the relaxation of Simple systems prepolymer DGEBA DER 332 (epoxy resin) were studied for different temperatures [5] and the results with and without fillers were compared [13]. The results for a DGEBA-DETA/aluminum sandwich system is represented on Figure4. Five relaxations are found SADE. Those results are obtained in form of interval (Table 2). Each relaxations plotted in Figure4are represented by taking the average of the intervals (for the interval of ∆εiand τi).
Figure 3. Imaginary and real part of the dielectric spectroscopy of DGEBA-DETA/ aluminum sandwich system (without interphase) at −50 °C.
Figure 4. Imaginary part of the dielectric spectroscopy of DGEBA-DETA/aluminum sandwich system (without interphase) at −50 °C fitted by SADE.
Table 2. Example of results obtained with SADE in 63 s for DGEBA-DETA without interphase at −50 °C. Data generated from Figure2.
Parameters Intervals ∆ε∞ [3.08, 3.22] σDC [3.75 × 10⁻¹³, 5.70 × 10⁻¹³] ∆ε1 [0.05, 0.15] τ1(s) [1.28 × 10 −7 , 4.70 × 10⁻⁷] ∆ε2 [0.06, 0.19] τ2(s) [4.53 × 10⁻⁶, 1.65 × 10⁻⁵] ∆ε3 [0.05, 0.25] τ3(s) [0.20 × 10 −4 , 0.58 × 10⁻⁴ ] ∆ε4 [0.18, 0.36] τ4(s) [0.56 × 10 −3 , 1.49 × 10⁻²] ∆ε5 [0.14, 0.23] τ5(s) [0.17, 0.28]
For a better comprehension, the initial representation (Figure4) was changed to a representation using interval vector. The interval vector is represented by τ and ∆ε which are intervals in which the solution is guaranteed.
Figures5 and 6 show the results as vector intervals for these samples without and with interphase respectively at different temperatures. The time-temperature superposition principle is highlighted (Figures5and6), with the most intense relaxation that moves to higher frequencies as the temperature increases. Comparison of different temperatures for DGEBA-DETA allows us to notice a relaxation time distribution, as reported in the literature for β-relaxation consequently of two or more relaxations of dipoles [11,12]. It can be notice that the relaxations times, τ , are fixed, which gives a collection of dipoles. The same observation can be made for the samples with and without interphase.
Figure 5. SADE result as interval vector for DGEBA-DETA/aluminum sandwich system without interphase.
Figure 6. SADE result as interval vector for DGEBA-DETA/aluminum sandwich system with interphase.
In the Figure7a, comparison of samples with and without interphase gave the same information as previously, except for the last interval vector. An overlap of areas can be observed for all interval vectors (except for the last one) at high relaxation time. The comparison of the two dielectric spectra gave information about this difference (Figure 7b). At low frequencies (i.e., high relaxation time) a more intense relaxation (with a ∆ε more intense) can be observed which can explain the difference between the two interval vectors.
Figure 7. Comparison between SADE result (a) and experimental dielectric spectrum (b) for DGEBA-DETA/aluminum sandwich system with and without interphase.
On DSC analysis, there is a difference between the glass transition of the DGEBA-DETA/aluminum sandwich system with and without interphase. For the sample without interphase, Tg is 136 ± 1 °C,
the same for the bulk, while Tg decreases to 106 ± 1 °C for the sample with interphase.
On this chemical system, the position (namely τj) of the relaxations is the same at all times, but
different intensities can be observed (namely ∆εj). This difference is related to the interphase formation
in this system. This technique gives evidence for the interphase formation and allows us to quantify this interphase formation, contrary to Figure 7b which allows us only to qualify the interphase formation with a difference between the spectra with and without interphase.
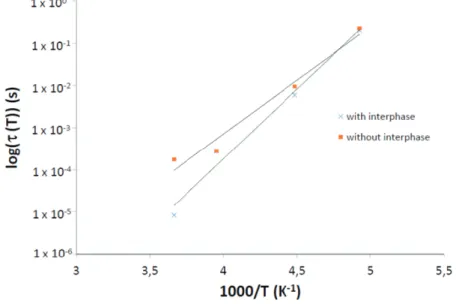
The activation energy and τ0 were determined, plotting log(τ (T )) versus 1000/T (Figure8). Finally,
it was verified that the more intense relaxation verifies the Arrhenius law (Equation (2)).
Figure 8. Arrhenius plot of more intensive relaxation log(τ (T ) versus 1000/T for the DGEBA-DETA/aluminum sandwich system with and without interphase.
The small values of τ0(Table3) have been explained by the action of the cooperative character of the
molecular motions. τ0ranges from 10
−13to 10−10s for dipole group relaxation process and from 10−25
to 10−18
s for dipole segmental relaxation process [14]. This corresponds to the crankshaft rotation of the glyceryl group obtained after the reaction between the epoxy and the amine group. The activation energy, Ea, is 7.61 kJ·mol
−1
and 5.88 kJ·mol−1
for system with and without interphase, respectively. Table 3. Arrhenius parameters (τ0and Ea) for the β-relaxation.
Sample τ0 (s) E a (kJ·mol− 1 ) without interphase 4.32 × 10⁻¹⁴ 5.88 with interphase 1.10 × 10⁻¹⁷ 7.61 4. Conclusions
In this study, the number of relaxations was determined and secured by SADE, by modeling ε′(ω)
and ε′′
(ω) simultaneously. The results show that, regardless of the temperature and the type of polymerization, the distribution of relaxation times and τi have the same interval. This last result might
allow us to fix τ for future studies, to focus on ∆ε and to gain further precision on the intensity of the relaxations found by SADE. The Arrhenius law was verified with this approach (i.e., using the more intensive relaxation to plot log(τ (T )) versus 1000/T ). The results given by Arrhenius allow us to verify the influence of the dipole group relaxation process on the β-relaxation, and the approaches (Havriliak–Negami and sum of Debye) do not contradict one another. The use of a relaxation spectrum remains to be developed with other systems.
In the future, it would be interesting to study the effects of glyceryl group (by changing the stoichiometry) and diphenylpropan group (by mixing different DGEBA) which both are responsible for the β-relaxation [11] and in fine on the relaxations found by SADE.
Acknowledgments
This work was supported by the French Natinal Research Agency (ANR 11-JS09-003-01 “MICPAC”, JCJC 2011 program).
Author Contributions
Sombel Diaham and Mickaël Pomes-Hadda conceived and designed the experiments. Sombel Diaham performed the experiments, Maëlenn Aufray and Mickaël Pomes-Hadda analysed the data, Sombel Diaham contributed to reagents/materials/analyse tools ; Mickaël Pomes-Hadda and Maëlenn Aufray wrote the paper.
Conflicts of Interest
The authors declare no conflict of interest. References
1. Possart, W.; Kruger, J.; Wehlack, C.; Muller, U.; Petersen, C.; Bactavatchalou, R.; Meiser, A. Formation and structure of epoxy network interphases at the contact to native metal surfaces. C. R. Chim. 2006, 9, 60–79.
2. Roche, A.; Bouchet, J.; Bentadjine, S. Formation of epoxy-diamine/metal interphases. Int. J. Adhes. Adhes. 2002, 22, 431–441.
3. Barthes-Labrousse, M.G. Mechanisms of formation of the interphase in epoxy-amine/aluminium joints. J. Adhes. 2012, 88, 699–719.
4. Safavi-Ardebili, V.; Sinclair, A.; Spelt, J. Experimental investigation of the interphase in an epoxy-aluminum system. J. Adhes. 1997, 62, 93–111.
5. Brochier, A.; Aufray, M.; Possart, W. Dielectric spectra analysis: Reliable parameter estimation using interval analysis. In Materials with Complex Behaviour—Modelling, Simulation, Testing, and Applications; Springer: Berlin, Germany, 2010; pp. 99–123.
6. Casalini, R. Influence of the glass transition on the secondary relaxation of an epoxy resin. Phys. Rev. B 1997, 56, 3016–3021.
7. Havriliak, S.; Negami, S. A complex plane representation of dielectric and mechanical relaxation processes in some polymers. Polymer 1967, 8, 161–210.
8. Debye, P. Polar Molecules; Lancaster Press: Lancaster, PA, USA, 1929.
9. Casalini, R.; Fioretto, D.; Livi, A.; Lucchesi, M.; Rolla, P. Influence of the glass transition on the secondary relaxation of an epoxy resin. Phys. Rev. B 1997, 56, 3016–3021.
10. Heijboer, J. Torsion pendulum in the investigation of polymers. Polym. Eng. Sci. 1979, 19, 664–675.
11. Williams, J.G. The beta relaxation in epoxy resin-based networks. J. Appl. Polym. Sci. 1979, 23, 3433–3444.
12. Couderc, H.; Frechette, M.; David, E.; Savoie, S. Study of dielectric relaxation of epoxy composites containing micro and nano particles. IEEE Trans. Dielectr. Electr. Insul. 2013, 20, 592–600. 13. Aufray, M.; Brochier, A.; Possart, W. Interval analysis applied to dielectric spectroscopy: A
guaranteed parameter estimation. In Proceedings of the 16th IFAC Symposium on System Identification, Brussels, Belgium, 11–13 July 2012; pp. 458–463.
14. Hamciuc, C.; Serbezeanu, D.; Carja, I.D.; Vlad-Bubulac, T.; Musteata, V.E.; Forrat Perez, V.; Guillem Lopez, C.; Lopez Buendia, A. Effect of DOPO units and of polydimethylsiloxane segments on the properties of epoxy resins. J. Mater. Sci. 2013, 48, 8520–8529.
© 2015 by the authors; licensee MDPI, Basel, Switzerland. This article is an open access article distributed under the terms and conditions of the Creative Commons Attribution license (http://creativecommons.org/licenses/by/4.0/).