The Development and Characterization of
Aluminum Fueled Power Systems and a
Liquid Aluminum Fuel
by
Jason Zachary Fischman
Submitted to the
Department of Mechanical Engineering
in Partial Fulfillment of the Requirements for the Degree of Master of Science in Mechanical Engineering
at the
MASSACHUSETTS INSTITUTE OF TECHNOLOGY February 2019
© 2019 Massachusetts Institute of Technology. All rights reserved.
Author: ___
Department of Mechanical Engineering February 1, 2019
Certified by:
Douglas P. Hart Professor of Mechanical Engineering
Thesis Supervisor
Accepted by:
Nicolas Hadjiconstantinou Chairman, Committee on Graduate Students
3
The Development and Characterization of Aluminum
Fueled Power Systems and a Liquid Aluminum Fuel
byJason Zachary Fischman
Submitted to the Department of Mechanical Engineering On February 1st, 2019 in Partial Fulfillment of the
Requirements for the Degree of
Master of Science in Mechanical Engineering
Various aluminum-water reactions were thermodynamically analyzed across a wide range of temperatures and pressures to determine the most favorable reaction under each condition. Results show that under most achievable temperatures and pressures the reaction will produce AlOOH, however at low temperatures and high pressures, this will transition to a reaction producing Al(OH)3. This model was then corroborated
experimentally using XRD and FTIR to identify the aluminum-water reaction products created at varying temperatures and pressures.
A new Ga In eutectic-limited surface coating method was developed to produce effective, consistent, aluminum fuel. This coating method also allowed for the study of the effects of increased eutectic concentration on aluminum reaction yield. These reaction yield results showed a minimum threshold concentration of 1.9% eutectic was needed to create reactive fuel, and that adding concentrations beyond that would increase the reaction yield with diminishing returns.
Using this aluminum technology, the world’s first aluminum fueled car was built. A 10 kW power system fueled by an aluminum-water reaction was successfully integrated into a BMW i3 to replace its range extender and to power the vehicle. With a vision towards creating simpler power systems in the future, a liquid aluminum fuel was also developed. This fuel works by suspending 65% aluminum particles by mass into a mixture of mineral oil and fumed silica. This newly developed liquid fuel can be pumped easily, stay in
suspension for months, and retains full levels of reaction completion.
Finally, a joint hydrogen-steam IC engine concept was presented and analyzed. This engine utilizes both the thermal and hydrogen energy created by an aluminum-water reaction and shows ideal system efficiencies of as high as 33% while still operating at practical system pressures.
Thesis Supervisor: Douglas P. Hart
Title: Professor of Mechanical Engineering
ABSTRACT
4 This work is the result of the past year and a half of research, and the culmination of my time at MIT, but I couldn’t have done it without the help and support of my friends, family, and mentors who I would like to acknowledge here.
To my fiancé Suri, we met on our first day at MIT, and now five and half years later I can say without a doubt that I owe so much of what I have learned and who I have become to your constant love and support. Even through stressful final projects and exams, you were always there to come up with clever ways to help and to make things more manageable. I couldn’t have done this without you, and I can’t wait to see what we create with the rest of our lives together.
Mom, Dad, Valerie, Wesley, and Madison, I love you guys to no end and every day that I got to be home and spend time with you all throughout my past years at MIT has given me the strength to come back and do everything that I have. Knowing that you were all rooting for me while I was here made all the difference and I can’t wait to come home now that I’ve finished!
Thank you to all of my friends who have been with me through my time at MIT. Whether from B2, AEPi, Hillel, or assorted classes, you were always there to give advice during hard times or to have fun when we had time off. Simply put, you made my time at MIT into the best years of my life. Thank you.
To Doug Hart, a five-minute conversation with you always gave me more insight and direction than a month of research. Thank you for being an advisor who was fun, entrepreneurial, and who above all cares for his students.
Peter, aside from your obvious contributions and insight into this research, thank you for being a great friend and lab mate. Even when everything went wrong time and time again, I knew I could still enjoy going back to lab because we were working together.
Alban, Thanasi, Mark, Brandon, Jonny, and Laureen, thank you for creating a fun and supportive lab atmosphere that made me glad I went to grad school. You were all
relentlessly inquisitive and creative, and without a doubt you helped push me forward to do work that I could be proud of.
To all years of Sindri’s past, thank you for the groundwork that allowed this project to succeed. To the Sindri fall 2017 and spring 2018 team, thank you for being great
teammates and great friends. We did something awesome and it couldn’t have happened without every one of you.
To Sarah Curtis, Alan Dang, and Benjamin Garcia, thank you for all of your work in the early exploration of a liquid aluminum fuel. It was difficult for me to work on a project so based in chemical engineering when I had so little background in it, but you guys were a huge help every step of the way.
5 Matt Carney, your mentorship taught me more machine design and proper engineering practices than years of MIT courses, thank you.
Thank you Anoop Rajappan for your constant help with the rheometer! Without you always there to answer questions I probably would have never gotten it working.
To Charlie Settens and Tim McClure, thank you for your help with training and the use of the XRD, FTIR, and microbalance. I never thought that my mechanical engineering masters would lead me to do so much chemical analysis, but your instruction and kind support throughout the process made it all possible.
Finally, thank you to the continued support of the Office of Naval Research and Mike Wardlaw for sponsoring much of this work. It was an honor working for you and I hope that this technology can go far in your hands. Keep the car for as long as you’d like.
6 Abstract ... 3 Acknowledgements ... 4 Table of Contents ... 6 List of Figures ... 9 1. Introduction ... 13
1.1 Hydrogen as a Fuel Source... 14
1.2 Aluminum as a Fuel Source ... 15
2. Thermodynamics of Aluminum-Water Reactions ... 19
2.1 Analysis ... 21
2.2 Experimental Validation ... 24
2.2.1 Experimental Setup ... 25
2.2.2 Experimental Results ... 27
2.3 Discussion and Conclusion ... 32
3. Reaction Conditions of Aluminum Fuel ... 34
3.1 Sphere Treatment ... 35
3.1.1 Sphere Composition ... 35
3.1.2 Surface Coating Method ... 36
3.1.3 Batch Eutectic Consistency ... 37
3.2 Recoding Reaction Yield ... 40
3.2.1 Errors in Experimental Setup ... 41
3.3 Reaction Yield Results ... 43
3.3.1 Eutectic Permeation Time ... 43
3.3.2 Treatment at Elevated Temperatures ... 45
3.3.3 Treatment for Extended Time ... 47
3.3.4 Varying Eutectic Concentrations ... 48
3.4 Discussion and Conclusion ... 49
3.4.1 Surface Treatment Method ... 49
3.4.2 Eutectic Permeation Time ... 50
3.4.3 Variation of Reaction Yield with Eutectic Concentration ... 50
TABLE OF CONTENTS
7
4. Design and Development of an Aluminum Fueled Vehicle ... 55
4.1 System Overview ... 56 4.2 Reactor Subsystem ... 59 4.2.1 Fuel Generation ... 59 4.2.2 Subsystem Design ... 60 4.2.3 Subsystem Results ... 61 4.2.4 Subsystem Conclusions ... 62
4.3 Thermal Management and Hydrogen Conditioning Subsystems ... 63
4.3.1 Thermal Management ... 64
4.3.2 Hydrogen Conditioning ... 65
4.3.3 Subsystem Conclusions ... 66
4.4 Final System Performance ... 67
4.5 Future Work ... 68
5. Development and Characterization of a Liquid Aluminum Fuel ... 71
5.1 Principles of Operation ... 72
5.2 Liquid Fuel Production Methods ... 74
5.3 Rheology Testing ... 76
5.3.1 Varied Mass Fractions of Fumed Silica ... 76
5.3.2 Varied Aluminum Concentration ... 78
5.3.3 Varied Temperature ... 78
5.3.4 Settling Time ... 81
5.4 Pumping Tests ... 82
5.4.1 Viscosity Selection ... 83
5.4.2 Aluminum Concentration Selection ... 85
5.5 Reaction Tests ... 87
5.5.1 Experimental Design ... 87
5.5.2 Results ... 89
5.6 Discussion and Conclusions ... 92
5.7 Liquid Aluminum Fueled System Design ... 93
5.7.1 Continuous Flow Reactor ... 93
8
5.7.3 Water Recovery ... 97
6. Design and Analysis of a Hydrogen-Steam Engine ... 98
6.1 Engine Background ... 99
6.1.1 Steam Engines ... 100
6.1.2 Internal Combustion Engines ... 101
6.2 Combined Hydrogen-Steam Engine ... 102
6.2.1 Cycle Analysis ... 105
6.2.2 Results ... 111
6.2.3 Conclusions ... 114
7. Conclusion ... 117
8. Appendices ... 120
8.1 SOP for Fuel Production Using a Surface Coating Method ... 120
8.2 SOP for Measuring Reaction Yield Based on H2 Production ... 123
8.3 SOP for Fuel Production Using a Bath Method ... 126
9 Figure 1: Plot of energy density vs specific energy for various compounds [30]. ... 17 Figure 2: Calculated Gibbs free energy of formation at varied temperatures and pressures for each of the three candidate reaction byproducts. ... 23 Figure 3: Transition diagram showing which reactions are most favorable under different reaction conditions. Conditions above the boiling point of water are greyed out, as
aluminum-steam reactions have been unachievable using this form of aluminum fuel. ... 24 Figure 4: Cross section of the reaction chamber used for tests conducted at 6.9 MPa. 1) Inlet port for a tank of nitrogen gas that was connected to the chamber for system
pressurization. 2) A mounted pressure transducer used to track the systems internal pressure. 3) A remote-controlled valve allowed the aluminum to drop into water below to begin the reaction. 4) Pressure relief valve used to prevent over pressurization. ... 25 Figure 5: XRD peak results for reaction tests done at varying temperatures and pressures. ... 28 Figure 6: FTIR results for reaction tests done at varying temperatures and pressures. ... 29 Figure 7: Image A is of an aluminum hemisphere that has been left in desiccated air for 4 hour, and B is of a hemisphere left in humid argon for 4 hours. ... 30 Figure 8: Diagram of experimental setup to test steam reactivity. ... 31 Figure 9: Aluminum hemispheres exposed to different gas. A) Before being placed in 100% humidity argon gas for 35 minutes. B) Before being exposed to steam for 35 minutes. C) After being exposed to humid argon, this hemisphere shows a visibly discolored surface. D) After being exposed to steam, this hemisphere shows no discoloration on surface. ... 32 Figure 10: Progression of Aluminum surface treatment. Left image shows jar of untreated aluminum spheres. Middle image shows same aluminum spheres after being surface coated with eutectic. Right image shows these spheres after being heated and mixed for 1.5 hours, all liquid eutectic is gone and absorbed into the surface. ... 37 Figure 11: Plot showing mass increase over time for a treated aluminum sphere left out in air. ... 38 Figure 12: Plot showing the increase in mass measured for each treated sphere. The exact increase in mass corresponds to an exact concentration of eutectic added. ... 39 Figure 13: Diagram of reaction testing setup ... 40 Figure 14: Plot of measured reaction completion of aluminum samples after increasing time since treatment. Aluminum samples were tested that were 1.0%, 1.9%, 2.4%, and 4.3% eutectic by mass. ... 44
LIST OF FIGURES
10 Figure 15: Plot of measured reaction completion for samples that were prepared with the
same concentration of eutectic but at different temperatures. ... 46
Figure 16: Plot of measured reaction completion for samples treated for 1.5 hours, and samples treated for 3 hours. ... 47
Figure 17: Plot of measured reaction completion for aluminum treated with different concentrations of eutectic. Error bars here represent 1 standard deviation. ... 49
Figure 18: Plot of average effective energy densities for aluminum treated with different concentrations of eutectic. Dotted line indicates the energy density of pure aluminum. ... 52
Figure 19: Plot of average effective specific energies for aluminum treated with different concentrations of eutectic. Dotted line indicates the specific energy of pure aluminum. ... 52
Figure 20: Plot of the effective energy density of aluminum prepared for different costs. These costs each correlate to a different concentration of eutectic. ... 53
Figure 21: Plot of the effective specific energy of aluminum prepared for different costs. These costs each correlate to a different concentration of eutectic. ... 53
Figure 22: Plot of the expected cost per kWh of energy released for fuel made with varying concentrations of eutectic. ... 54
Figure 23: System diagram of the Sindri aluminum fueled BMW. [19] ... 57
Figure 24: Diagram of the reaction chamber with mixer, digital pressure transducer, analogue pressure gauge, and multiple pressure relief valves. ... 61
Figure 25: Pressure profile over time of final reaction test while system was operating and generating 7.5 kW of power. The controller maintains stable pressure control about the set operating pressure until end of test. ... 62
Figure 26: Diagram of the Sindri thermal management subsystem. ... 65
Figure 27: Layout of the Sindri hydrogen conditioning subsystem. ... 66
Figure 28: Labeled CAD showing the final layout of components within the BMW. ... 68
Figure 29: CAD model depicting the layout of a future aluminum fueled vehicle system. A liquid fuel reaction chamber is used to produce hydrogen, and an internal combustion engine is used to generate electricity, greatly simplifying the system... 70
Figure 30: Graphic depicting the progression of oil separating off of aluminum in the presence of water. From left to right: aluminum sits in oil, water is added and oil remains on the surface of the aluminum, oil begins to bead up as water preferentially wets to the aluminum, water begins to react with the aluminum. ... 72
Figure 31: Visualization of fumed silica working to reduce particle clumping [7]. ... 75
Figure 32: Plot of mineral oil viscosity as a function of shear rate. This was measured for mineral oil mixtures with 0%, 4%, 6%, and 8% mass fractions of fumed silica ... 77
11 Figure 33: Plot of measure viscosity as a function of shear rate for two samples. The first is a mixture of mineral oil with 8% FS by mass, with no aluminum. The second is that same fluid mixture after adding sufficient aluminum particles such that the final mixture was 65% aluminum by mass. ... 78 Figure 34: Plot of liquid fuel viscosity as a function of shear rate. This was measured for a suspension of aluminum powder in mineral oil and fumed silica at varying temperatures to determine the effect of low temperature on the liquid’s viscosity ... 79 Figure 35: Plot of liquid fuel viscosity as a function of shear rate. This was measured for a suspension of aluminum powder in mineral oil and fumed silica at varying temperatures to determine the effect of high temperature on the liquid’s viscosity ... 80 Figure 36: Liquid aluminum fuel settling time tests done with different mass fractions of FS. Leftmost set of images is of a sample with 1.6% FS after initial pipetting (left) and then 8 weeks later (right). Center set of images is a sample with 2.4% FS, and rightmost set of images is of a sample with 3.2% FS. ... 82 Figure 37: Plot showing the measured density of different 100 ul pumped samples of liquid aluminum fuel. The fuel mixture used for this test contained 2.4% fumed silica and 60% aluminum by mass. The fuel exhibited consistent density measurements, characteristic of a homogenous, freely flowing fluid. ... 84 Figure 38: Plot showing the measured density of different 100 ul pumped samples of liquid aluminum fuel. The fuel mixture used for this test contained 3.2% fumed silica and 60% aluminum by mass. The fuel exhibited consistent density measurements, characteristic of a homogenous, freely flowing fluid. ... 84 Figure 39: Plot showing the measured density of different 100 ul pumped samples of liquid aluminum fuel. The fuel mixture used for this test contained 3.2% fumed silica and 60% aluminum by mass. The fuel exhibited large variation in density as a result of clogging. .... 84 Figure 40:Plot showing the measured density of different 100 ul pumped samples of liquid aluminum fuel. The fuel mixture used for this test contained 65% aluminum powder by mass. The fuel exhibited consistent density measurements, characteristic of a homogenous, freely flowing fluid... 85 Figure 41:Plot showing the measured density of different 100 ul pumped samples of liquid aluminum fuel. The fuel mixture used for this test contained 60% aluminum powder by mass. The fuel exhibited consistent density measurements, characteristic of a homogenous, freely flowing fluid... 85 Figure 42: Plot showing the measured density of different 100 ul pumped samples of liquid aluminum fuel. The fuel mixture used for this test contained 70% aluminum powder by mass. The fuel exhibited large variation in density as a result of clogging. ... 86
12 Figure 43: Plot of reaction completion for samples reacted as solid aluminum fuel, ground aluminum powder, and liquid aluminum suspensions that contained hydrophobic fumed silica and hydrophilic fumed silica. ... 90 Figure 44: Diagram of continuous flow reactor concept, where waste drains downwards due to gravity while hydrogen and steam continue to travel through the system. ... 94 Figure 45: Design of a continuous flow reactor for liquid aluminum fuel, where a hydrogen permeable tube is used to separate the hydrogen from the waste products. ... 95 Figure 46: Diagram of a steam engine [32]. ... 100 Figure 47: Diagram of a 4 stroke combustion engine following the Otto cycle. Each image presents a different stroke in the cycle, progressing from intake, to compression, to
combustion on the power stroke, to exhaust. [39] ... 102 Figure 48: Diagram depicting the proposed hydrogen-steam engine cycle. In stage 1,
oxygen is taken in to the cylinder. In stage 2a, the piston moves upwards, and the intake valve initially remains open until some middle point at which the intake valve closes, and the remainder of the air is compressed in the cylinder. In stage 2b, immediately following the slight oxygen compression, the steam and hydrogen are injected at high pressure into the cylinder. In stage 3a the hydrogen combusts with oxygen to produce steam, creating a high pressure that forces the piston down as shown in stage 3b. In stage 4a the exhaust valve opens allowing the gas to escape until the piston reaches TDC in stage 4b at which point the exhaust valve closes and the cycle starts anew. ... 103 Figure 49: Temperature Entropy diagram of a standard Rankine cycle with superheating [34]. ... 104 Figure 50: Plot of calculated ideal engine efficiency as a function of the aluminum-water reaction pressure. This plot shows results for a system analysis where air was assumed as the intake gas and an analysis where pure oxygen was assumed. ... 111 Figure 51: Plot of calculated engine exhaust gas temperature as a function of the aluminum-water reaction pressure. This plot shows results for a system analysis where air was
assumed as the intake gas and an analysis where pure oxygen was assumed. ... 112 Figure 52: Plot of calculated maximum combustion pressure experienced in the engine cylinder as a function of the aluminum-water reaction pressure. This plot shows results for a system analysis where air was assumed as the intake gas and an analysis where pure oxygen was assumed. ... 113 Figure 53: Plot of calculated maximum combustion temperature experienced in the engine cylinder as a function of the aluminum-water reaction pressure. This plot shows results for a system analysis where air was assumed as the intake gas and an analysis where pure oxygen was assumed. Slight tremors in the plot are insignificant and are simply a result of the stepped nature of the analysis done. ... 114
13 As global energy consumption continues to climb, and the environmental concerns of consuming fossil fuels becomes more apparent, the search for viable alternative fuels and energy storage methods is becoming increasingly critical. For decades, people have held hope that the transition to a hydrogen economy would be the future of a sustainable, and high efficiency electrical grid. The development of high efficiency hydrogen fuel cells has increased the prospects of such a system, however the outstanding logistical challenges of hydrogen storage and safety have kept it from becoming a reality [1].
In recent years, aluminum fuel technologies have also been developed that can be used as an alternative, highly energy dense, power source. Methods involving ball milling [2], alloying [3], or surface treating [4] aluminum with other metals have been shown to allow aluminum to react with water, releasing its internal energy as a mix of heat and hydrogen gas. Aluminum has an energy density of 83.8 MJ/l which is 2x gasoline, 8x liquid hydrogen, and 20x li-ion batteries, making it an extremely viable energy source when reacted.
Additionally, the reaction of aluminum with water produces hydrogen at a ratio of 2:3 moles of aluminum to moles of hydrogen, meaning that when reacted, it can effectively produce large quantities of hydrogen on demand. This would allow for a system where aluminum fuel can be stored and transported safely and easily, and then used to produce hydrogen when needed on site.
In this thesis, aluminum fuel is further characterized analytically and experimentally. This fuel is then used in the development of a large-scale aluminum fueled power system. Finally, looking forward towards future aluminum fueled systems, a liquid aluminum fuel was developed to allow for simpler handling and system operation, and an alternative
14 hydrogen-steam engine concept is explored to more efficiently utilize the reaction
byproducts. It is the hope of the author that the work done here poses a significant step forward in the development and implementation of aluminum fueled power systems.
1.1 Hydrogen as a Fuel Source
Hydrogen, the most abundant element in the universe, is a compelling fuel source for several reasons. The first is that it can significantly reduce production of greenhouse gases. This is because the two primary methods for generating electricity from hydrogen are to burn it, or to feed it into a hydrogen fuel cell. Burning hydrogen is simply the combination of hydrogen with oxygen which produces water as a byproduct rather than CO or CO2 as is
the case with gasoline. Hydrogen fuel cells operate via a more controlled electrochemical reaction of hydrogen with oxygen, which again produces only water as a byproduct. The wide scale implementation of hydrogen generators could see a drastic decrease in greenhouse emissions, replaced instead by harmless water vapor.
Another advantage of using hydrogen as a fuel source is that it can be produced through electrolysis, which is the process of using electricity to split water into hydrogen and oxygen. While currently the most widely used method for hydrogen production is steam reforming, which does require the use of methane and procures CO2, the potential for being
made without the use of fossil fuels is considerable. This would allow for future renewable sources of electricity, such as solar or wind energy, to produce hydrogen in a clean manner from water. Hydrogen produced in this way can then be thought of as an energy storage system, for a later point in time when the hydrogen is then recombined with oxygen to produce electricity. This would allow for a fully closed electrical storage loop, without the use of fossil fuels or the production of greenhouse gasses along the way.
Perhaps most importantly, hydrogen fuel cells are among the most efficient fuel-to-electricity generators ever made. Hydrogen fuel cells can regularly operate within the range of 40-60% efficiency and can be designed to operate at levels as high as 85%
15 efficiency [5]. This can be compared to gasoline engines, which after centuries of
optimization operate at efficiencies close to 20%. Even in an engine, the use of hydrogen can greatly increase efficiency, with recorded hydrogen engines operating at efficiencies up to 40% [6].
Unfortunately, the logistical challenges surrounding the storage and transportation of hydrogen have largely kept the dreams of a hydrogen economy from becoming a reality. While hydrogen has an incredibly high specific energy, it has a low energy density, meaning that it requires a relatively large volume of hydrogen to store a given amount of energy when compared to other fuels. For this reason, large volumes of hydrogen are often stored and transported compactly in pressurized containers or cooled to its liquid state.
Pressurizing or cooling the hydrogen gives it a higher energy density, although even in its liquid form hydrogen still has an energy density 3x lower than gasoline. Additionally, the use and transportation of pressurized hydrogen is fairly dangerous. This is not only because pressure vessels can burst if not handled properly, but also because hydrogen is incredibly flammable. For instance, many municipalities within the United States do not even allow the transport of compressed hydrogen through tunnels [7].
Aluminum fuel technologies may pose a solution to this challenge and can help further the development of a hydrogen economy. In recent years, various methods have been
developed to allow aluminum to react with water to produce hydrogen. Aluminum can be stored and transported safely and easily, and then reacted with water on site to produce hydrogen as needed. Using these aluminum fuels to produce hydrogen can help solve the energy density and safety challenges that have kept the hydrogen economy from
succeeding thus far.
1.2 Aluminum as a Fuel Source
Aluminum, the most abundant metal in the earth’s crust, has an incredibly high energy density, of 83.8 MJ/l. This energy density is over double that of gasoline and over an order
16 of magnitude higher than lithium ion batteries, as shown in Figure 1. Unfortunately,
however, the internal chemical energy of aluminum is difficult to release, as an oxide layer will naturally form on its surface when in contact with air or water [8]. This oxide layer protects the aluminum and prevents it from reacting any further. Certain methods, such as grinding aluminum into a fine powder, have been developed to allow aluminum to release its energy through combustion. Unfortunately, aluminum powder is incredibly dangerous to work with and poses both an inhalation risk and combustion hazard. Despite this,
aluminum powder combustion is still used in extreme situations where high energy density is critical, such as rocket fuel [9]. Several other methods have also been developed in recent years to allow aluminum to react with water, releasing its energy as heat and hydrogen as shown in the following chemical reaction:
2𝐴𝑙 + 4𝐻2𝑂 → 3𝐻2+ 2𝐴𝑙𝑂𝑂𝐻 (1)
When fully reacted in this manner, a single kilogram of aluminum will release 15.7 MJ of heat energy per kilogram, and 1245 L of hydrogen gas.
17
The most common methods for creating water-reactive aluminum include alloying the aluminum with large fractions of gallium (Ga), indium (In), or tin (Sn) [3], ball milling aluminum into fine powder [2], reacting the aluminum in the presence of strong acids [10], and surface treating the aluminum with Ga and In [4]. The use of strong acids, as well as the creation of aluminum powder, have largely been avoided in industry due to serious safety and logistical concerns regarding their inherently corrosive and combustible natures, respectively. Gallium and Indium are rare metals, and as such any alloys that incorporate large mass fractions of them into a fuel become very expensive and are largely cost
prohibitive. The surface treatment method however, developed by Slocum in recent years, allows for the development of effective fuel while using only minimal concentrations of Ga and In, and requiring no use of acids or powders. This method is therefore considered to be significantly safer, cheaper, and simpler than other forms of aluminum activation currently being explored. For these reasons, the surface treatment activation method is used for all
18 tests and experimentation done in this thesis. A full procedure for the production of fuel using this method can be found in Appendix 8.1.
This surface treatment method requires that aluminum be treated with a eutectic mix that is 80% Gallium and 20% indium by mass. This eutectic is only absorbed into the aluminum in mass fractions ranging from 2-6%, meaning that the fuel retains a relatively low cost and minimal change in density. Additionally, this method of fuel production requires a simple surface treatment, meaning that it can be made readily from scrap aluminum. This is of great importance for applications such as military use, or use in the wake of a natural disaster, where fuel may need to be made on demand. Other processes require either melting the fuel or grinding it into fine powders which would be extremely difficult to do on demand without the proper equipment or without an outside power source. This ease of production from scrap is also advantageous because as much as 50% of end-of-life
aluminum goes unrecycled in the U.S. [11]. While the production of aluminum does
inherently produce carbon emissions, fuel can be made from otherwise unused, discarded, aluminum, and turned into recyclable AlOOH along with useful energy upon reacting. The surface treatment of scrap aluminum for fuel production could therefore allow this technology to have a positive environmental impact as well. Furthermore, aluminum
pellets surface treated with Ga and In have been seen to maintain a stable shelf life of years, compared to gasoline or other carbon based fuels which generally maintain a shelf life of 3-12 months.
Due to these many advantages, reactive aluminum has incredible potential as a high energy density fuel source. Even looking at aluminum exclusively as a means of hydrogen storage, a single liter of aluminum would produce the equivalent amount of hydrogen gas as a 1 liter hydrogen tank pressurized to 50,000 psi. This is almost an order of magnitude higher pressure than any current hydrogen tanks are capable of achieving [12], demonstrating that aluminum is an incredibly effective means of hydrogen storage. Beyond its high energy density, the fuel is noncombustible, completely safe to transport, and produces no toxic emissions when reacted. This fuel has the potential to produce technologies such as emergency generators that run twice as long, use fuel with an indefinite shelf life, and that pose absolutely no risk of carbon monoxide poisoning.
19 Aluminum has an incredibly high chemical energy density however it quickly becomes inert in air and water due to an oxide layer that forms almost immediately on its surface and keeps any further reaction from occurring [8]. Various methods, such as those
performed by Woodall and Slocum have found that this surface barrier can be bypassed in the presence of Gallium and Indium. This allows the aluminum to react in the presence of water, releasing large amounts of thermal and chemical energy in the process. This
chemical oxidation could, in theory, take one of three naturally occurring forms, Aluminum Hydroxide (Al(OH)3), Aluminum Oxyhydroxide (AlOOH), or Aluminum Oxide (Al2O3) as
shown in Equations 2, 3, and 4.
2𝐴𝑙(𝑠) + 6𝐻2𝑂(𝑙) → 3𝐻2(𝑔) + 2𝐴𝑙(𝑂𝐻)3(𝑎𝑞) + 𝑄1 (2)
2𝐴𝑙(𝑠) + 4𝐻2𝑂(𝑙) → 3𝐻2(𝑔) + 2𝐴𝑙𝑂𝑂𝐻(𝑎𝑞) + 𝑄2 (3)
2𝐴𝑙(𝑠) + 3𝐻2𝑂(𝑙) → 3𝐻2(𝑔) + 2𝐴𝑙2𝑂3(𝑎𝑞) + 𝑄3 (4)
Where Qn indicates the heat released, which varies across the three possible reactions.
While experiments by Vedder et al. have shown the aluminum-water reaction to react via Equation 3 at atmospheric pressure and temperatures of 70 C [13], wider ranges of
2.
THERMODYNAMICS OF
20 ambient conditions have not been sufficiently explored. It was therefore unknown under which temperature and pressure conditions other reaction byproducts may become favorable.
While each of these reactions produces 3/2 moles of hydrogen per mole of aluminum reacted, the reactions vary in the amount of water stoichiometrically required, and the heat that each will produce as a byproduct. Understanding which of these reactions is occurring at a given operating temperature and pressure will allow the user to design the system for maximum efficiency and proper water consumption. In particular, the formation of
aluminum oxide would be desirable in order to consume as little water as possible, thereby allowing for a higher system energy density.
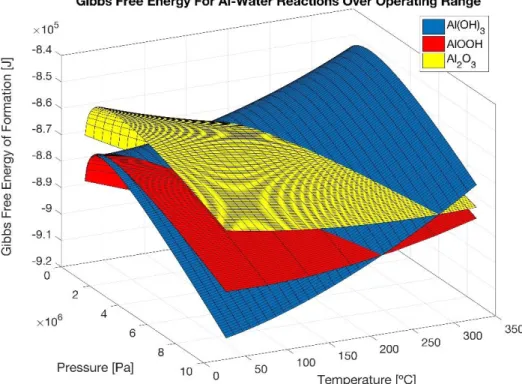
Determining the most favorable reaction under a given set of pressure and temperature conditions was done using the thermodynamic quantity of Gibbs free energy. Reactions will always proceed to minimize the Gibbs free energy of the compounds. Therefore, any
reaction in which the products have a lower Gibbs free energy than the reactants is said to have a negative change in Gibbs free energy across the reaction and will occur
spontaneously. A reaction with a positive change in Gibbs free energy will not occur without outside stimulation. Furthermore, when multiple reactions are possible, the reaction that produces the most negative change in Gibbs free energy will be the most favorable to occur.
The Gibbs free energy was determined for each compound in reactions 2, 3, and 4 by looking at published data and applying temperature and pressure corrections to correspond to a wide range of working conditions. This was then used to find the total change in Gibbs free energy (ΔG) that occurs across each reaction, with lower values indicating a more favorable reaction. By performing this analysis across a wide range of temperatures and pressures, the most favorable reaction can be predicted across different operating regimes.
21
2.1 Analysis
The Gibbs free energy was analyzed to determine the favorability of each of the three possible reactions within a temperature range of 300-600 K, and a pressure range of 101-10,000 kPa. For any given reaction, the Gibbs free energy for each compound was
calculated, and then the difference in Gibbs free energy between the reactants and products was determined. The reaction with the most negative change in Gibbs free energy is the most favorable to occur.
The first step in this analysis is to calculate the Gibbs free energy of formation for each individual compound in the reaction. While the Gibbs free energy of formation for many compounds are published and available online, these values must be corrected for
variations due to changes temperature and pressure. Fortunately, the NASA ThermoBuild platform, which operates off of the NASA Glenn thermodynamic database, allows users to view the Gibbs free energy of a wide range of compounds at elevated temperatures. Using the data taken form this website, the only further correction that was needed was one for pressure. This can be done using Equation 5 for solids and liquids, and Equation 6 for gases.
∆𝑓𝑔𝑖(𝑇, 𝑃) = ∆𝑓𝑔𝑖0(𝑇) + 𝑣𝑖(𝑝 − 𝑝0) (5)
∆𝑓𝑔𝑖(𝑇, 𝑃) = ∆𝑓𝑔𝑖0(𝑇) + 𝑅 ∗ 𝑇 ∗ ln (
𝑝 𝑝0
) (6)
Where 𝑣𝑖 is the specific volume of compound i, R is the ideal gas constant, and P is the partial pressure of the gas in Equation 6, or simply the ambient pressure if using Equation 5. ∆𝑓𝑔𝑖0(𝑇) is the Gibbs free energy of formation of compound i at temperature T and 1 bar,
which provided by the NASA database.
Once these equations are used to determine the molar Gibbs free energy for each
compound at the desired temperature and pressure, these values can then be summed to determine the net change in Gibbs free energy across a complete reaction. To do this, the
22 stoichiometric ratios in Equations 2, 3, and 4 are applied to the appropriate values for molar change in Gibbs free energy, and the difference between the reactants and products is found, as shown in Equation 7.
∆𝑓𝐺(𝑡, 𝑝)(2) = (2 ∗ 𝑔𝐴𝑙(𝑂𝐻)3(t, p) + 3 ∗ 𝑔𝐻2(t, p) ) − (2 ∗ 𝑔𝐴𝑙(t, p) + 6 ∗ 𝑔𝐻2𝑂(t, p) ) (7)
This gives the final change in Gibbs free energy, ∆𝑓𝐺(𝑡, 𝑝)(2), for reaction 2, at a given temperature and pressure. This model makes several assumptions, the first of which is that no steam or other gasses are present during the reaction. This may not always be the case, particularly due to the exothermic nature of the reaction, but was assumed for the
simplicity and generality of the model. If such gases were present, then the partial pressure of hydrogen used in Equation 6 would vary, causing a change in the final Gibbs free energy values. This variation would likely be minor however, because the Gibbs free energy varies only logarithmically with the partial pressure term. Additionally, this model assumes that the method by which the aluminum is activated does not impact the chemistry of the reaction. For experiments done here, this activation was achieved through the introduction of gallium and indium to the aluminum. It is believed that these compounds act only as a catalyst and have no true effect on the chemistry of the reaction, particularly because they are only present in concentrations of 1% by molar quantity.
This process was used to determine the change in Gibbs free energy for each of the three reactions discussed here. For each reaction, these values were evaluated in MATLAB over grid of 3100 points in a range of 300-600K and 101-10,000 kPa, and the results are shown in Figure 2. At any given temperature and pressure, the chemical reaction with the lowest change in Gibbs free energy is the most favorable, and the one that will be produced via the
23 aluminum-water reaction. This data can then be used to produce Figure 3, which shows the pressure and temperature regimes within which each reaction becomes most favorable.
This model predicts that at low temperatures, aluminum hydroxide is most favorable, while at slightly elevated temperatures, aluminum oxyhydroxide is the most favorable reaction product. Unfortunately, the region in which aluminum oxide would be produced requires temperatures above the boiling point of water and, therefore, could not be achieved by a liquid water-aluminum reaction.
Figure 2: Calculated Gibbs free energy of formation at varied temperatures and pressures for each of the three candidate reaction byproducts.
24
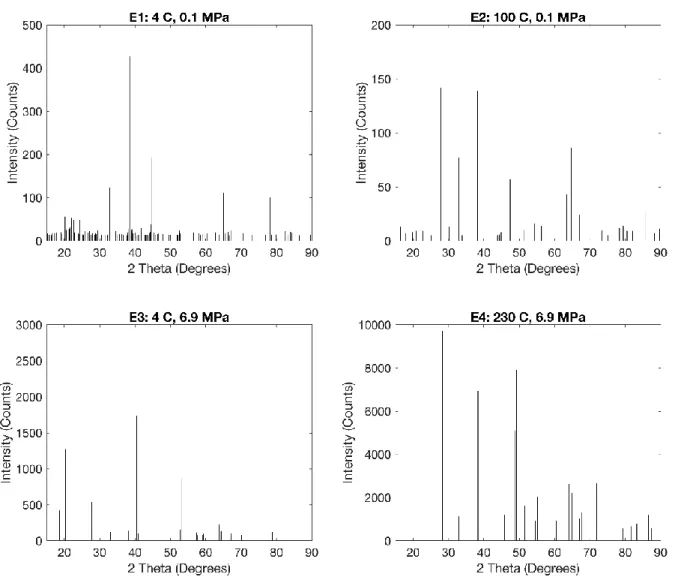
2.2 Experimental Validation
A series of four tests, at high and low temperatures as well as high and low pressure, were designed in order to validate the predictions made by this model. The values chosen, indicated in Section 2.2.1, allowed for two tests that were well within the expected aluminum oxyhydroxide regime, as well as two tests that were well within the expected aluminum hydroxide regime. Aluminum that had been activated using gallium and indium was reacted with water under each of these temperature and pressure conditions, and the reaction byproduct was recovered. The byproduct was then analyzed using x-ray
Figure 3: Transition diagram showing which reactions are most favorable under different reaction conditions. Conditions above the boiling point of water are greyed out, as aluminum-steam reactions have been
25 diffraction (XRD), as well as Fourier-transform infrared spectroscopy (FTIR), to determine its precise chemical makeup.
2.2.1 Experimental Setup
High Pressure Testing
Both high pressure reaction tests were done at 6.9 MPa, in the reaction chamber shown in Figure 4. This reaction chamber was made out of stainless steel tubing to avoid gallium or hydrogen embrittlement, and used Swagelok fittings in order to reduce leaking. The reaction chamber was pre-pressurized with compressed nitrogen and had a digital
Figure 4: Cross section of the reaction chamber used for tests conducted at 6.9 MPa. 1) Inlet port for a tank of nitrogen gas that was connected to the chamber for system pressurization. 2) A mounted pressure transducer used to track the systems internal pressure. 3) A remote-controlled valve allowed the aluminum to drop into
26 pressure transducer to record the pressure, as well as an emergency relief valve in the case of accidental over-pressurization. Each reaction began with water already resting in the base of the reaction chamber, and aluminum placed in the topmost tube. This aluminum could then be dropped into the water using a remote-controlled ball valve.
High Pressure High Temperature Test:
During the high pressure, high temperature, test a resistive heater and a thermocouple were placed around the base of the reaction chamber. Both were then wrapped in insulation and the pressurized reaction chamber was allowed to heat up. Only once the reaction chamber had reached a steady state temperature of 230 C while still maintaining a pressure of 6.9 MPa, were the aluminum spheres released into the water. The reaction was then allowed to proceed for 30 minutes before the system was depressurized and the reaction chamber was slowly cooled. The contents of the reaction chamber were then recovered and allowed to dry in a fume hood at room temperature for 1 week.
High Pressure Low Temperature Test:
The high pressure, low temperature test was done by placing the pressurized reaction chamber within an ice bath and placing both the ice-bath as well as the reaction chamber within a 4 C refrigerator. The reaction chamber, water, and aluminum were all allowed to sit within the refrigerator for 30 minutes in order to pre-cool before the aluminum was released into the water. After being released, the aluminum was allowed to react in the high pressure, low temperature, environment for 72 hours. This long reaction time was chosen because it had been observed that the low temperature reaction tests proceeded at a much slower rate than those at an elevated temperature. After the reaction was complete, the system was depressurized, and the reaction products were recovered and allowed to dry in the fume hood at room temperature for 1 week.
27 Low Pressure, High Temperature Test:
The low pressure, high temperature, test was performed at 1 bar and 100 C. This was done by simply placing a preheated aluminum sphere into a beaker of boiling water. The
aluminum was then allowed to react for 30 minutes after which the water eventually boiled off.
Low Pressure, Low Temperature Test:
The Low pressure, low temperature, test was performed at 1 bar and 4 C. This reaction was done by taking small fragments of aluminum and scattering them into an ice bath that was mixed to maintain a temperature of below 4 C at all times. Small fragments were used in order to reduce the magnitude of local heat generation, so that no pockets of water could be heated above 4 C. This reaction was allowed to proceed with a constant temperature below 4 C for 3 hours. The contents of the ice bath were then strained using a 200 µm sieve to remove any large remaining aluminum particles. The water and particles that passed through the sieve were then allowed to dry in the fume hood at room temperature for 1 week.
2.2.2 Experimental Results
Initial samples were tested using XRD with the assistance of the MIT Materials Science department. These results however, were largely inconclusive, and so samples were sent to Lehigh Testing Laboratories for XRD analysis. The results revealed that both high
temperature tests produced aluminum oxyhydroxide, and that the high pressure, low temperature, test produced aluminum hydroxide, all as expected. Interestingly, the low temperature, low pressure, XRD results indicated that the sample analyzed was primarily elemental aluminum. This likely indicates that the reaction was not allowed to proceed for long enough and that not enough byproduct had been produced to be recognized by the XRD testing. These results can be seen in Figure 5 below.
28
FTIR was also done with the help of the MIT Material Science department, and the results can be seen in Figure 6. Both high temperature results match the formation of aluminum oxyhydroxide, and both low temperatures results match aluminum hydroxide. The peaks on the lower pressure results however, are less distinct. This lack of clarity on lower pressure results is likely due to the fact that any residual water in the samples can obscure the results of an FTIR. While attempts were made to dry the sample, it has been shown that when reacting aluminum with water under atmospheric pressure, water can get trapped within the resulting oxyhydroxide crystalline lattice [13]. This water can be difficult to remove, and our attempts at drying the samples were therefore unable to increase FTIR
29 clarity. Notably however, when looking closely at samples E1 and E2, they can be seen to match their high-pressure counterparts. In E1, shoulders visible at 3656, 3548, 3465, 3435, and 3423 cm match well defined peaks in E3, and are indicative of aluminum hydroxide. In E2, peaks seen at 3307, 3095, 1074, 742, 613, and 493 cm are similarly seen to match those found in E4, and are indicative of aluminum oxyhydroxide. It is therefore believed that the 4 C, 1 bar, test also produced aluminum hydroxide, but simply not in a large enough quantity to be detected by XRD.
30 Water Vapor Tests:
A series of tests were conducted to determine whether this reaction can be performed with steam, or whether it requires the presence of liquid water. These tests indicate whether the aluminum oxide region of Figure 3 could ever be reached. An additional motivation for this testing was that fuel was seen to slowly react and turn dark grey after exposure to air for several minutes. This was theorized to be due to a surface reaction, however it was
unknown whether this reaction was an oxidation due to the oxygen in the air, or a reaction with water vapor.
An initial test was done in which two identically treated hemispheres of aluminum were placed into two separate jars. The first jar was filled with argon, but also contained a small bowl full of water. This water was never put in contact with the aluminum but was allowed to evaporate over time, thereby creating a gaseous atmosphere of argon at 100% relative humidity. The second jar was left open to atmosphere but filled with silica desiccant beads, thereby creating an oxygen rich environment with close to 0% relative humidity. The results can be seen in Figure 7 below, and after 4 hours only the aluminum that had been exposed to humid air showed any measure of surface reaction. This indicates that the observed surface reaction was occurring due to a reaction with water vapor in the air, rather than an oxidation due to oxygen in the air.
A
B
Figure 7: Image A is of an aluminum hemisphere that has been left in desiccated air for 4 hour, and B is of a hemisphere left in humid argon for 4 hours.
31 Once it was known that a reaction was possible using water vapor, an additional test was done to see if this reaction could be done with high temperature steam. A setup was used as shown in Figure 8, where boiling water was passed over an aluminum hemisphere. This aluminum sphere was heated to approximately 130 C, in order to ensure that no
condensation was occurring on the surface of the aluminum.
As a control, when this steam test was started, an identical hemisphere of aluminum was placed into a jar of humid argon, using the same method as described above. The
hemispheres were observed at the start of the test as well as 35 minutes later, and the results are shown in Figure 9. While the aluminum subject to room temperature humidity was clearly seen to react within the 35 minute time period, no such reaction was observed for the aluminum that had been exposed to superheated steam.
32 This indicates that the treated aluminum used here is capable of reacting quickly with gaseous water vapor at room temperature but not at elevated temperatures. This is likely due to the adsorption of water onto the surface of aluminum at room temperature but not at elevated temperatures. Similar to condensation, the adsorption effect allows liquid water to form on the surface of the aluminum as a minimization of the metal’s surface energy [14]. This effect would therefore cause the presence of liquid water on the surface of the aluminum, allowing a reaction to occur. At elevated temperatures, the adsorption effect decreases significantly, and would therefore not be observed. This lack of adsorbed liquid water would, in turn, prohibit any reaction from taking place, explaining why a surface reaction was seen only at room temperature but not at 130 C.
2.3 Discussion and Conclusion
An analysis has been done to determine the most favorable aluminum-water reaction to occur under a wide range of temperatures and pressures. This analysis indicates that aluminum oxyhydroxide is favorable under most practical conditions, however the production of aluminum hydroxide can be achieved if the reaction is done under
B
D
A
C
Figure 9: Aluminum hemispheres exposed to different gas. A) Before being placed in 100% humidity argon gas for 35 minutes. B) Before being exposed to steam for 35 minutes. C) After being exposed to humid argon, this
hemisphere shows a visibly discolored surface. D) After being exposed to steam, this hemisphere shows no discoloration on surface.
33 sufficiently low temperature or high pressure. Additionally, it is unlikely that aluminum oxide can be produced through this method, as the temperatures needed for its production are above that which can be reached by liquid water, and evidence suggests that the
reaction of aluminum treated in this manner cannot occur with steam.
This analysis was then supported experimentally by tests at high and low temperatures and pressures. Analysis using both XRD and FTIR confirmed that both high temperature tests results produced aluminum oxyhydroxide and low temperature tests produced aluminum hydroxide, as predicted. While the XRD results for the low temperature, low pressure result was inconclusive due to the lack of sufficient reaction byproducts, FTIR data indicates that the minimal reaction that did occur did, in fact, produce aluminum hydroxide.
This model allows for the more accurate development of future aluminum fueled systems. The production of aluminum oxyhydroxide as compared to aluminum hydroxide will change the expected heat released in the reaction and reduce the amount of water needed by as much as 33%. Additionally, both aluminum hydroxide and oxyhydroxide have many industrial uses, and have different market values across the globe. By using this model, systems can now be designed for the optimal operating conditions, and for the ideal operating byproduct.
34 Aluminum has long been sought after as a fuel source, due to its high energy density. Until recently, the two most common methods for producing reactive aluminum fuel required either alloying aluminum with high percentages of Gallium or grinding the aluminum into a powder. Unfortunately, alloying with high concentrations of gallium made the aluminum cost prohibitive, as Gallium is a rare, and fairly expensive, metal. While aluminum powders have been shown to be reactive with only small percentages of gallium or similar additives, they pose serious risks for explosivity, as well as inhalation health hazards. These cost and safety concerns have been major factors in keeping aluminum fuel from coming to market. Recently, a new method for creating reactive aluminum fuel, developed by Slocum,
proposes a fuel that requires only small concentrations (2-6%) of gallium and Indium additives, yet boasts high (>80%) reactivity [4]. This method offers an energy dense fuel while having low costs and virtually no safety risks.
The Slocum method of placing raw aluminum in a heated gallium and indium eutectic bath is novel in many ways. In addition to being low cost and having significantly fewer safety concerns than reactive powders, it also has the ability to turn large pieces of raw aluminum into a reactive fuel without having to significantly change its state by either melting or grinding it. Unfortunately, however, this method is still in its infancy and current research has left many questions unanswered. For instance, it is known that two stages are
necessary for fuel production, an initial heated phase where the eutectic is absorbed into the aluminum’s surface, and a later eutectic permeation phase where the eutectic
3.
REACTION CONDITIONS OF
35 permeates through the bulk of the aluminum. Previous research had not explored the time necessary for each of these stages and their effect on the fuel’s reaction yield. Additionally, no studies had been done on how the concentration of eutectic within the aluminum effects the overall reactivity. Answering these questions is critical to producing fuel as quickly as possible and for as low a cost as possible, while maintaining high reaction yields.
Additionally, the answers to these questions will hopefully shed light on the underlying mechanism of action of the reaction, as it is currently unknown how the introduction of gallium and indium allows for an aluminum-water reaction to proceed unimpeded by the naturally occurring oxide layer.
A series of tests to measure the reaction yield of aluminum that had been produced under different conditions were done. These tests included the measurement of reaction yield for aluminum that had been allowed varying permeation times post treatment, aluminum that had been treated at different temperatures, and aluminum that had been treated with varying concentrations of eutectic. By measuring the effects of each of these parameters on the final reaction yield of the aluminum, the fuel production method can be optimized for speed and high reaction yield.
3.1 Sphere Treatment
3.1.1 Sphere Composition
The aluminum spheres used in the following experiments were produced in the same way as those used by Slocum for the initial experimentation and development of this treatment method. These spheres were 6 mm in diameter and 99.90% aluminum in composition. They were manufactured by being extruded, forged, and polished, leaving them with a fine internal grain structure as well as residual internal stresses. This grain structure was measured to be 1-10 µm, which is significantly smaller than those seen in aluminum
36 produced via pure casting or forging, which typically produce grain sizes on the order of 10 -100 µm [15].
3.1.2 Surface Coating Method
In order to further characterize this fuel, a slight variation on Slocum’s process was developed, in order to make fuel in a more reliable and controlled manner. Rather than placing aluminum in a heated bath of eutectic as described in Appendix 8.3, the aluminum was surface coated with eutectic as described in Appendix 8.1. In this method, a container of aluminum spheres was placed on a hotplate and heated to 120 C. After reaching the desired temperature, a small amount of eutectic was added to the container and it was mixed thoroughly until the aluminum spheres were seen to have an even surface coating of eutectic. The aluminum spheres were then allowed to sit on the hot plate for an hour and a half while being remixed every 20 minutes in order to promote consistent surface coatings and heat distribution within the container. This method produced fuel that showed
remarkable consistency and displayed no pitting in the surface due to degradation from gallium, as can be seen in Figure 10. Additionally, this treatment method is eutectic-limited, which allows for the controlled addition of exact mass fractions of eutectic into different batches of fuel. Finally, it is notable that this method ensures that fuel can be made with significantly less Gallium and Indium overhead than the bath method. When treating a kilogram of aluminum using the bath method, several kilograms of Gallium and indium will be needed in order to properly cover the aluminum, however using this surface treatment method only ~50 grams of eutectic would be needed. While the same amount of eutectic would be absorbed into the aluminum in either case, having a eutectic bath requires large overhead and may become cost prohibitive for large-scale bath fuel production.
37
3.1.3 Batch Eutectic Consistency
A reference test was done in order to accurately measure the consistency of the new fuel surface treatment process described in Section 3.1.2. In this test, a batch of 24 spheres was treated with a single desired concentration of eutectic, and then the eutectic variation within each sphere from that batch was measured. This measured variation was then used as a standard reference variation, to be expected within each batch of fuel produced using this surface treatment method.
A microbalance with an accuracy of ±1 µg was used to select a set of 24 spheres that all weighed 0.301950 grams ±50 µg. These spheres were then surface treated with eutectic as a single batch. The final masses of each sphere were measured in order to determine the variation in final mass from sphere to sphere, and thus the total variation in mass fraction of eutectic present between spheres from a single batch.
One complication that arose during this test was that when a treated sphere was placed on the microbalance, the mass reading of the sphere would not stabilize, but rather, would steadily increase over time. As the sphere’s mass increased over the course of several minutes, its color was also seen to darken. This increase in mass, and darkening of color, when exposed to air is a result of the reaction of the aluminum with water vapor in the air. This is believed to be due to adsorption effect, discussed previously in Section 2.2.2. As this
Figure 10: Progression of Aluminum surface treatment. Left image shows jar of untreated aluminum spheres. Middle image shows same aluminum spheres after being surface coated with eutectic. Right image shows these
38 surface reaction occurs, some aluminum combines with water molecules in the air and is converted into aluminum oxyhydroxide which has a greater mass than the initial
aluminum, causing the measured sphere mass to increase.
Looking closely, it was also seen that the rate of mass-increase for the aluminum sphere decreased over time. This is to be expected because as a surface reaction occurs, much of the surface becomes covered in the produced oxyhydroxide. This leaves less free surface area for continued reactions and therefore would cause the reaction rate to decrease over time. This decrease in reaction rate was measured on the microbalance and can be seen in Figure 11.
Due to this increase in mass over time, it was important to weigh each aluminum sphere as quickly as possible when determining the results of the consistency testing. Each sphere was removed from a jar and weighed after being exposed to open air for approximately 15 seconds, and any slight variation in this time was seen to be insignificant. The recorded increase in mass for each sphere can be seen in Figure 12.
0 0.2 0.4 0.6 0.8 1 1.2 1.4 1.6 1.8 0 200 400 600 800 Ra te of M ass In cr ea se (ug /s) Elapsed Time (s)
39 One error inherent within this experiment is that as the jar of aluminum spheres is opened and closed each time to remove a new sphere for measurement, the remaining spheres are being exposed to slight amounts of new, humid, air. This would result in later
measurements being of samples that have been exposed to slightly more moisture and will therefore be slightly heavier, leading to a bias in the data. This trend can in fact be seen in the data recorded in Figure 12. In order to best account for this error, the line of best fit for the data was calculated, and the slope was subtracted away from each data point in order to produce a data set that shows no false positive trend. This slight data correction
accounts for the sphere’s increased moisture exposure over time.
The results of this consistency testing show that a batch treated with this new surface treatment method had a eutectic concentration of 2.90% with a standard deviation of only 0.14%. y = 0.0425x + 9.0022 0 2 4 6 8 10 12 0 5 10 15 20 25 In cr ea se in Sp h er e's M ass (mg) Measurement Number
Figure 12: Plot showing the increase in mass measured for each treated sphere. The exact increase in mass corresponds to an exact concentration of eutectic added.
40
3.2 Recoding Reaction Yield
In order to characterize the fuel, a method for measuring the reaction yield of a given piece of aluminum was needed. This was done by measuring the volume of gas produced when the aluminum was reacted with water. Given a known mass of reacted aluminum, and the fact that the aluminum-water reaction always produces 3 moles of H2 gas for every 2 moles
of reacted aluminum, the expected moles of hydrogen produced from a complete reaction can be calculated. This, in turn, can be mapped to an expected volume of hydrogen using the ideal gas law. Once this is done, this ideal volume of hydrogen can be compared to the actual recorded volume of hydrogen in order to determine a final percentage of reaction completion.
The experimental setup for measuring the volume of hydrogen produced in a given reaction can be seen in Figure 13.
An aluminum sphere was placed in a small 50ml Büchner flask, which was then corked, with its outlet leading into an inverted cylinder. This inverted cylinder was filled with water and placed in a large beaker. Through a hole in the cork in the Büchner flask, 5ml of purified water was inserted, commencing the aluminum-water reaction. The gas produced from the reaction was then allowed to bubble up into the overturned cylinder and displace
Syringe Flow adjustment valve Buchner Flask 3/8” tube 500 ml cylinder 2000 ml beaker Aluminum Sphere Figure 13: Diagram of reaction testing setup
41 the water inside. The total volume of water displaced in the cylinder was then recorded as it represents the volume of gas produced in the reaction. Measurements of the volume of gas produced were taken every 15 seconds until the reaction rate dropped below ~0.5 ml/min at which point the reaction was considered to have run to completion. Following this, additional 5ml of water was inserted into the beaker and was allowed to sit for several minutes in order to ensure that the reaction was not water limited and that any aluminum that had become scattered throughout the flask had come into contact with water1. In most
tests, no significant hydrogen generation was seen after 15-20 minutes. For further details of the measurement method, see Appendix 8.2.
3.2.1 Errors in Experimental Setup
Due to the complexity of the experimental setup, and the challenges of working with
hydrogen, several errors were considered. These experimental errors include the effects of pressure and temperature changing the observed gas volume, any other gases that may contaminate the gas, and any hydrogen leaking that may have occurred. Each of these errors were analyzed and accounted for when determining the gas produced in the reaction.
Presence of Water Vapor:
Because the reaction occurs in the presence of water, and often forms steam in the process, it can be assumed that the hydrogen produced will be mixed with water vapor and will be at 100% relative humidity. Additionally, the hydrogen gas then bubbles through a water column and comes to rest next to exposed water, further ensuring that the gas will exist at 100% relative humidity. At 20 C, this means that water vapor will account for a full 2.3% of
1 Temperature has been shown to impact the reaction rate and possibly even reaction completion, therefore
the full 10 ml was not inserted at the beginning, so that reaction could more easily heat up to boiling with only 5ml of water, before it was flooded with additional water
42 the gas by volume. This water vapor volume is accounted for and subtracted away from any measured results when determining the actual volumes of hydrogen produced1.
Increased Temperature Causing Gas Expansion:
The aluminum-water reaction is highly exothermic and the Büchner flask quickly becomes heated when the reaction begins. This leads to an expansion of the gas inside of the flask as per the ideal gas law. It is important that this expansion not bias the final volume
measurements recorded, leading to a perceived increase in quantity of gas. Due to the low specific heat capacity of hydrogen, the gas cools very quickly once it leaves the flask, but the flask itself retains heat for several minutes after the reaction ends and will maintain its internal gas at an elevated temperature. For this reason, in all experiments done, once the reaction was considered to have gone to completion the flask was placed in a bath of cool water and allowed to cool to room temperature. The final volumes of hydrogen were only measured once this cooling stage was completed and any observed volume reduction was accounted for.
Pressure Compressing or Expanding Gas:
The pressure of the gas in the 500 ml cylinder will vary based on the water level in the cylinder, as per Bernoulli’s equation. This change in pressure will then affect the recorded volume of the gas, as per the ideal gas law. This means that when the water level in the 500 ml cylinder is very high in the cylinder, the gas will be under a slight negative pressure, and will be seen to occupy a larger volume than that gas would normally occupy at 1 standard atmosphere of pressure. The opposite is true if the water level of the 500 ml cylinder was far below the water level of the 2000 ml beaker. All tests were therefore setup such that when an aluminum sphere had approximately 80% reaction yield, the resulting water level in the 500 ml cylinder would exactly match with the water level in the 2000 ml beaker,
1 The dissolution of hydrogen into water was also measured but was found to be insignificant, especially
43 resulting in a gas pressure of 1 atm. This allows the volumetric measurements to assume a pressure of 1atm for most calculations and reduces any volume error due to change in pressure. Additionally, calculations show that the pressure differences created by variations in the water level that correspond to ±15% reaction yield1, would add
insignificant error to the system.
Hydrogen Leaking:
Due to H2’s incredibly small molecule size, it is known to leak very easily, and be permeable
through most surfaces given sufficient time. Any hydrogen that were to leak out of the system would unaccounted for in the measurement, causing errors in the observed
reaction yield. This was mitigated by using 1/8” thick flexible PVC tubing which has a very low hydrogen permeability, particularly in the case where there is no pressure differential across the tube. Additionally, all barbed seals and corks were wet before being sealed to allow for the water to act as a barrier to leaking. Using these methods, the setup was observed to have no detectable hydrogen losses even when left full of hydrogen for 24 hours.
3.3 Reaction Yield Results
3.3.1 Eutectic Permeation Time
A series of tests were done to determine the effect of permeation time on coated aluminum fuel. Four different batches of 60 aluminum spheres were surface treated as per Appendix 8.1, each with a different mass fraction of eutectic added. After the surface treatment, ten spheres were reacted immediately, followed by an additional 10 spheres 1, 2, 3, and 7 days
1 This variation in reaction yield would lead to water level variations of approximately 2”. This change in
44 later. This set of experiments was done using batches that had been treated with 1.0%, 1.9%, 2.4%, and 4.3% eutectic by mass. The reaction yield was recorded, and the results can be seen in Figure 14.
It can be seen that for the 2.4% and 4.3% samples, the reaction yield climbs within the first 48 hours and the variation within the sample decreases significantly. After 48 hours, the reaction yields of these samples remain constant and do not vary. Additionally, the reaction yields of all samples remain distinctly different even after sufficient time for complete eutectic permeation. This demonstrates an inherent connection between the concentration of eutectic and the reaction yield of the aluminum which had not previously been studied. When looking at the 1.0% sample it can be seen that initially there is a slight reaction, however as time commences and the eutectic permeates more completely into the sphere, the reaction yield declines to nearly zero. This indicates the existence of some threshold eutectic concentration that is necessary in order to commence a reaction. Immediately after the initial surface treatment, the entire 1.0% by mass of eutectic was concentrated on
0 10 20 30 40 50 60 70 80 90 100 0 1 2 3 4 5 6 7 P er cen t R ea ct ion C om p le tion (% )
Days Since Treatment
1.0% Eutectic 1.9% Eutectic 2.4% Eutectic 4.3% Eutectic
Figure 14: Plot of measured reaction completion of aluminum samples after increasing time since treatment. Aluminum samples were tested that were 1.0%, 1.9%, 2.4%, and 4.3% eutectic by mass.
![Figure 1: Plot of energy density vs specific energy for various compounds [30].](https://thumb-eu.123doks.com/thumbv2/123doknet/14731829.573136/17.918.106.801.123.566/figure-plot-energy-density-specific-energy-various-compounds.webp)