MECHANISM AND IONETICS OF
GOLD ELECTRODEPOSITION FROM ACIDIC SOLUTIONS
by
Yigen Li
Thesis presented to Departement de chimie
for the doctoral degree in sciences (Ph. D.)
FACULTEDES SCIENCES
UNIVERSITE DE SHERBROOKE
Sherbrooke, Quebec, Canada, May 1996
^
1+1
National Library of Canada Acquisitions andBibliographic Services Branch 395 Wellington Street
Ottawa, Ontario K1AON4
Bibliotheque nationale du Canada
Direction des acquisitions et des services bibliographiques 395, rue Wellington
Ottawa (Ontario) K1AON4
Your file Votre r6t6rence
Our file Notre r6f6rence
The author has granted an
irrevocable non-exclusive licence
allowing the National Library of
Canada to reproduce, loan,
distribute or sell copies of
his/her thesis by any means and
in any form or format, making
this thesis available to interested
persons.
Uauteur a accorde une licence
irrevocable et non exclusive
permettant a la Bibliotheque
nationale du Canada de
reproduire, preter, distribuer ou
vendre des copies de sa these
de quelque maniere et sous
quelque forme que ce soit pour
mettre des exemplaires de cette
these a la disposition des
personnes interessees.
The author retains ownership of
the copyright in his/her thesis.
Neither the thesis nor substantial
extracts from it may be printed or
otherwise reproduced without
his/her permission.
Uauteur conserve la propriete du
droit d'auteur qui protege sa
these. Ni la these ni des extraits
substantiels de celle-ci ne
doivent etre imprimes ou
autrement reproduits sans son
autorisation.
To my parents
To my wife and my daughter
To my friends
ABSTRACT
Gold deposition in a commercial acid gold plating bath (Ronovel N) was investigated by
means of various electrochemical and microscopic techniques, mainly focused on the studies
of the nucleation and crystal growth in the initial stages of deposition. The mechanism and
kinetics of nucleation and crystal growth for both soft and hard gold deposition were
determined, and were found to depend strongly on the applied potential, the solution composition and the substrate used.
It was found from voltammetric and chronopotentiometric measurements that a self-inhibition phenomenon occurs during gold deposition at more positive potentials. An equation describing the dependence of current on rotation rate of rotating disk electrode was derived based on the hypothesis that the reduction of adsorbed AuCN occurs at more positive potentials. This hypothesis was confirmed by the results obtained from voltammetric
measurements.
Nucleation and crystal growth during gold deposition were studied by the analysis of
chronoamperometric curves using nonlinear least-squares (NLS) method. The
potential-dependent inhibition of crystal growth was found during both soft and hard gold deposition at
more positive potentials. The growth rate constant of hard gold is much lower than that of soft gold. Nucleation rate constant of hard gold increases with oveqiotential, in agreement with the atomistic theory. However, nucleation for soft gold is inhibited.
A partial inhibition growth model was developed. It was based on the hypothesis that crystal
growth is partially inhibited and the vertical crystal growth rate decreases exponentially to a
constant at longer times. This model combines the right-circular cones growth model and the
complete inhibition growth model. It was shown that the partial inhibition growth model may
be applied to hard gold deposition. Chronoamperometric curves obtained on gold, glassy
carbon and nickel substrates at more negative potentials are well described by this model. The time-dependent inhibition of crystal growth was found for hard gold deposition at more negative potentials. For glassy carbon electrode, alternatively, another simple model of
three-dimensional cylindrical growth presented in the work also gives a good description for the
experimental data.
The surface morphology of gold deposits was characterized using SEM and AFM techniques.
The inhibition of crystal growth observed electrochemically was further confirmed by ex-situ
SEM and AFM observation. Three-dimensional progressive nucleation was found in gold deposition at more positive potentials. Furthermore, AFM confirmed that the growth features of gold deposits, obtained on Cu substrate at more positive potentials, are pyramids rather than rounded "hemispheroids", in a good agreement with the assumption of right-circular
cones growth used in the nucleation and crystal growth model. The bimodal distribution of
crystal size was observed from the SEM of hard gold obtained at more negative potentials,
SOMMAIRE
La deposition de 1'or dans un bain de placage acide commercial (Ronovel N) a ete etudiee au moyen de differentes techniques electrochimiques et microscopiques, se concentrant principalement sur les etudes de nucleation et de croissance des cristaux aux stades initiaux de la deposition. Le mecanisme et la cinetique de nucleation et de croissance des cristaux ont ete determines pour la deposition de 1'or dur et doux. Us dependent fortement du potentiel
applique, de la composition de la solution et du substrat utilise.
II fat determine a partir des mesures voltamperometriques et chronopotentiometriques qu'un phenomene d'auto-inhibition se produit durant la deposition de 1'or a potentiels plus positifs. Une equation decrivant la dependance du courant sur la vitesse de rotation de 1'electrode toumante a disque a ete derivee en se basant sur 1'hypothese que la reduction du AuCN adsorbe se produit aux potentiels plus positifs. Cette hypothese fut confirmee par les resultats obtenus a partir des mesures voltamperometriques.
La nucleation et la croissance des cristaux durant la deposition de 1'or dur furent etudiees par 1'analyse des courbes chronoamperometnques en utilisant la methode des moindres carres non lineaires. La dependance de 1'inhibition de la croissance des cristaux sur Ie potentiel fat trouvee pour la deposition des deux types d'or, dur et doux, aux potentiels plus positifs. La constante de vitesse de nucleation pour 1'or dur augmente avec la surtension, en accord avec la theorie atomistique. Toutefois, la nucleation de 1'or doux est inhibee.
Un modele pour 1'inhibition partielle de la croissance a ete developpe. II fut base sur
1'hypothese que la croissance des cristaux est partiellement inhibee et que la vitesse verticale de croissance des cristaux decroit exponentiellement jusqu'a une valeur constante aux temps longs. Le modele developpe combine Ie modele de croissance en cones circulaires et Ie modele
croissance peut etre applique a la deposition de 1'or dur. Les courbes chronoamperometriques obtenues sur les substrats d'or, de carbone vitreux et de nickel aux potentiels plus negatifs sont bien decrites par ce modele. II fat trouve que 1'inhibition de la croissance des cristaux pour la deposition de 1'or dur depend du temps aux potentiels plus negatifs. Pour 1'electrode toumante a disque de carbone vitreux, un autre modele simple de croissance cylindrique en trois dimensions presente dans Ie travail donne aussi une bonne description des donnees experimentales.
La moq)hologie de la surface des depots de 1'or fat caracterisee par les techniques de MEB et
de microscope a force atomique (MFA). L'inhibition de la croissance des cristaux observee electrochimiquement fat confirmee par 1'observation ex-situ en MEB et MFA. La nucleation progressive en trois dimensions a ete observee pour la deposition de 1'or aux potentiels plus positifs. Le MFA a confirme que les caracteristiques des depots, obtenus sur Ie substrat de Cu aux potentiels plus positifs, est pyramidal plutot qu'hemispherique, en bon accord avec 1'hypothese de la croissance en cones circulaires utilisee dans Ie modele de nucleation et de croissance des cristaux. La distribution bimodale de la grosseur des cristaux est observee par
MEB pour 1'or dur aux potentiels plus negatifs, amenant 1'evidence de 1'inhibition partielle de la
ACKNOWLEDGMENTS
I would like to express my deep and sincere appreciation to Prof. Andrzej Lasia, first for his
never-ending advice, patient guidance and kind help, secondly for his financial support
throughout this work.
Great thanks are due to Dr. Linlin Chen for his assistance and discussions in the initial stages
of this work and for taking AFM images shown in the thesis. The helps of Mr. Pierre Magny
in taking SEM pictures, and Prof. Daniel Guay in the use of AFM equipment, are very
appreciated. Thanks are also due to my colleagues, especially Dr. W. Chrzanowski for his helps in the initial stages of this work, and Dr. D. Miousse for her helps in the work. I also would like to thank Prof. Hugues Menard and Prof. Jean Lessard for allowing to use the equipment in their laboratories.
My special thanks are due to my various friends for their helps, encouragement and friendship throughout this work.
Finally, I wish to thank my parents and my wife. Their endless love, encouragement, patience
TABLE OF CONTENTS
ABSTRACT ... ii
SOMMAIRE ... iv
ACKNOWLEDGMENTS ... vi
TABLE OF CONTENTS ... vii
LIST OF TABLES ... xii
LIST OF FIGURES ... xiii
MAJOR SYMBOLS ... xxv
INTRODUCTION ... 1
CHAPTER 1 ELECTRODEPOSITION OF GOLD ... 3
1.1 Evolution of gold plating baths ... 3
1.2 Development of new plating techniques ... 8
1.3 Mechanistic and kinetic aspects of gold deposition ... 9
1.3.1 Thermodynamics ... 9
1.3.2 Reaction mechanism and kinetics ... 11
1.4 Microstructure of deposit and inclusion in the deposit ... 15
1.4.1 Microstructure of deposit ... 15
1.4.2 Inclusions in gold deposit ... 18
CHAPTER! THEORY OF NUCLEATION AND CRYSTAL GROWTH . 20
2.1 Introduction ... 202.2 Nucleation and crystal growth ... 20
2.2.1 Theory ofelectronucleation ... 20
2.2.2 Kinetics of crystal growth ... 23
2.3.1 Two-dimensional nucleation and growth of cylinders ... 27
2.3.2 Three-dimensional nucleation and growth of right circular cones ... 28
2.3.3 Three-dimensional nucleation and growth of hemispheroids ... 30
2.3.4 Inhibition growth model ... 32
2.3.5 Nucleation and growth under diffusion control ... 35
CHAPTERS EXPERIMENTAL ... 37
3.1 Introduction ... 37
3.2 Electrochemical system ... 38
3.3 Sohitions ... 39
3.4 Pretreatment of working electrodes ... 41
3.4.1 Gold RDE ... 41
3.4.2 Copper RDE ... 41
3.4.3 Nickel RDE ... 42
3.4.4 Glassy Carbon RDE ... 42
3.4.5 Platinum RDE ... 42
3.5 Electrochemical measurement techniques ... 43
3.5.1 Voltammetric measurements ... 43
3.5.2 Chronopotentiometric measurements ... 43
3.5.3 Chronoamperometric measurements ... 43
3.5.4 Measurement of solution resistance ... 44
3.6 Characterization of deposits ... 44
CHAPTER 4 VOLTAMMETRIC STUDY ... 46
4.1 Introduction ... 46
4.2 LSV measurements ... 47
4.2.2 LSVs in soft gold bath ... 49
4.2.3 LSVs in hard gold bath ... 53
4.3 Cyclic voltammetric measurements ... 58
4.3.1 The behavior of soft gold bath ... 58
4.3.2 The behavior of hard gold bath ... 61
4.4 Discussion ... 64
CHAPTERS CHRONOPOTENTIOMETMC STUDY ... 71
5.1 Introduction ... 71
5.2 Chronopotentiometric behavior of soft gold baths ... 71
5.3 Chronopotentiometnc behavior of hard gold baths ... 79
5.4 Discussion ... 88
CHAPTER 6 NUCLEATION AND CRYSTAL GROWTH IN SOFT GOLD
DEPOSITION ... 916.1 Introduction ... 91
6.2 Results ... 91
6.3 Approximation of current-time transients: nucleation and crystal growth models ... 95
6.4 Summary ... 109
CHAPTER 7 NUCLEATION AND CRYSTAL GROWTH IN HARD GOLD
DEPOSITION ... Ill 7.1 Introduction ... Ill 7.2 Development of the partial inhibition growth model ... Ill 7.3 Results and discussion ... 1167.5 Summary ... 136
CHAPTER 8 EFFECTS OF SUBSTRATES ON THE KINETICS OF GOLD
DEPOSITION ... 138 8.1 Introduction ... 138 8.2 Voltammetric studies ... 138 8.3 Chronoamperometric studies ... 148 8.3.1 Copper substrate ... 148 8.3.2Platinumsubstrate ... 150 8.3.3 Nickel substrate ... 1518.3.4 Glassy carbon substrate ... 151
8.4 Derivation of current-time equation for three-dimensional cylindrical growth ... 154
8.5 Discussion and approximation of current-time transients ... 157
8.5.1 Nucleation and growth of gold deposition on Cu substrate ... 158
8.5.2 Nucleation and growth of gold deposition on Ni substrate ... 162
8.5.2 Nucleation and growth of gold deposition on glassy carbon ... 163
8.6 Summary ... 169
CHAPTER 9 CHARACTERIZATION OF GOLD DEPOSITS ... 171
9.1 Introduction ... 171
9.2 SEM observation of hard gold deposits on the gold plated-nickel
electrode ... 1729.3 Characterization of deposits obtained on CuRDE ... 174
9.3.1 Observation of morphology by SEM ... 176
9.3.2 Characterization of surface moq)hology by AFM ... 179
CONCLUSIONS ... 194
LIST OF TABLES
1 Classification of gold electrolytes based on the pH of solution ... 5
2 Examples of bath composition (g 1 ) and operating conditions for hard
gold plating ... 63 Examples of proprietary hard gold plating baths ... 8
4 Solutions used in the work ... 40
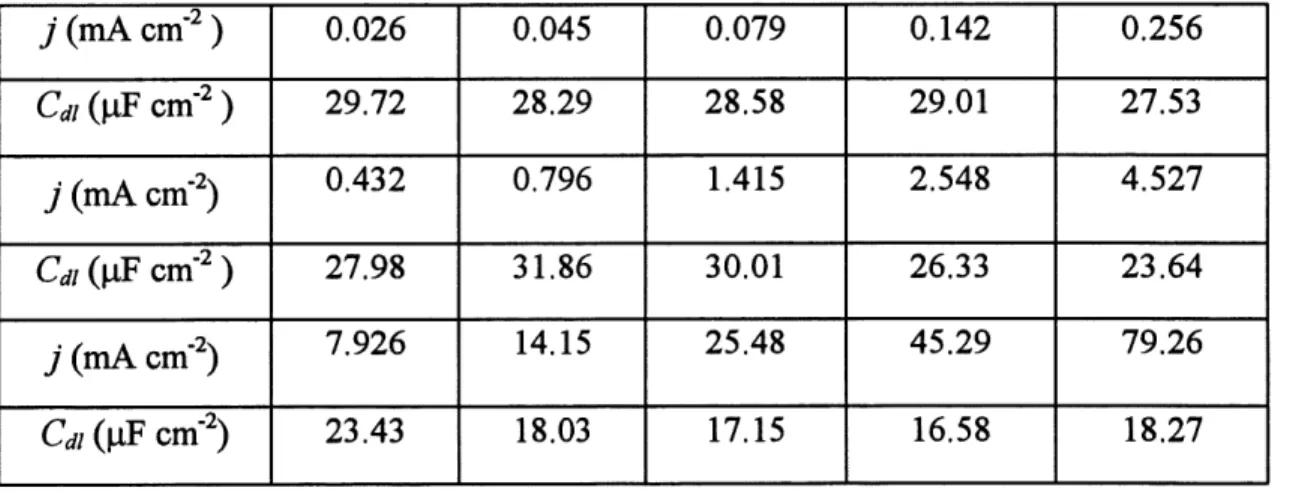
5 Double-layer capacity Cdi determined by the galvanostatic method ... 87
6 Kinetic parameters of hard gold deposition on a gold RDE derived from
the nonlinear least-square fit of experimentaiy - / curves to eq. [7.17] ... 1307 Kinetic parameters of hard gold deposition on a glassy carbon electrode derived from the nonlinear least-square fit of experimental j - t curves to eq. [7.17] ... 166
8 Kinetic parameters of hard gold deposition on glassy carbon electrode derived from the nonlinear least-square fit of experimental j - t curves to eq. [8.14] ... 168
9 The mean surface roughness, Ra, and the maximum grain height, Rmax, for hard gold deposits on Cu at -0.60 V ... 185
LIST OF FIGURES
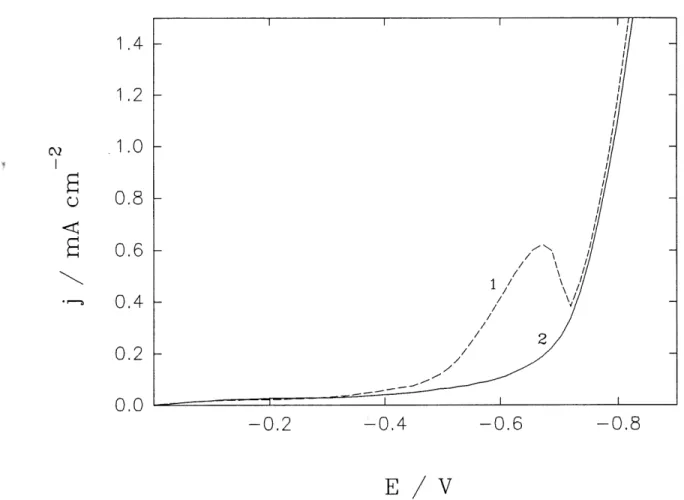
1 LSV curves on a gold RDE m the supporting electrolyte (solution A);
curves: a) stationary Au electrode; b) 650 rpm; c) 2700 rpm ... 47
2 LSVs curves of soft gold deposition on a gold RDE under different rotation
rates; sweep rate: 1 mV S'1; rotation rate: 1) stationary electrode; 2) 200
rpm; 3) 650 rpm; 4) 1300 rpm; 5) 2700 rpm; 6) 4000 rpm ... 49
3 The dependence of LSVs on scan rate for soft gold deposition on a gold
RDE at rotation rate 650 rpm; scan rate (mV s-l): a) 1; b) 2; c) 4; d) 10;
e) 20 ... 51
4 LSV curves of soft gold deposition on a stationary Au electrode; scan rate:
a)0.1mVs-l;b)lmVs-1 ... 52
5 LSV curves of hard gold deposition on a gold RDE at different rotation
rates; sweep rate: 1 mV s ; rotation rate: 1) stationary electrode; 2) 200
rpm; 3) 650 rpm; 4) 1300 rpm; 5) 2700 rpm; 6) 4000 rpm ... 54
6 The dependence ofLSV curves on scan rate for hard gold deposition on a
Au RDE at rotation rate 4000 rpm; scan rate (mV S'1): a)l; b) 2; c) 4; d) 10 55
7 LSV curves of hard gold deposition on a stationary Au electrode; scan rate
(mVs-l-):a)0.2;b)l ... 56
8 LSVs of hard gold deposition on a gold RDE at different pH of solution;
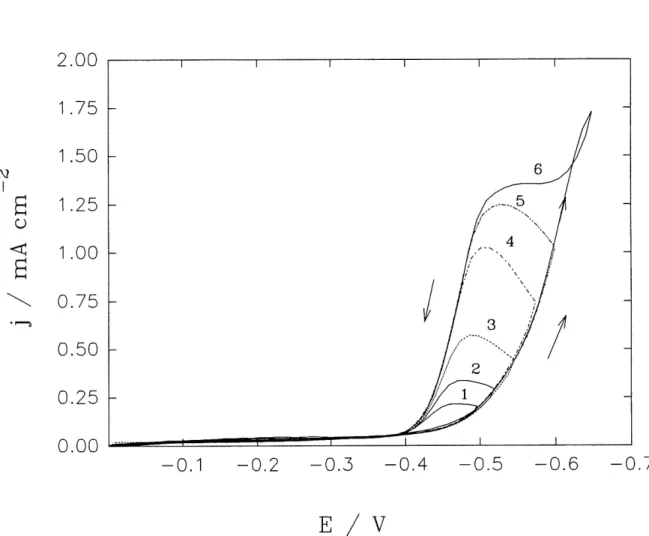
9 Cyclic voltammograms (CV) for soft gold deposition on a gold RDE at
rotation rate 650 rpm; cathodic reversal potential (V): (a): 1) -0.50; 2)
-0.55; 3) -0.60; and (b): 4) -0.65; 5) -0.775; 6) -0.925; arrow: -» cathodic
scan and <-is reversal scanning ... 59
10 The dependence of CVs on scan rate for soft gold deposition on a gold
RDE at 650 rpm; cathodic reveral potential for (a) -0.60 V and (b) -0.75 V;
scan rate: 1) 1 mV s-1; 2) 2 mV s-1; 3) 4 mV s-1; 4) 10 mV s-1 ... 60
11 Cyclic voltammograms for hard gold deposition on a gold RDE at 650 rpm;
scan rate: 1 mV s-l; reversal potential Ef (V): 1) -0.50; 2) -0.525; 3) -0.55;
4) -0.575; 5) -0.60; 6) -0.65 ... 62
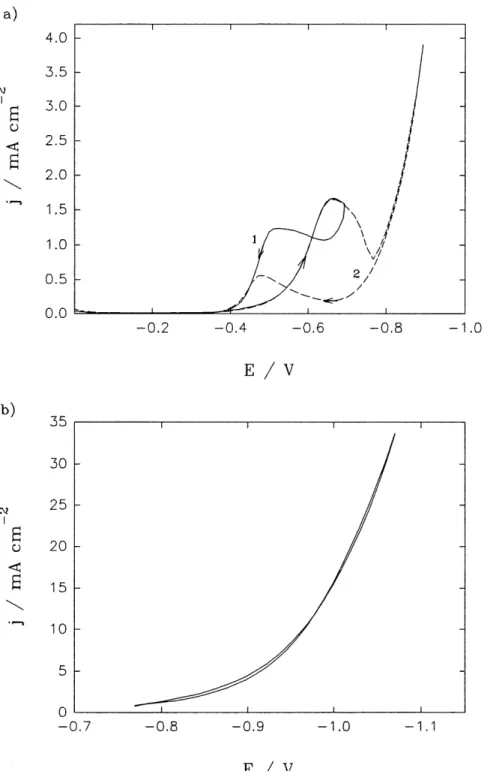
12 Cyclic voltammograms for hard gold deposition on a gold RDE at 650 rpm;
scan rate: 1 mV s"1; in (a) initial potential 0 V, reveral potential (1) -0.7 and
(2) -0.9 V; in (b) initial potential -0.75 V; reversal potential -1.1 V ... 63
I3 The dependence of current against o ; current is obtained from LSV
curves on a gold RDE in the soft gold bath containing additional amount
(20 g I"1) ofoxalic acid. potentials (V): a) -0.50; b) -0.60; c) -0.70; d)
-0.80; e) -0.90; f) -1.0 ... 69
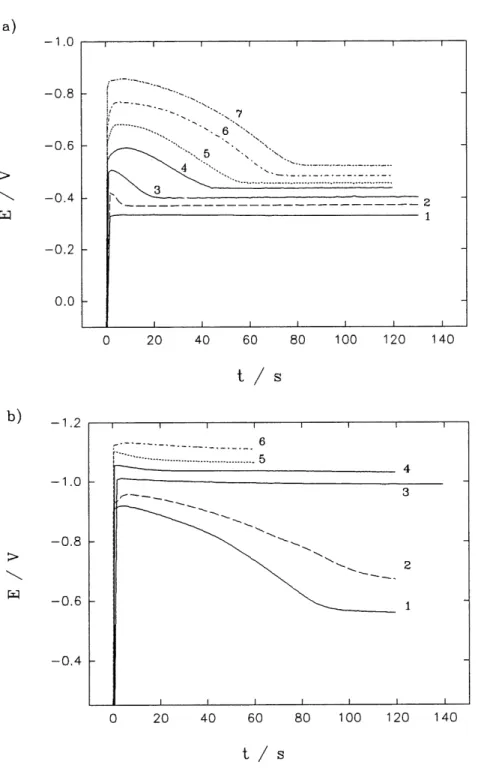
14 Potential-time transients obtained on a gold RDE in solution C; rotation
rate: 4000 rpm; current density (mA cm"2)in (a): 1) 0.079; 2) 0.141; 3)
0.256; 4) 0.453; 5) 0.793; 6) 1.42; 7) 2.55 and in (b) 1) 4.53; 2) 7.93; 3)
15 Crystallization overpotential, Arj, determined from the potential
difference between the initial peak and final steady-state shown in
Fig. 14 for soft gold deposition on a gold RDE, against logarithmic
current density applied for solution C ... 74
16 Steady-state polarization curve for soft gold deposition on a gold RDE
at 4000 rpm. Data was taken from steady-state value in Fig. 14. The
insert of figure shows the dependence of logarithmic current density
against potential at steady-state ... 75
17 Tafel plot based on the initial peak potential on chronopotentiometric
curve shown in Fig. 14 for soft gold deposition on a gold RDE in
solution C ... 77
18 The effects of rotation rate on the shape of potential-time transients for
soft gold deposition on a gold RDE in solution C with addtion of 20 g
I'1 oxalic acid; Au RDE; current density: 4.525 mA cm ; rotation rate
(rpm): 1) 0; 2) 300; 3) 520; 4) 700; 5) 1400; 6) 1800; 7) 2400; 8) 2700;
9)3200 ... 78
19 Chronopotentiometric transients of hard gold deposition on a gold RDE
in solution D; rotation rate: 4000 rpm; current density (mA cm ) in (a):
1) 0.110; 2) 0.170; 3) 0.255; 4) 0.354; 5) 0.453; 6) 0.623; 7) 0.793; and
in (b): 1)1.42; 2) 2.55; 3) 7.93; 4) 14.15; 5) 25.48; 6) 45.29; 7) 79.26 ... 80
20 Crystallization overpotential Arj for hard gold deposition on Au RDE,
determined from the potential difference between the initial peak and
21 Steady-state polarization curve for hard gold deposition on a gold RDE
at 4000 rpm. Data is taken from steady-state value in Fig. 19. The insert
of figure shows the dependence of logarithmic current density against
potential at steady-state ... 83
22 Tafel plot for hard gold based on the initial peak potential on
chronopotential curve shown in Fig. 19 for soft gold deposition on a
gold RDE in solution D ... 84
23 The effects of rotation rate on the shape of chronopotentiometric curves
for hard gold deposition on a gold RDE; solution D with the addition of
20 g 1 oxalic acid; current density: 0.452 mA cm ; rotation rates (from
the top to the bottom) (rpm): 1) 0; 2) 300; 3) 520; 4) 700; 5) 1400; 6)
1800; 7) 2400; 8) 2700; 9) 3200 ... 85
24 The dependence of initial peak potential on rotation rate for hard gold
deposition on a gold RDE; solution D with the addition of 20 g I'1 oxalic
acid; current densities (mA cm'2): a) 0.142; b) 0.254; c) 0.793; d)1.42;
e) 7.93 ... 86
25 Chronopotentiometric curves obtained on a fresh polished Au RDE (a)
and an unpolished Au RDE (b) and (c); solution D with the addition of
20 g 1 oxalic acid; current density: 0.254 mA cm ; rotation rate: 2700
rpm ... 89
26 Experimental current-time transients for soft gold deposition on a gold
27 Tafel plot constructed on the basis of the initial current minimum shown
in Fig. 26, for soft gold deposition on a gold RDE from solution C ... 96
28 Initial portions of current-time transients shown in Fig. 26 for soft gold deposition on a gold RDE at potentials from -0.725 V to -0.850 V;
points - experimental, solid lines - theoretical fit to eq. [6.1] ... 98
29 Initial portion of current-time transients shown in Fig. 26 for soft gold
deposition on a gold RDE at potentials from -0.500 V to -0.725 V;
points - experimental, solid lines - theoretical fit to eq. [6.3] ... 100
30 Simulated current-time transients according to eq. [6.3] for soft gold
deposition on a gold RDE at -0.500 V (lines b and b') and -0.725 V
(lines a and a'), total current (lines a and b), and the contribution of a
two-dimensional growth process (lines a' and b') ... 101
31 Current-time transients for soft gold deposition on a gold RDE from solution C at potentials between 0.900 V and 0.975 V; points
-experiment, solid line - theoretical fit to eqs. [6.4] and [6.5] ... 102
32 Plot of the logarithm of outward growth rate constant for substrate base
plane, log A:o, against potential for soft; gold deposition on a gold RDE
from solution C ... 104
33 Plot of the logarithm of vertical growth rate constant, log k\ determined
from eqs. [6.1] and [6.3], against potential for soft gold deposition on a
34 Plot of current for a secondary growth process, zFks, determined from
eq. [6.5], against potential for soft gold deposition on a gold RDE at
potentialsfrom-0.900Vto-0.975V ... 106
35 Plot of log A^ASD, determined from eqs. [6.1] and [6.3], against potential
for soft gold deposition on a gold RDE from solution C ... 107
36 Plot of nucleation rate of soft gold on a gold RDE in solution C, ^30,
eqs. [6.1] and [6.3], versus potential assuming that the growth rate
constants in vertical and lateral directions are equal ... 108
37 Simulated current-time transients according to eq. [7.12]; (a) k\= kz=
P2=A=l;(b)A;i=^=P2=l,A=0.5;(c)^=P2=^=l,A:i=3 ... 115
38 Experimental current-time transients for hard gold deposition on a gold
RDE at vanous potentials; rotation rate: 4000 rpm ... 117
39 Tafel plots constructed on the basis of the initial minumum (•),
maximum (V) and steady-state current (v), shown in Fig. 38, for hard
gold deposition on a gold RDE ... 120
40 Initial portion of current-time transients shown in Fig. 38 for hard gold deposition on a gold RDE at potentials between -0.50 V and -0.70V;
points - experimental data; solid line - theoretical fit to eq. [2.27].
41 Plot of log ko, determined from eq. [2.27], against potential applied for
hard gold deposition on a gold RDE at potentials between -0.5 and
-0.7V ... 124
42 Plot of log k, eq. [2.27], against potential applied for hard gold
deposition on a gold RDE at potentials between -0. 5 and -0.7V ... 125
43 Plot of log A^SD, eq. [2.27], against potential applied for hard gold
deposition on a gold RDE at potentials between -0.5 and -0.7 V ... 126
44 Plot of log A-so, eq. [2.27], assuming that growth rate constants in
vertical and lateral directions are equal, against potential applied for hard
gold deposition on a gold RDE at potentials between -0.5 and -0.7V .... 127
45 Theoretical fit of experimental transients to eq. [7.17] for hard gold
deposition on a gold RDE from solution D at potentials more negative than -0.75V; points - experimental data; solid line - fitted. The
parameters derived are shown in Table 6 ... 129
46 Dependence ofko (circle) and k-i (full circle), determined from eq. [7.17],
on potential applied for hard gold deposition on a gold RDE at potentials
more negative than-0.750 V ... 131
47 Dependence of ^i, eq. [7.17], on applied potential for hard gold
48 Dependence of log (k^No), eq. [7.17], on applied potential for hard gold
deposition on a gold RDE at potentials more negative than -0.75 V ... 134
49 Dependence of log X, eq. [7.17], on applied potential for hard gold
deposition on a gold RDE at potentials more negative than -0.750 V .... 135
50 LSV curves of hard gold deposition on various substrates at 4000 rpm
and 1 mV s ; substrates: a) Au; b) Cu; c) Ni; d) Glassy carbon ... 139
51 LSV curves of hard gold deposition on a Cu RDE at different rotation rates;
sweep rate: 1 mV S'1; rotation rates (bottom to top) are shown in the figure. 140
52 LSV curves of hard gold deposition on a Ni RDE at different rotation
rates; sweep rate: 1 mV s ; rotation rate (rpm): a) 650; b) 1300; c)
2700; d) 4000 ... 141
53 LSV curves of hard gold deposition on a glassy carbon RDE at different
rotation rates; sweep rate: 1 mV s ; rotation rate (rpm): a) 200 b) 650;
c) 1300; d) 2700; 5) 4000 ... 142
54 LSV curves recorded on copper (a) and nickel (b) in the supporting
electrolyte (solution A); rotation rate: 650 rpm; sweep rate: 1 mV s ... 143
55 LSV curves on a Cu RDE in the supporting electrolyte (solution A, curve a)
and the supporting electrolyte containing 0.0273 M Ni2+ (solution B, curve
56 LSV curves of soft gold deposition on a Cu RDE; sweep rate: 1 mV s ;
rotation rate (rpm): (a) 1000; (b) 2700 ... 145
57 Cyclic voltammograms of hard gold deposition on a Ni RDE; rotation
rate: 4000 rpm; sweep rate: 1 mV s"1. reversal potential: -0.6 V (solid
line) and -0.65 V (dashed line) ... 146
58 Cyclic voltammograms of hard gold deposition on a glassy carbon RDE;
rotation rate: 4000 rpm; sweep rate: 1 mV s . reversal potential (V): a)
-0.6 V; b) -0.7 V ... 147
59 Chronoamperometric curves of hard gold deposition on a Cu RDE; rotation
rate: 2700 rpm; potentials in Fig. 59a (mV): a) 550; b)575;c)600; d)
-625; e) -650; f) -675 ... 149
60 Chronoamperometric curves of hard gold deposition on a Pt RBE;
rotation rate 4000 rpm; potentials (mV): a) -550; b) -600; c) -650 ... 150
61 Chronoamperometric curves for hard gold deposition on a Ni RDE.
rotation rate 4000 rpm; potentials (mV) in (a): 1) -500; 2) -525;3)-600;
4) -650 and in (b): 1)-825;2)-850;3) -875; 4) -900 ... 152
62 Chronoamperometric curves of hard gold deposition on a glassy carbon
RDE; rotation rate 4000 rpm; potentials (mV) in (a): 1) -550; 2)-600;
63 Three-dimensional cylindrical growth with growth rate constants k and
k' in lateral and vertical directions, respectively ... 154
64 Initial portion of current-time transients shown in Fig. 59 for hard gold deposition on a Cu RDE at potentials between 0.55 and 0.70 V; points
-experimental data; solid line - theoretical fit to eq. [2.27] ... 159
65 Plot of log Ao (0) and log k' (•) for hard gold deposition on a Cu RDE,
determined fi-om eq. [2.27], against potential applied between -0.55 and
-0.70V ... 160
66 Plot of log ktA3o for hard gold deposition on a Cu RDE, determined from
eq. [2.27], against potential applied between -0.55 and -0.70 V ... 161
67 Theoretical fitting curves of experimental chronoamperometric curves
for hard gold deposition on a Ni RDE; potential (mV) in (a) -825 and in
(b) 850; points-experimental data; solid line - theoretical fit curves to
eq. [7.17] ... 164
68 The theoretical fitting curves of experimental data for a glassy carbon
RDE (Fig. 62) to the partial inhibition model (eq. [7.17]); points
-experimental data; solid line - theoretical fit to eq. [7.17]. The
parameters derived from least-square fit age given in Table 7 ... 166
69 Theoretical fitting curves of experimental data (Fig. 62) to eq. [8.14] for
hard gold deposition on a glassy carbon RDE; points-experimental data;
solid line - theoretical fit to three-dimensional cylindrical growth
(eq. [8.14]). The perameters derived from least-squares fit are given in
Tables ... 167
70 SEM of hard gold deposits on the gold-plated Ni electrode at -0.65 V
after 250 s; magnification: a) 2,000x, b) 10,000x, c) 20,000x ... 173
71 SEM of hard gold deposits on the gold-plated Ni electrode at -0.9 V
after 120 s; magnification: a) 2,000x, b) 10,000x ... 175
72 SEM of soft gold deposits on Cu at -0.60 V; deposition time (s): (a) before
deposition; (b) 50; (c) 150; (d) 600 ... 177
73 SEM of soft gold deposits on Cu at different potentials; (a) -0.60 V, 600 s;
(b) -0.80 V, 600 s; (c) -1.00 V, 250 s ... 178
74 SEM of hard gold deposits on Cu at -0.60 V; deposition time (s): (a) 50; (b)
150; c) 300; (d) 400 ... 180
75 SEM of hard gold deposits on Cu at different potentials; (a) 450 s, -0.60 V;
(b) 450s, -0.75 V; (c) 150 s, -1.00 V; (d) 450 s, -1.00 V ... 181
76 Top-view AFM images of soft gold deposits on Cu at -0.60 V at
different times; deposition time (s): (a) 50; (b) 250; (c) 600... 183
77 Top-view AFM images of soft gold deposits on Cu at different
potentials: (a) -0.70 V, 600 s; (b) -0.80 V, 600 s; (c) -0.95 V, 250 s; (d)
78 Top-view AFM images of hard gold deposit on Cu, deposition time:
450 s; potentials (V): (a) -0.55; (b) -0.60; (c) -0.65; (d) -0.70; (e) -0.80;
(!)-1.00 ... 186
79 3D view AFM images of hard gold deposits on Cu at -0.60 V;
deposition time (s): (a) 50; (b) 150; (c) 450 ... 187
80 3D view AFM images of hard gold deposits on Cu at different
potentials; deposition time: 450 s; potential (V): (a) -0.50; (b) -0.65; (c)
-0.75 ... 189
81 The dependence of the mean surface roughness, Ra, and the maximum grain height, Rmax, for gold deposits obtained on Cu from hard gold
bath, against potential applied between -0.50V and -0.80V ... 190
82 Section analysis ofAFM images (left) and top-views (right) of hard gold
deposits on Cu at different potentials. Cross-sections through the top
view shown at the right side are marked as a black line; deposition time:
MAJOR SYMBOLES
A' rate of conversion of one site mto a nucleus (s ) A nucleation rate constant (nuclei cm s )
Asa nucleation rate constant for two-dimensional nucleation and growth ASD nucleation rate constant for three-dimensional nucleation and growth C concentration of depositing metal in solution (mol cm'3)
Cai double layer capacity (pF cm"2)
D diffusion coef&cient (cm'2 s )
E potential (V) and the expection of coverage in Evans theory.
F Faraday constant (C moF )
A G free energy for hetergeneous critical nucleation (J moF )
h height of atomic layer (cm)
/ current (mA)
j, jmax, j st current density (mA cm'2), maxunum and steady-state current density.
k, k' growth rate constants (mol cm'2 s"1) m lateral and vertical directions, respectively. k\, k-i constants m the partial inhibition model
ki, k.i, ks reaction rate constants
K,KKfKi constants
M atomic weight of depositing metal (g)
N the number of nuclei formed at time t (cm)
No the total number of active sites per unit surface area (cm'2) PQ, Pi, P-z, ?3 constants in models
r reaction rate, and radius of growing crystal
R gas constant (J mol K )
Ra, Rmax mean surface roughness and maximum grain height (nm) S actual fractional area of growth centres
t tune (s)
T absolute temperature (K)
v growth rate (cm s )
V volume of deposited metal (cm3) and growth rate
Vf growth rate VQ constant
z number of electron transferee! a transfer coefficient
P constant
e eccentricity ofellipsoids
Y surface energy (J mol'1)
77 overpotential (V or mV)
2 inhibition parameter in partial inhibition model
v kinematic viscosity (cm s )
0 surface coverage ofadsorbed AuCN
p density of deposited metal (g cm'3)
co angular frequency
INTRODUCTION
Gold deposits are extensively used in the electrical and the electronic industries as well in
decoration. The unique combination of good electrical conductivity coupled with excellent physical and chemical properties has led to its widespread adoption as standard materials for
contacts, bonding, joining and high performance, high reliability conductors in electronic
industry.
Gold deposits are usually classified into two categories, i.e., soft gold and hard gold deposits.
So-called soft gold deposit (Vickers hardness 60-90 KV N25 (1)) is usually pure gold, which
has high electrical conductivity, high corrosion resistance, good ductility and solderability. It is used mainly in semiconductor devices, in which bond strength is of primary importance. However, soft gold has relatively poor wear resistance, its applications in contacts and
connectors are limited. Hard gold (hardness 120-260 KV N25 (1)), which contains a small
amount of transition elements as hardeners, meets the combined requirements of low electrical contact resistance, low porosity, high corrosion resistance and excellent wear resistance, hence, it is used as contact materials in electrical and printed circuit boards.
Although practiced for more than 150 years, the technology of gold electroplating has been
developed to its present high level of efficiency only in the last decades, due to the fast
development of electronic industry since 1940's. This industry becomes the major user of gold plating. For example, the world consumption of gold electrodeposits in electronic applications
in 1990 was up to 110 000 kg (1). It is the continuous growth of electronic industry that has
ensured and stimulated the necessary research and development work in the field of gold electroplating. In spite of its widespread use in electronic industry, the fundamentals of gold deposition process are not fully understood and still need to be explored.
The aim of the present work is to study the mechanism and kinetics of gold deposition in a
proprietary acid solution (Renovel N bath) by means of various techniques, mainly focused on
the mechanism and kinetics of nucleation and crystal growth in the initial stages of gold
deposition. As a background to this work, chapter 1 reviews the study of gold electrodeposition, chapter 2 reviews the theory of nucleation and crystal growth. The experimental details are given in chapter 3. The results obtained by voltammetry and chronopotentiometry are presented in chapter 4 and 5, respectively. Chapter 6 and 7 present the results obtained from chronoamperometnc measurements for soft gold and hard gold. The
mechanism and kinetics of nucleation and crystal growth of gold deposits in the initial stages
are discussed in details by analyzing chronoamperometric curves. Furthermore, a partial inhibition model is developed in the section 7.2. Chapter 8 deals with the influence of substrates on gold deposition, a three-dimensional nucleation and cylindrical growth model is derived in the section 8.4. In chapter 9, gold deposits obtained on Au and Cu substrates are
characterized using scanning electron microscopy (SEM) and atomic force microscopy
(AFM).
The present work has led to following publications:
1. W. Chrzanowski, Y. G. Li, A. Lasia, J. App. Electrochem. 26, 385 (1996).
2. Y.G. Li, W. Chrzanowski, A. Lasia, "Nucleation and crystal growth in gold electro-deposition from acid solutions. Part I. Soft gold". J. App. Electrochem., in press (1996). 3. Y.G. Li and A. Lasia, "Nucleation and crystal growth in gold electrodeposition from acid
solution. Part II. Hard gold". J. App. Electrochem., in press (1996).
4. Y.G. Li and A. Lasia, "The study of gold electrodeposition on Cu by electrochemical and microscopic techniques", J. App. Electrochem., submitted (1996).
5. Y.G. Li and A. Lasia, "The influence of substrate on gold electrodeposition", under preparation.
CHAPTER 1
ELECTRODEPOSITION OF GOLD
The electrodeposition of gold may date back to the 18th century, the first record of gold
electroplating being in 1802 by Brugnalelli (2). However, it was not until 1840 that the
Elkington brothers patented the forerunner of modem gold electroplating formation based on the gold potassium cyanide (3). Since then, especially in the last a few decades, a large number of studies have been undertaken from various points of view, and these studies are still in progress. The main investigation interests in gold deposition lay in four aspects:
• chemistry of baths;
• new plating techniques;
• mechanism and kinetics of the deposition; • structure and properties of deposits.
1.1 Evolution of gold plating baths
The main aims of studies on the chemistry of gold plating bath are: to develop new
baths for specific applications, to modify old bath to improve the quality of deposits, to
understand the performance of the electrolyte and the function of individual components in solution.
Wide application of gold deposits has led to the development of hundreds of greatly
diversified, mostly proprietary bath formulations (4). In the past 155 years, the original plating
bath patented by the Elkington brothers, which was initially developed for decorative use, has
evolved into about 300 different modifications in the United States and about 100 in Europe
due to the change of fads and fashions in the decorative fields. With the development of the
deposits that had been required for decorative plating. The physical properties rather than
the colors of the gold deposit should be modified. This has resulted in the evolution of
over 200 more gold and gold-alloy baths. The development of hundreds of different gold
baths was paralleled by only about 40 different baths for nickel or copper plating.
Nevertheless, only a small number of bath types are really required at any given times. It
seemed in the past that gold plating bath changed gradually from alkaline to acid solutions.
The classification of gold plating bath is usually based on the pH of the solution which is one
of determining factors for the properties of the deposit. Although hundreds of baths were
developed in the past, they can be classified into four main groups according to the pH of the
solution (5), i.e., alkaline cyanide, neutral cyanide, weakly acidic and strongly acidic baths, as shown in Table 1.
Alkaline cyanide electrolytes have traditionally been used for deposition of decorative coating of various colors. High concentrations of free cyanide are usually contained in solution. Pure
gold coating used in semiconductors in electronic industry is mainly deposited from neutral
electrolytes, in which a gold coating of high purity, high ductility, good solderability and
bondability are called for. The weakly acidic electrolytes are by far the most important in the
electronic industry. They are less toxic and permit one to use much higher current densities as compared with traditionally used alkaline cyanide solutions. They are used, for example, in the plating of contacts and printed circuit boards. A further development in recent years is the use
of weakly acidic gold electrolytes in a modified form, in selective plating under high speed
conditions. This process is used increasingly in the electronic industry.
Generally, each kind of bath contains: 1) gold complex salt, usually gold cyanide, sometimes
Na3Au(S03)2; 2) conducting salts; 3) buffer salts; 4) complex or chelate salts; 5) brightener or
hardener; 6) additives, etc. Typical bath formulations for hard gold plating are given in
Table 1. Classification of gold electrolytes based on the pH of solution (5).
Bath type
Alkaline
NeutralWeakly
acidic
Strongly
acidic
pH
range 8-13 6-8 3-6 0.5-2.5Au
complexKAu(CN)2
or(Na3Au(SOs)2)
KAu(CN)2
KAu(CN)2
KAu(CN)4
Conducting
and buffer salts
Alkaline
Phosphates
Citrates
Phosphates
Weak organicacids
(e.g. citric acid)
Acids
Acid salts
Year of introductionSince 1840
(baths with
KAu(CN)2)
After 1945
After 1955
After 1980
Main
application
Decorative(electrical
engineering)
ElectronicsElectrical
engineering, electronics Decorative(electronics)
Table 2.
Examples of bath composition (g I'1) and operating conditions for hard gold
plating (1).
GoldasKAu(CN)2
Citric acid
Tetraethylene PentaminePhosphoric acid
Ni-citrate Co-EDTA Temperature, CCurrent density (A cm )
1
4
120
20
2.540
20
2
12
105
12.51
35
5
In weakly acidic solutions, there are two basic types of buffer systems used, i.e., citrate and phosphate, or their mixtures (6-8), although other organic compounds were also patented (10). Except for its buffering effect, citrate also acts as a conducting salt and a complexing
agent.
Transition elements such as cobalt, nickel and/or iron are the preferred alloying metals in acid
hard gold bath (4). The codeposition of only 0.5% of these metals is sufficient to create a
bright, hard and abrasion resistant gold layer characterized by electrical conductivity, contact
resistance and corrosion resistance comparable with pure gold. In addition to the alloying metal, the gold deposits usually contain 0.5 -1.0 % of organic matter (5). In order to control and maintain a certain level ofhardener in solution, the hardener should be complexed with an organic compound. Various nickel or cobalt complexes are used. For example, in nickel
oxalate, Ni-ATMP (ATMP is nitrilotri(methylene)phosphonic acid), etc., were reported
(7,8,10,11). If the complex is too weak, the free concentration of nickel is not easily
controlled, the properites of deposits obtained may vary with the age of the bath. If the
complex is too strong, then the total concentration of nickel in solution should be very high to maintain a suitable level of free nickel. In the earlier practice, very weak complexes were used. Now, mediate complexes are preferred in the application. Sometimes, nurtures of complexes
are used.
In gold deposition, Au (I) may be partially oxidized at the anode to Au (III), leading to a
decrease of current efficiency because only Au (I) is reduced to Au on the cathode (12). In
order to prevent the oxidation of Au (I), a reducing agent is needed in the bath. Oxalic acid
may be a suitable selection since it has a weak reducing ability for Au (III) (8). Oxalic acid
may also act as a complex for metal impurities. However, it should be noticed that a too high concentration of oxalic acid may cause electroless reduction of gold on the walls of the tank,
which results in the loss of gold. Instability of solution may also be caused by a relatively high
concentration ofoxalic acid in the solution.
A large improvement in the modem gold deposition bath resulted from the introduction of a
current extender into the solution. Typically, such a current extender increases the bath's
ability to plate at high current density without the deposit being "burnt" (a "burnt" deposit is
spongy and black). This is specially important for modem selective high speed plating.
Various compounds, for example, formic acid (10), a heterocylic azohydrocarbon sulfonic
acid and or its salts (13), glycolic acid and its salts (14), and substituted pyridine compounds
(8), etc. are commonly used as current extenders.
As mentioned above, many bath formulations for gold plating are proprietary. Table 3 gives
Table3.
Examples of proprietary hard gold baths (9).
GoldasKAu(CN)2
Nickel as a proprietary complex
Cobalt as a proprietary complex
Conductivity-bufFer salts
Current density extender
Complexing agent
pH
Nickel-hardened gold bath
(g 1-')
4-30 0.6 to 0.7150
60
20
3.8Co-hardened gold bath
(g 1-1)
4-30 0.3 to 0.7140
60
10
4.11.2 Development of new plating techniques
The developments in gold plating are determined by its economic laws, i.e., using the smallest
amount of gold to provide the desired thichiess and plating as fast as possible from a
minimum amount of solution to lower the investment in gold plating facilities (4). In addition
to the developments of bath chemistry described above, techniques and equipment for gold
plating have been improved greatly during the last twenty years. This technical revolution has
been stimulated by increases in production costs and in the price of gold. Especially in the
electrical and electronic industry, selective high speed plating has replaced vat and barrel
plating, which was formerly widely used. Strips and spots are plated on the functional areas of
technical parts using different approaches such as reel to reel plating, selective dipping, jet
plating with masks and tampon plating (15). With these new techniques available for plating
faster, more efficiently and with less gold, attention has been focused on ways and means of increasing current densities and deposition rates. Weakly acidic gold baths are currently used
Pulse plating (21-24) is another approach to overcome problems resulting from the bath
chemistry. The current density during the pulse is very high to give an acceptable high
deposition rate. The main advantages of pulse plating are an increase in throwing power of the
electrolyte and a decrease in the porosity of deposit (23).
Finally, laser enhanced plating (LEP) (16, 25) has been provided as a hopeful way to increase
the deposition rate in selective plating without masking. In LEP, gold deposition occurs
preferentially from electrolyte which is locally heated to temperature of 100 °C or higher as
the result of laser-irradiation of the substrate surface. However, further research still must be done before there is a wide application of this new technique.
1.3 Mechanistic and kinetic aspects of gold deposition
In its early practice, the processing of gold plating was somewhat unreliable, success mainly depended on the experience and skills of operators due to a serious lack of the basic
knowledge on the process. Because gold film has gained a widespread application as a
functional coating in various technical areas and the performance of this relatively thin film is
critical to the correct functioning of many devices, a fall understanding of the mechanism and
kinetics of gold deposition is of great importance for practical applications.
1.3.1 Thermodynamics
Since the potential of free Au (I) is very positive (£° =1.68 V), it must be presented as a
complex in the plating solution in order to obtain a good deposit. The electrochemical reduction of gold in cyanide-containing electrolytes is represented by:
Kd= Ka= Ka= KW = 5.0xl0-39 4.93xl0-10 10-' 1.008xl0-14
[1.2]
[1.3]
[1.4]
[1.5]
The standard electrode potential, J^, of this reaction was determined by Maja (26) to be
-0.600 V (SHE) at 25°. In practice, the equilibrium potential of the Au(CN)2' /Au couple may
be affected by following reactions:
Au(CN)2'^Au++2CN"
HCN^lT+CN-H ^ IT +
Au(CN)2-
HzO^lT+OH-where the equilibrium constants (27,28) are for 25 °C. Accordingly, the principle cyanide
containing species in weak acid solution at pH 3.5 ~ 5 are Au(CN)2' and HCN. The reversible electrode reaction [1.1] may be better rewritten as
Au(CN)2' +2H" +e ^^ Au+2HCN [1.6]
The standard potential of reaction [1.6] at 25° is estimated to 0.501 V (SHE), or 0.257 V vs.
SCE. The thermodynamic reversible potential ofAu(I)/Au couple at 25 is
£=£°+0.0591 log [Au(CN)2']-0.1183^-0.1183 log [HCN] [1.7]
here brackets indicate activities, or, approximately, concentrations. Thermodynamically, gold
deposition in acid solution may occur at much more possitive potentials than that in alkaline
solution since the value of £ in eq. [1.7] is more positive at lower pH and lower [HCN].
The potential of gold electrode essentially depends on the state of the surface and it is a mixed
potential by its nature (29). In gold-plating studies, the concentration of free HCN or CN' in
solution increases continuously with the amount of gold deposited. Furthermore, the rest
potential of the gold electrode may be influenced by the adsorption ofcyanide species (30)
and gold cyanide (31). Besides, a number of chemical side reactions (32), for example, the
hydrolysis of CN', can also affect the concentration of HCN or CN' at the electrode surface,
leading to a change in the equilibrium potential of reaction [1.6]. Thus, under actual operating
different from the case of alkaline plating solution containing a large excess of free cyanide in
which the concentration ofcyanide on the surface is constant during deposition.
A very high stability of the gold (I) cyanide complex, Au(CN)2', enables it to be used in
plating solutions at a pH as low as 3.0 (2). The complex stability also raises the deposition
potential sufficiently to allow less noble metals to be codeposited simultaneously with gold.
Ni2++2e=Ni £°=-0.50V (SCE) [1.8]
Co2++2e=Co £<)=-0.52V(SCE) [1.9] The reduction-oxidation potential of reactions [1.8] or [1.9] is determined by the concentration of free metal in the complex solution.
1.3.2 Reaction mechanism and kinetics
Although the individual bath formulations used in industry differ significantly, the cathodic
process of gold deposition from potassium dicyanoaurate containing electrolyte, in princible,
can be described by the following overall reaction [1.1]:
Au(CN)2'+e^Au+2CN- [1.1]
This reaction in an acidic solution is highly irreversible since the concentration of CN~ is very close to zero. Available experimental data indicate that this reaction is complicated in
character.
Maja (26) studied both the thermodynamic and electrochemical kinetic behavior of gold in
an alkaline cyanide bath with the excess of free cyanide. Adsorbed Au(CN)2' was suggested
as a reaction intermediate for cathodic deposition. He concluded that the reaction occurs as
follows:
Au(CN)2-^ I Au(CN)2l ads [1.10]
Subsquently, the mechanism of gold deposition from alkaline, neutral and acid gold solutions
was studied by other authors (33-37) by means ofcyclic voltammetry, chronopotentiometry, chronoamperometry, impedance spectroscopy, etc. The suggestion of the adsorption of
Au(CN)2' as reactive species in gold deposition (26) was later criticized by Mac Arthur (33),
based on his voltammetric and chronopotentiometric results. He found a prepeak with a constant capacity, independent of sweep rate, occurring on the voltammograms of gold
deposition at less negative potentials from alkaline cyanide solutions, and suggested that the
prepeak is caused by the reduction of AuCN adsorbed on the electrode surface. He postulated two reduction paths for gold deposition, in which the one, at lower overpotentials, involves the adsorbed intermediate AuCN as reactive species and the other, at higher overpotentials, is a direct charge transfer to the soluble Au(CN)2'. The so-called prepeak at the foot of the polarization curve was also observed by other authors (34,38,40-45). It was found (33,
34,40,42) that such a prepeak was usually not affected by the rotation rate of the electrode
and the sweep rate, especially for gold deposition from alkaline cyanide solution containing an
excess of free cyanide, although the influence of rotation rate on the prepeak (or plateau)
current was observed by Eisenmann (38) for gold deposition from a neutral phosphate
electrolyte. As an origin for the prepeak, nevertheless, various suggestions can be found in literature. The electroless deposition of gold caused by CN~ oxidation was suggested by Eisenmann (38) to explain the reaction at lower overpotentials. The following reactions were suggested, i.e,
CN-^l/2(CN)2+e [1.12]
Au(CN)2' + e^Au + 2CN- [1.13]
and the total reaction
Au(CN)2"^Au + CN-+1/2(CN)2 [1.14]
The plateau current at lower overpotentials was found to be proportional to co174. Most authors, however, agreed that such prepeak is associated with film formation. Burrows et al.
while Kurnoskin et al. (37) believed that the prewave is relative to the electroless deposition
of gold via the disproptionation of AuOH. Finally, as a generally accepted view, it is most
likely that the prepeak arises from the reduction of adsorbed AuCN film (33,36,39,40,42),
which was proved by various techniques used for the identification of AuCN in gold deposits
(see subsection 1.4.2). Therefore, the two reduction paths first proposed by Mac Arthur (33) are accepted for gold deposition from potassium dicyanoaurate. At lower oveq^otentials, gold
deposition occurs via the chemical adsorption ofAuCN followed by the charge transfer step:
Au(CN)2' ^AuCNads+ CN" [1.15]
AuCNads+ e ^ Au + CN" [1.16] and at higher oveq)otentials, it proceeds via direct charge transfer reaction
Au(CN)2" + e^^Au +2 CN" [1.17]
where CN~ should exist as HCN in above reactions if an acidic or neutral electrolyte is considered.
The kinetics of gold deposition from different baths, mostly confined to alkaline cyanide
solutions, was studied by various authors (33-47). Most of the measurements were carried out at potentials more negative than -0.8 V. The kinetic parameters given by different authors are often shown to be quite different, due to a difference in the composition of solutions and techniques used. Two Tafel slopes were usually obtained. The larger one (from 250-350 mV dec'\ depending on the solution compositions) observed at potentials less negative than ~ -0.8
V, corresponds to the reduction ofadsorbed AuCN (reactions [1.15] and [1.16]), while the
smaller one (about 110 to 150 mV dec'1), observed at more possitive potentials, corresponds to the direct reduction of Au(CN)2". The cathodic charge-transfer coefi&cient ac equals 0.4
according to Survila (39), 0.5 according to Harrison and Thompson (35), and 0.7 according
to Cheh and Sard (47). The exchange current density jo equals 0.82 mA cm and the standard rate constant, ks, for Au(CN)2' electroreduction is 3.9xl0'3 cm see'1 (47). The activation
energy of the whole process equals to 59.5 kJ mol'1 according to Beltowska-Brzezinska and
Dutkiewicz (36).
In phosphate solution, a well-defined limiting current density is observed. However, no direct experimental information on the magnitude ofy'o for this system can be obtained since it was not possible to measure the equilibrium potential, presumably due to a change in the
concentration of free CN' in the solution during deposition. It was found (47) that the Tafel
slope is 0.101 V dec'1, corresponding to a value of ac = 0.65, and ks = 6 x 10 cm see . The
activation energy of gold deposition from phosphate electrolyte was measured by
Kublanovsky et al. (46), its value confirms that the process of gold deposition is limited by the
electron transfer.
Polarization curves of citrate gold plating solutions containing KAu(CN)2, citric and KOH
were obtained by Taran et al. (48). No limiting current was observed in acid medium. This was attributed to the onset of hydrogen evolution before reaching mass transfer limitations for
gold deposition. Similar behavior was observed by Cheh and Sard (47) by means of a rotating
disk electrode. No kinetic parameters for this system are available in the literature.
The electrochemical reduction of Au(CN)2' is a slow process, which requires high overpotentials. It was found that the process of gold deposition can be influenced by foreign
metal ions added to the electrolyte (38,40,42,43). The depolarization effects ofPb, Tl, Bi and
Hg on gold deposition were observed by Mclntyre and Peck (42). A large catalytic effect of
Sb was found by Davidovic and Adzic (43), this was explained by its influence on the
adsorption of CN' containing species. Adsorption of Sb results in a decrease of the
self-inhibition of the deposition reaction caused by the adsoqrtion ofcyanide species. The effect of
base metal ions on the electrochemical behavior ofAu(CN)2'was studied by Bindra et al. (40).
They established the undeqiotential deposition (UPD) of Pb and Tl on gold substrate, which
leads to the depolarization effect. It was found that Ni and Co cannot undergo the UPD on gold substrate, however, they form a continous solid alloy in the hard gold deposition.
The mechanism of nucleation and crystal growth plays an important role on the surface
morphology and structure of deposits. The final grain structure of the deposited film is
governed by the interplay of nucleation, crystal growth, grain coarsening and film thickening. Few works were carried out to correlate the mechanism of gold deposition in the initial stages with the composition of solution, metal additives, the nature ofsubstrate, etc. (38,43,48). The
only work done by Davidovic and Adzic (43) was attempted to explain the electrochemical
behavior ofAu(CN)2' in phosphate electrolyte by analyzing the current-time transients in view
of the theory ofnucleation and crystal growth. They found that the nucleation ofAu changes from instantaneous in the absence of additive Sb into progressive in its presence. However, they were unable to explain the whole transient behavior, in which a minimum, maximum and steady-state observed on a current-time transients were potential-dependent. The mechanism of nucleation and crystal growth of gold deposition on semiconductors was also studied
qualitatively by Jacobs and Rikken (49) with simple discussion in view of nucleation theory.
The mechanism of gold deposition from chloride solution was studied by Harrison et al. (50)
by analysing current-time curves using nucleation and crystal growth model. No work dealing
quantitatively with the phenomenon of nucleation and crystal growth of gold deposition was
done in the citrate-bufFer acid gold solutions.
1.4 Microstructure of deposits and inclusions in the deposit
1.4.1 Microstructure of deposit
A microstructural observation may provide a better insight into the growth and mechanical properties of gold deposits. Various techniques such as scanning electron microscopy (SEM),
to characterize gold deposits from various solutions including many proprietary baths (16-21,38,40,43,47,51-62).
The moq^hology of gold deposits depends strongly on the solution composition, temperature, current density or potential applied, agitation, the nature of substrate, etc. Chech and Sard
(47) studied the morphology of gold deposits from alkaline cyanide, citric acid, and phosphate
electrolytes, respectively. The initial stage of gold deposition is rather complex and consists of a substrate-dominated stage which results in an epitaxial layer of several hundred angstroms thick, followed by another stage where three dimensional growth occurs. At the beginning of this stage, which is controlled by the deposition conditions, structural defects such as twin faults and grain boundaries in the epitaxial layer act as preferential sites for nucleation. The nucleation and initial growth of pulse-plated and direct current-plated gold on crystalline copper and amoq^hous electroless nickel substrates in citric acid solution was studied by
Holmbom and Jacobson using SEM and XRD techniques (57). The growth of gold on
crystalline Cu-substrate was found initially strongly substrate-dependent, and it gradually turned from substrate-controlled to transport-controlled growth resulting in a moqAological change.
The metallic additives have a profound effect on the grain size and its distribution, as studied
by Bindra et al. using SEM and TEM (40). The grain size was observed to increase in the
order: Co, Ni, no additives, Tl and Pb. They found that the grain growth in the cases ofNi, Tl
and no additives is partially inhibited because the grain size distribution was bimodal. By
contrast, in the cases of Pb and Co, the grain structure is uniformly large and small,
respectively, showing the absence of inhibition ofrecrystallization in the case ofPb and almost
total inhibition in the case of Co. The grain growth occurring in the deposition is accompanied
by a change in the orientation distribution of the grains. An extremely strong (100) texture
was observed for Au-Tl and Au-Pb systems, while in Au-Ni or Au-Co systems, the number of
distribution of grain orientations. It was also observed that increasing the concentration of the
grain growth-inhibiting additive (Ni and Co) drives the orientation distribution toward a more
random behavior. The voids/ bubbles in Co-Au and Ni-Au films, plus the grain size effect
together result in hard gold, while the large grain size and absence of hardening from bubbles
and voids in the Pb/ Tl cases give soft gold.
The influence of organic additives on the orientation and property of gold plating in citric acid
solution was studied by Un et al. (59). It was shown that the growth of the (111) facets in
gold plating predominates at lower temperatures and higher current densities. The addition of sodium laurysulfate, decylamine, and dodecylamine to the bath were found to suppress the
growth of the (11 1) facets. The decylamine and dodecylamine enhance the growth of (220)
and (311) facets and result in a decrease of the microhardness of the deposits.
Nakahara (61) studied the growth morphology of hard gold electrodeposits from a proprietary
bath (Autronex CI) which is composed of a gold cyanide salt, citric acid as the buffer, and a
cobalt salt as the hardening-brightening agent. The growth form described as "rounded mound" structure in hard gold deposits was observed by SEM. It was found by TEM that such rounded mounds are made of extremely fine (-200 A) grains and their surfaces are preferentially bounded by the cross-packed planes, i.e., (111). It was shown that the formation of the rounded mound structure is promoted by the adsoq)tion and subsequent incoq)oration ofnon-metallic molecules which act as growth inhibitors.
The structural aspects of gold deposits produced using high speed selective jet plating from a
commercial proprietary bath (Ronovel N bath) was recently studied by Booking and Dineen
using XRD and SEM (62), and a preferential orientation in gold deposits was observed.
1.4.2 Inclusions in gold deposits
For many years, it is well known (51-53,55,63-71) that carbonaceous inclusions exist in gold plates, moreover, impurities containing nitrogen, oxygen, hydrogen and potassium are also
frequently involved. The neutral and alkaline cyanide solutions provided the deposits with the
highest purity 99.6+ and 99.5+ %, respectively, but no coating from any of the electrolytes
evaluated was 100 % pure. The codeposition of an organic film during gold plating has been
under study since 1966, when gold plated telephone contact springs were visibly contaminated
with an orange-brown organic film after plating from an acid hard gold bath. The historically
most important work in this area is perhaps that of Munier published in 1967 (63), who
discovered the inclusions of as much as 0.1-0.3 % carbon not only on the surface but within the gold deposit, and isolated the carbon-containing inclusions so called "polymer". Many investigators have since expended efforts to identify the "polymer" and to understand the role played by such inclusions. Various opinions (52,63,64,67,68) on the mechanism, structure and
formation of polymer in gold deposition triggered an analysis of coating containing different
percent ofpolymer. Without at least 0.1 % carbon in gold deposits, it has been proved that the
coating will not be bright. It was also shown (71) that the carbon in polymer originated from
the cyanide ligand, and the amount of "polymer" was increased with codeposited hardener
(usually Co or Ni). As more investigative work proceeded the original polymer, initially
thought to be a contaminant harmful to the performance of gold deposits, turned out to be somewhat advantageous (64).
The inclusions or "polymer" in gold deposits were identified using various techniques (68)
such as elemental analysis, Mossbauer spectroscopy, chemical analysis, Auger spectroscopy and radiation analysis, electron diffraction analysis, etc. Carbon and nitrogen was found in the
form of cyanide complex in the film (68). It was shown that the dominating cyanide
compound in pure gold films and hard gold films is AuCN (65,68,71,72). In addition to AuCN
species, KCo(Au(CN)2)3 in hard gold films was found by Eisenmann (74). The structure of
AuCN is known to be polymeric with infinite linear chains arranged in parallel (75,76);
—Au—CN—Au—CN—Au—CN—Au—CN—Au—
—Au—CN—Au—CN—Au—CN—Au—CN—Au
and the size of AuCN crystallites in gold deposits film was found to be 25-30 A (65).
Inclusions in hard gold films as revealed by TEM (55) are homogeneously distributed in the
deposit. They act as preferential sites for nucleation leading to a fine grain size and thus high
hardness.
Deposit properties which are essential for electrical contact application include sliding wear
resistance and electrical contact resistance. Both properties are directly or indirectly affected by inclusions. To obtain good wear resistance, high hardness and low ductility are both
necessary. It was found (68) that both high hardness and low ductility of Co hardened gold
deposits can be attributed to the inclusions of impurities because they inhibit the growth of
gold crystals during the deposition and hence increase nucleation rate which leads to grain
refining and, therefore, high hardness and low ductility. It was also shown (77) that hardness
of additive free-hard gold is directly related to its carbon content.
CHAPTER 2
THEORY OF NUCLEATION AND CRYSTAL GROWTH
2.1 Introduction
The electrocrystallization of metals, i.e., deposition of metals at solid electrodes has a specific character, which is connected with the kinetics of new phase formation. Its driving force, the electrochemical free energy, is determined by the oveq)otential applied to the system. An increase of current is initially observed when overpotential is imposed on the substrate undergoing deposition. This rise in current can be inteq)reted in view ofnucleation and crystal growth. Information on the kinetics of electrocrystallization may be obtained by analyzing the current-time transient, whose shape is mainly determined by a particular nucleation and growth mechanism involved. Before describing various nucleation and growth models, first, it is necessary to outline the main theoretical concepts used in the analysis of such a phenomenon.
2.2 Nucleation and crystal growth
2.2.1 Theory of electronucleation
Metal electrocrystallization on a foreign substrate usually starts with the formation of nuclei on certain active sites of the substrate, followed by crystal growth. The nucleus is a cluster of atoms. If nuclei are smaller than the size of the critical nucleus, which is a function of the excess energy, they are unstable and dissolve spontaneously; if their dimensions exceed the critical nuclei, they begin to grow spontaneously. Their formation requires a sufficiently large fluctuation of the variables of state of the system or the presence of sites at the interface at which nuclei can be formed with overall decrease in the surface energy. The nuclei which have