Publisher’s version / Version de l'éditeur:
Canadian Geotechnical Journal, 6, 2, pp. 139-157, 1969-03-01
READ THESE TERMS AND CONDITIONS CAREFULLY BEFORE USING THIS WEBSITE.
https://nrc-publications.canada.ca/eng/copyright
Vous avez des questions? Nous pouvons vous aider. Pour communiquer directement avec un auteur, consultez la
première page de la revue dans laquelle son article a été publié afin de trouver ses coordonnées. Si vous n’arrivez pas à les repérer, communiquez avec nous à [email protected].
Questions? Contact the NRC Publications Archive team at
[email protected]. If you wish to email the authors directly, please see the first page of the publication for their contact information.
NRC Publications Archive
Archives des publications du CNRC
This publication could be one of several versions: author’s original, accepted manuscript or the publisher’s version. / La version de cette publication peut être l’une des suivantes : la version prépublication de l’auteur, la version acceptée du manuscrit ou la version de l’éditeur.
Access and use of this website and the material on it are subject to the Terms and Conditions set forth at
Dykes on permafrost, Kelsey Generating Station, Manitoba
Johnston, G. H.
https://publications-cnrc.canada.ca/fra/droits
L’accès à ce site Web et l’utilisation de son contenu sont assujettis aux conditions présentées dans le site LISEZ CES CONDITIONS ATTENTIVEMENT AVANT D’UTILISER CE SITE WEB.
NRC Publications Record / Notice d'Archives des publications de CNRC:
https://nrc-publications.canada.ca/eng/view/object/?id=14e78a34-7574-4ae4-b8ac-c7bd80d47205 https://publications-cnrc.canada.ca/fra/voir/objet/?id=14e78a34-7574-4ae4-b8ac-c7bd80d47205
DYKES ON PERMAFROST, KELSEY GENERATING STATION,
MANITOBA',2
G. M. JOHNSTON Northern Research Group, Soil iMecAnnics Section, Division of Building Research, National Researclz Council of Canndu, Ottatoa, Canacla
Performance studies of two major, but relatively small (2000-ft (-610 m ) long, maximum height 20 ft (6.1 111) ), sand
dykes constructed on ~ e r e n n i a l l ~ frozen ground were initiated in 1958 at the Kelsey Generating Station of Manitoba Hydro on the Nelson River. Permafrost occurred under these dykes in scattered islands or ~ a t c h e s of variable thickness and size.
Preliminary analyses, though only ap- proximate, indicated that within a 50- year period significant thawing would occur beneath the dyke-water interface and that the permafrost under the reser- voir would thaw completely. Ground settlenlents of as much as 6 f t (1.8 m ) were to be expected as thawing took place. To check the estimated perfor- mance, field instrumentation was installed and an observational program begun in 1959.
A distinct pattern of thawing and settlement each year has been observed. Major thawing and settlement occur during the sumnler months at rates that are greater than those experienced during the winter. The change in rate of thaw (and thus also the rate of settlement, which is partly a function of thawing) is directly connected with the change in water temperature or rate of heat flow into the ground.
Des Ctudes du comportement des deux digues importantes, bien que de dimensions r6duites (2,000 pi. de long, 20 pi. de hauteur maxi- mum), construites sur un sol constamment ge16, ont 6tC entreprises en 1958 Q la station Kelsey de 1'Hyro-Manitoba sur la rivikre Nelson. Le Permafrost sous les digues se prCsentait sous fonne d'ilots disperses ou d e lentilles de dimen- sions et d'6paisseur variable. Des Ctudes prC- liniinaires, bien que triis approximatives, avaient montrC qu'un , d6gel important se produirait
clans un Criode de 50 ans au dessous du con- tact eau-gigue et que le permafrost dispraitrait complktement sous le rkservoir. Des tassements pouvant atteindre 6 pieds devaient Btre envi- sag& pendant la pCriode de dCgel. Afin d e vCrifier ces valeurs estim6es les ouvrages ont 6tC instrurnentbs et un programme d'observa- tion a commcncC en 1959. Un schCma de dCgel et de tassement cliffkrent a 6tC ol~serv6 chaque annCe. L'essentiel du dCgel et du tassement se produit durant les mois d'6tC Q des vitesses supCrieures A celles mesurkes durant l'hiver. Le changement clans la vitesse de dCgel (donc aussi dans la vitesse de tasscment, qui est par- tielle~nent une fonction du d6gel) est directe- ment fonction d u changement de temp6rat11re d e l'eau, ou du dCp6t d e chaleur vers le sol.
INTRODUCTION
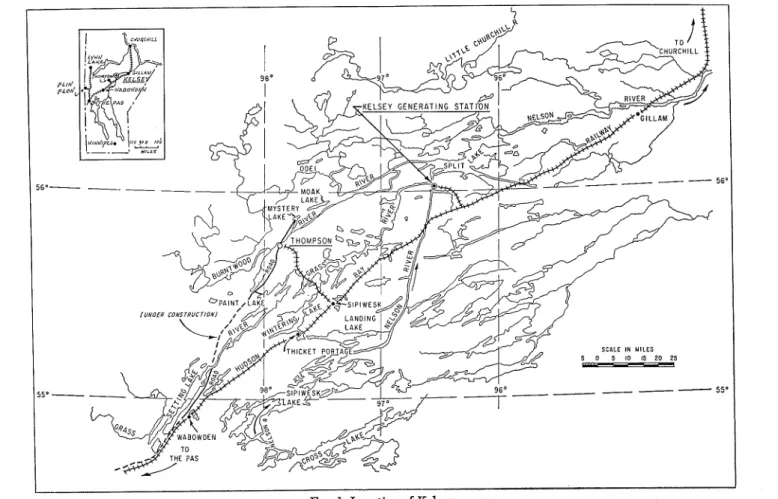
Manitoba Hydro's Kelsey Generating Station is located in the southern fringe area of the permafrost region of Canada on the Nelson River about 425 miles
INRCC No. 10611.
2Presented at the 21st Canadian Soil Mechanics Conference, Winnipeg, Manitoba, Septem- ber 12-13, 1968.
JOHNSTON: DYKES ON PERMAFROST, MANITOBA 141
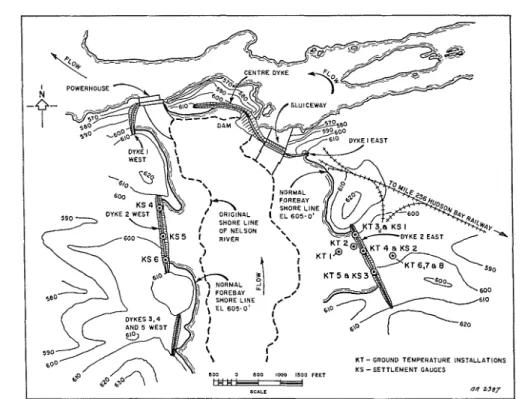
FIG. 2 . Site plan showing location of ground temperature and settlement gauge installations.
(684 km) north of Winnipeg and 53 miles (85 km) northeast of Thompson in northern Manitoba (Fig. 1 ) . Construction of the station began in June 1957 and was completed by the fall of 1960. Design and construction aspects of the project and problems encountered have been described in detail ( MacDonald
et al. 1960).
Several relatively small dykes were required to enclose the reservoir. The design and construction of two of the major dykes, East and West Dykes No. 2 (Fig. 2 ) were influenced greatly by the presence of permafrost.
The performance of these two dykes, each about 2000 ft ( ~ 6 1 0 m ) long and with maximum heights of 20 ft (6.1 m ) , was of special concern because loss of strength due to thawing of the underlying ice-laden perennially frozen soils when flooded could cause failure of the foundation. The design selected and the construction procedures for these dykes have been described by MacDonald
et al. (1960) and MacDonald (1963). Briefly, ,the dykes consist of a compacted sand fill constructed during the winter on a foundation of perennially frozen varved clay that is stabilized during thawing by a drainage system of sand piles.
The construction of these dykes provided an opportunity to study the thawing effect of water on permafrost. Following discussions between the Division of Building Research, National Research Council of Canada and Manitoba Hydro (then the Manitoba Hydro-Electric Board) and their consultants, H. G. Acres & Co. Ltd., a research program was undertaken at the site in which the Division of Building Research and Manitoba Hydro are jointly participating. Instru- mentation, designed and fabricated by the Division, was installed during 1958
TABLE I
Monthly average of daily mean air temperature (OF), Kelsey Generating Station, Manitoba
2
2
Jan. Feb. Mar. April May June July Aug. Sept. Oct. Nov. Dec. Year
8
z 1957 65.4 59.3 50.2 38.9 13.9 - 6 . 7 1958 -7.7 -10.1 1 3 . 3 28.3 41.7 49.9 60.2 54.9 48.5 37.1 15.0 -14.3 26.4
8
1959 -17.0 -9.9 6 . 7 1 8 . 3 37.0 51.7 62.7 56.2 47.6 25.9 3 . 2 4 . 7 23.9 Fj 1960 -10.4 - 2 . 3 1 . 0 22.0 44.9 57.0 63.3 59.9 46.3 32.5 5 . 7 -5.2 26.2 1961 -15.1 -5.2 5.2 43.1 30.5 14.1 -10.3 1962 -20.7 -17.5 6 . 9 1 8 . 0 36.0 58.3 60.5 57.1 47.1 36.7 9 . 2 -10.1 23.55
1963 -22.2 -12.1 - 3 . 3 26.9 37.4 56.4 65.4 61.1 46.6 45.1 14.2 -7.5 25.7 r Mean (9 "ears) = 24.4 L'JOHNSTON: DYKES O N PERMAFROST, M A N I T O D A 143
and 1059 to measure ground temperatures under East Dyke No. 2 and the adjacent forebay and to measure settlements of the dyke and foundation. Studies were concentrated on East Dyke NO. 2 because more detailed informa- tion was available on subsurface conditions as compared t o the other dykes. The scope of the research program and details of the instrumentation have been described previously (Johnston 1965).
The results of observations made to the end of 1967 at East Dyke No. 2 are presented in this paper.
SITE DESCRIPTION
The regional and local geology, topography, climate, and terrain conditions have been described in some detail (MacDonald c?t al. 1960; MacDonald 1963; Johnston 1965; Johnston et nl. 1963). Geologically, the Kelsey site is located in the Precambrian Shield near the nol-thern boundary of an area that was covered by glacial Lake Agassiz. In general, the present topography is that of an almost flat to gently rolling plateau-like surface. Formation of a new surface drainage system since glaciation has been progressing slowly and is still highly dis- organized. The area contains innumerable lakes, rivers, and swampy areas.
Climate
The climate is continental in character, with long cold winters and short warm summers. Air temperatures have been measured daily at Kelsey since July 1957 and, with the exception of the period April to August 1961 inclusive, for which only partial records are available, fairly complete records have been obtained. Monthly averages of daily mean air temperatures are listed in Table
I. The mean annual air temperature at Kelscy, computed for the nine years of complete records, is 24.4 OF.
Average values for the freezing and thawing indices computed from the air temperature records taken at Kelsey ( 9 years) are 5986 degree-days and 3301 degree-days respectively. Maximum nlld minimum values of the freezing index during this period are 7097 ( 1966-67), and 4954 ( 1 9 5 7 3 8 ) degree-days; and for the thawing index are 3744 (1963) and 2904 (1965) degree-days. The frost-free period at Kelsey each summer is about 105 days, from early June to mid September.
Precipitation records for Kelsey are incomplete, but from observations made in the general region (Wabowden, Gillam, and Thompson) the mean annual precipitation is about 16 in. ( ~ 4 1 c m ) , of which approximately 5 in. ( -.13 cm) occur as snow ( 10 in. snow = 1 in. water).
SoiE and Pe~*nznfrost
An organic mantle of living moss and peat, from 1 to 3 ft (3-1 m ) or more thick, covers the mineral soils at Kelsey, which are predominantly lacustrine, valved clays. The varved materials, which generally become less plastic and more silty with depth, may exceed 25 ft (7.6 m ) in thickness. These deposits overlie bedrock or thinly stratified glacial drift composed predominantly of sandy gravel or medium to coarse sand from 0 to 20 ft (0-6.1 m ) thick. The total thickness of overburden may vary from a few feet to more than 50 ft
(
>
15 m ) , the greater thicknesses occurring in depressions in the very irregular144 CANADIAN GEOTECHNICAL JOURNAL
Permafrost was encountered extensively over the site, occurring as islands or patches of frozen ground which were variable in thickness and areal extent. At some locations permafrost was found in the varved clays and drift to depths as great as 35 ft (10.6 m ) , and occasionally was noted in bedrock. Extensive ice segregation was found in all perennially frozen varved clays, generally in the form of horizontal lenses varying in thickness from hairline to 8 in. (20 cm), but the predominant size range was from
&
to 1 in. (2-2.5 cm) thick. Spacing of lenses varied similarly. Ground temperature measurements made to date at Kelsey indicate that the mean ground temperature in undisturbed areas of permafrost to depths of 20 ft (6.1 m ) is about 31.0 to 31.5 OF.In addition to hand auger borings and some Shelby tube sampling along and adjacent to East Dyke No. 2, three holes (Nos. 682, 683, and 684) were drilled in March 1958 along the axis of this dyke to obtain undisturbed cores. A typical log (hole 682) is presented in Fig. 3. Permafrost distribution in the dyke foundation was logged when the sand drains were drilled. An indication of the variability of permafrost distribution can be noted in Fig. 4, which shows the occurrence of frozen ground on typical sections under East Dyke No. 2. The
drill holes, noted above, and the dyke instrumentation are located at the cross- sections shown.
DESIGN CONSIDERATIONS
It was expected that large differential settlements would occur because of the variable distribution of permafrost under the dykes, and critical foundation stability conditions might result due to the thawing of the frozen varved clay containing large ice inclusions. Upon thawing, large quantities of free water would be produced which, if not able to escape readily (sand drains were provided to facilitate drainage), could contribute to a foundation failure even though the dykes are relatively small. The stability of the foundation will depend upon a number of factors, including the rate at which thawing takes place, the rate and manner in .~vhich thaw water is redistributed or escapes, the loss in shear strength of the clay upon thawing, and the rate at which shear strength would increase as a result of consolidation of the clay. It is extremely difficult to predict the influence of the various factors because of the complexity of soil and pelmafrost conditions and characteristics and their interrelationships during and following the thawing process.
Preliminary calculations, based on conduction theory and assuming an impermeable dyke and foundation, a water temperature of 39 OF and a mean ground temperature of 31 OF, indicated that within a 50 year period the perma- frost under the reservoir would thaw completely and that thawing beneath the water-dyke interface could extend into and beneath the dyke for a distance of 40 ft (12 m ) . Initially, the rate of thawing might be in the order of 2 to 3 ft
(.6-.9 m ) per year. It was also estimated that it would take many hundreds of years for equilibrium conditions to be reestablished in the ground thermal regime.
A rigorous quantitative evaluation of the settlement and consolidation of the foundation soils was not possible, but it was estimated that total settlements, based primarily on the thickness of ice in the soil, would be of the order of 6 ft (1.8 m ) . Furthermore, it was anticipated, providing the free water result- ing from thawing of the ice inclusions was able to dissipate rapidly, that con- solidation would take place at a rate similar to thawing and that little loss of strength in the foundation would occur.
146 CANADIAN GEOTECHNICAL JOURNAL 6 9
+?
i?s'
ODCm X $G7
*.
L E G E N D 0 EXPLORATION BOREHOLE 0 THERMOCOUPLE C A B L E (KT1 + F R O S T I N D I C A T O R ( K F I-
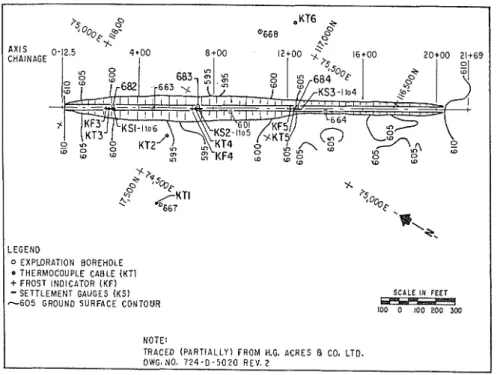
S E T T L E M E N T GAUGES ( K S I - 6 0 5 GROUND S U R F A C E CONTOUR 100 0 100 ZOO 300 NOTE: TRACED ( P A R T I A L L Y ) F R O M H.G. A C R E S 8 CO. LTD. DWG- NO. 7 2 4 - 0 - 5 0 2 0 REV. 2FIG. 5. Plan, East Dyke No. 2.
I t was of interest, therefore, to assess these predictions of the performance of the dykes by means of field observations. I t was not feasible to evaluate all factors, but it was thought that measurements of changes in the ground thermal regime and clyke movements would provide useful information.
FIELD INSTALLATIONS AND OBSERVATIONS
Theirnocouple cables were installed in the fall of 1958 to a depth of 20 ft
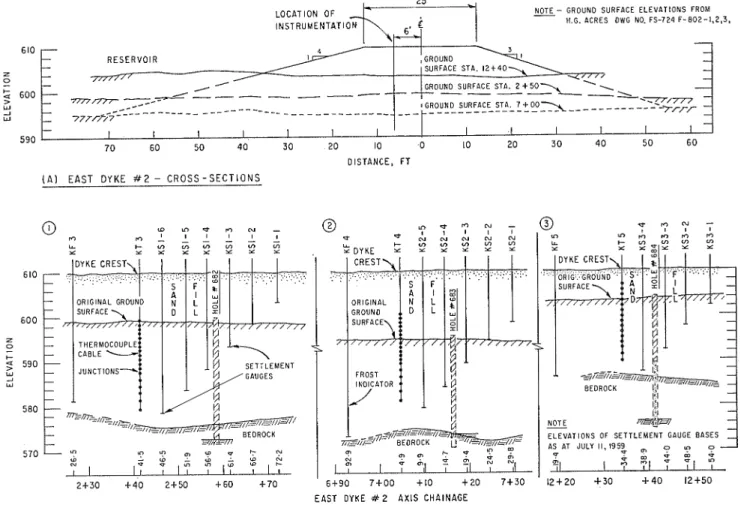
(6.1 m ) at two locations in the reservoir and three locations in an undisturbed area adjacent to East Dyke No. 2. I11 1959 thermocouple cables and settlement gauges were installed in the dyke and foundation at three locations underlain by permafrost where sample holes had been drilled and where the height of the dyke would be about 8, 12, and 16 ft (2.4, 3.6, and 4.8 m ) , and the depth of water would b e about 1, 6, and 10 ft (.3, 1.8, and 3 m ) , respectively. Frost indicators were placed in holes bored through the dyke at these locations during an exploration program carried out in 1963.
Details of all instrumentation have been given in a previous paper (Johnston 1965). The location of the thermocouples, settlement gauges, and frost indi- cators is shown in plan view and section in Figs. 5 and 6 respectively.
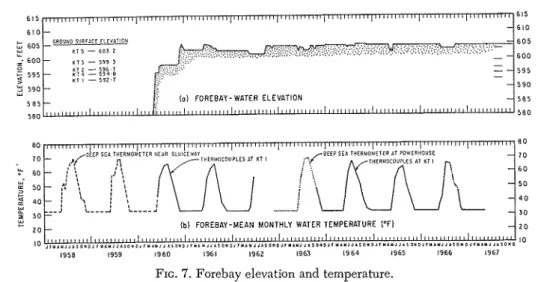
Forebay W a t e r Eleuation
The forebay was filled in stages beginning in May 1960. By July 1, 1960 it llad reached an elevation of about 598 ft (-182 m ) above sea level. 'Since November 1960 it has been maintained at an elevation behveen 603 and 605 ft (183.7-184.3 m ) , except for a few relatively short periods when it was dropped
0
( D L D U 1 0 N -10 1 0 I I I " I LL t 'n ' n‘ n‘ n ‘n ‘ n x x x x x Y x x JUNCTIONS- GAUGES BEDROCKLOCATION OF NOTE - GROUND SURFACE E L E V A T I O N S FROM
H.G. ACRES OWG NO. FS-724 F-802-l,2,3.
EAST DYKE # 2 AXIS CHAINAGE
( B ) E A S T D Y K E # 2
-
L O N G I T U D I N A L S E C T I O N SFIG. 6. Instrunlentation, East Dyke. No. 2.
610 Z 0 - t 2 6 0 0 W _I W 5 9 0
-
- RESERVOIR - - - - - - / - /.
-
-n- 7-rd-
-
-
-
-
-
-
-
- C - -,C'/m -- 7JjF /;---
_
--
- --
- - --
--
- -- - - - _ _ _ - _ _ - _ _ _ _ _ _ __ _ _
I GROUND SURFACE STA. 7 _ _ - _ - - - + 00- --- - -_
-- - - - rrrr-
-
-
- I I I I 1 1 --
1 I I I 1 I I 7 0 6 0 5 0 4 0 3 0 2 0 10 0 10 2 0 3 0 4 0 5 0 6 0 DISTANCE, FT ( A ) E A S T D Y K E # 2 - C R O S S - S E C T I O N S148 CANADIAN GEOTECHNICAL JOURNAL 605 ~ ~ o u a o sunricr r ~ r u r r i o ! ~ - 6 0 5 K T 5 - 603 2 ~ ~ : : : ~ : ~ ~ ~ ~ ~ f : : . ~ ~ $ ~ ~ . ~ . ~ ~ : ~ L ; 6 0 0 - K T , - 5 9 9 3 - - 6 0 0 0 K T 1
-
5 9 6 1 - IT., - 5 9 4 8 - - - 5 9 5'
5 9 5 - K T I - 592.7 I ", 590 - - 5 9 0 w5 8 5 - '? lo1 FOREBAY- WATER ELEVATION - 585 580 -~-llllilllllillllllll)11111111 , ~ 1 ~ 1 1 1 ~ 1 1 1 1 1 1 / ~ t 1 1 "11"""""11"""""' 5 8 0
I b l FOREBAY-MEAN MONTHLY WATER TEMPERATURE P F I
!:::::::::e,l::::w~::~:;d;yl::u~;;~~:;;;I1;;~::.':,
1958 1959 1960 1961 1962 1963 1964 1965 1966 1967 FIG. 7. Forebay elevation and temperature.
to about 601 ft (183.1 m ) at its lowest. The forebay water elevation is shown in Fig. 7a. Also indicated are the original ground surface elevations at the two instrumentation sites in the forebay near East Dyke No. 2 and the three sites on East Dyke No. 2.
Forebay W a t e r Temperature
Water temperatures have been measured periodically with a deep sea thermometer and also a special thermocouple cable installed in 1959 near East Dyke No. 2. Mean montllly bottom water temperature calculated from these observations are shown in Fig. 7b. A special recorder (Johnston 1966) was recently installed at the bottom of the forebay near East Dyke No. 2 to obtain a continuous record of water temperature. The observations made to date indicate that the mean annual bottom water temperature in the reservoir is between 42 and 43 O F .
It is of interest t o note that during the winter months, from approximately mid November to mid May, the bottom water temperature is just above 32 O F .
In addition, temperature measurements made occasionally at several depths during the winter from the ice cover show that the body of water is essentially isothermal. Temperatures tl~roughout the 10 to 12 f t (3-3.6 m ) depth of water at this location varied from about 32.2 t o 32.7 O F .
Ground surface temperatures measured at the cables in the forebay con£irm that the mean annual ground surface temperature under the water is about 42 O F . During the winter months the ground surface temperature is only
slightly above 32 OF; during the summer it warms to above 65 O F , reaching its
maximum usually in late July or early August.
Ice cover begins to form on the forebay near East Dyke No. 2 in late October or early November and reaches its maximum thickness of 3 to 33 ft (.9-1.1 m ) by April. The forebay is usually free of ice by late May or early June. A snow cover of from 1 to 1$ ft (.9-1.1 m ) usually accumulates on the ice as compared with 2 to 3 ft (.6-.9 m ) of snow in forested areas.
Ground Temperatures
Observations have usually been made at weekly or bimonthly intei-vals on
all
installations. Isothelms for one of the cables in the undisturbed area and forJOHNSTON: DYKES ON PERMAFROST, MANITOBA 149 saouso r u n f r c ~ 2 s 2 ,::: 2% w 0 " : : Z 2 2 " 2 0 I / / / I I / ... I ... ::::: >:< ,.;, ;..::: .:. ... >, .. ..
,,,
,,<,, ;L;,::::]:<i:::;$.:::&f:!<"G?i>.::
.: .. I:!-!.C:.;i;ic!:%
:::.:: ::. ..!>'ii..-
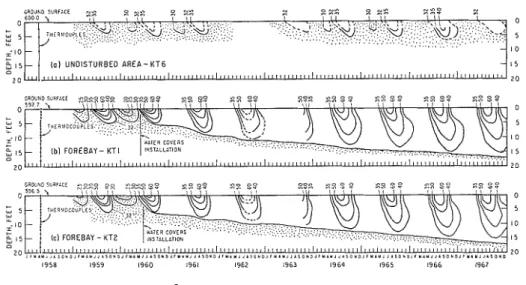
::.':. ... .,,; .... ... . . . . . . . :.;;:: ... ..:.. ... :: ..:: ....':.. ..:;:.::--.'::.:.';.&i;. ... v,.,: . . . ,.:::;.., ~:;:j::i:~;,.:\~);~:,..~:..;;~; ... . . . ...FIG. 8. Ground temperatures, undisturbed area and forebay.
the two ground temperature installations in the forebay are shown in Fig. 8 and for the three cables in East Dyke No. 2 in Fig. 9. Data obtained from frost indicator observations have been included, mainly to indicate depth of seasonal frost penetration in the dyke, but also to complement temperature measure- ments at depth.
(a) Undkturbed Area
For the undisturbed area it was not possible to draw all isotherms (Fig. 8 a ) because of the wide spacing of thermocouples. The average maximum depth of thaw is between 4 ft ( 1.2 m ) and 5 ft ( 1.5 m ) , and is reached in late September or early October each year. Snow cover varies but has a maximum depth of from 23 to 3 ft (.7-.9 m ) . As a result of vehicle travel around this area in recent years the vegetation and surface cover has been so severely damaged that the site can no longer be considered undisturbed.
(b) Forebay
When first installed in late 1958, the forebay cables were located in wooded areas. During the summer of 1959 the forebay was hand cleared of all brush and trees, but the moss cover around the installations was undisturbed. The forebay was flooded during 1960; the two cables were covered by water during June. From November 1960, when the final rise to approximate operat- ing level occurred, the water depth at KT1 has been 10 to 12 ft (3-3.6 m ) and at KT2 has been 6 to 8 f t (1.8-2.4 m ) .
(c) East Dyke No. 2
All organic material was removed from the foundation of East Dyke No. 2
in March and December 1958. The sand drains were installed in Janualy and February 1959. The sand fill was placed between mid February and the end of March 1959. The active layer was completely frozen prior to construction because clearing and grubbing operations and snow removal allowed rapid penetration of frost. The dyke sand fill was probably completely frozen shortly after the fill was completed. Thermocouple cables were installed at the three
150 CANADIAN GEOTECHNICAL JOURNAL
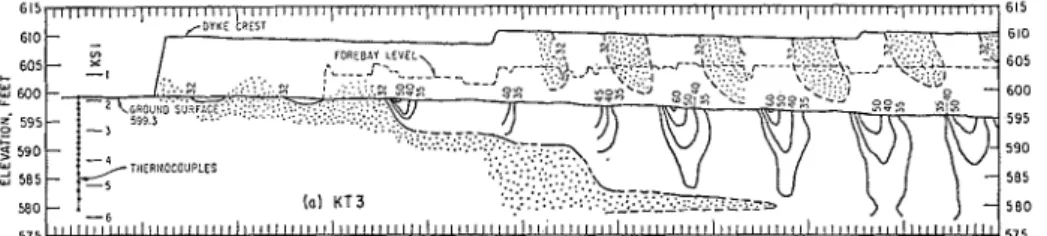
FIG. 9. Ground temperatures, East Dyke No. 2.
dyke locations in July 1959 and were offset 6 ft (1.8 m ) upstream from the dyke centerline.
Ground temperatures are measured to a depth of 20 ft (6.1 m ) below foun- dation surface near the north end of the dyke where the fill is approximately 12 ft (3.6 m ) . The forebay water did not impinge upon the dyke at this loca- tion until December 1960, and the ground thermal regime has been influenced by the water only from that date.
Temperatures are measured at the second location (about 16 ft (4.8 m ) fill) from a point 6 ft (1.8 m ) above grade to a depth of 14 ft (4.2 m ) below the foundation suiface. Water has been impounded by the dyke at this location from July 1, 1960.
At the third location, where the fill is approximately 8 ft (2.4 m ) high, tem- peratures are measured from a point in the fill 3 ft (1 m ) above foundation surface to a depth of 12 f t (3.6 m ) below grade. In the early years water was in contact with the dyke at this location only during December 1960 and from 1 June to 15 August, 1961. The forebay was raised to its operating level (between 604 and 605 ft (184-184.3 m ) ) in early October 1962, and except for very brief periods in 1963 and 1965, when it dropped slightly below 603 f t
(183.7 m ) , from 1 to 2 f;t (3-.6 m ) of water has been in contact with the dyke at this location.
The maximum thickness of ice cover on the forebay ranges from 3 to 34
ft
(1-1.1 m ) . Thus water is in contact with the dyke throughout the year at the location of cables KT3 and 4 in the dyke. At cable KT5, however, where the
JOHNSTON: DYKES ON PERMAFROST, MANITOBA 151
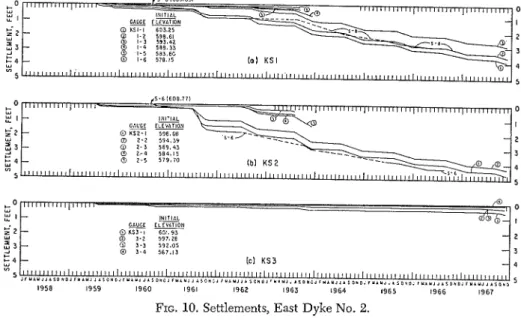
FIG. 10. Settlements, East Dyke No. 2 .
,,,,
II,./-5-61600.771
maximum water depth is only 1 to 2 ft (3-.6 m ) , the forebay freezes to the ground surface for a period each winter.
,- u e l - $-2 u 4 3 -
:
4 07 Dyke SettlementsSettlement gauges (KS series) were installed in July 1959 to measure move- ments at about 5-ft (1.5 m ) intervals in the dyke fill and foundation at the three main instrumentation sections on East Dyke No. 2. Details of the gauges and their installation are given in Johnston ( 1965). Their locations in the dyke are shown in plan in Fig. 5 and in section in Fig. 6. All settlement gauges were placed on a line offset 6 ft (1.8 m ) upstream from the centerline of the dyke so that they would not intersect the sand piles drilled in the foundation.
In addition to these gauges, settlement points (S series) were also placed along the downstream shoulder of the dyke crest at about 250-ft (-76 m ) intervals. These points consist of brass plugs set into boulders about 3 ft ( 1 m ) in diameter and were installed a few inches below the dyke surface.
Level surveys have been made approximately once a month on the settle- ment gauges. Curves showing movements experienced by each gauge in the fill and foundation are shown in Fig. 10. Also plotted are cuives for the dyke crest points S-8 and S-6, which are located adjacent to gauges KS1 and 2 respectively. Surveys on the dyke crest points were not begun until mid-1960, i.e. more than a year following construction, and therefore do not indicate the maximum settlement that has been experienced by the crest.
Several of the KS series of gauges ceased to function properly after about
4 years. Settlements measured by those gauges, which indicated movement greater in magnitude than actually occurred, have not been included.
- -
-
C3KSZ-I 598,GO m 2 - 2 5 9 4 . 3 9 0 2 - 3 5 8 9 . 4 3 Q 2 - 4 5 8 4 . l 5 0 2 - 5 5 7 9 , 7 0 - ~ . I ~ v ~ I I " I ' ~ ~ I ' I I I I ' I I ' I ' , DISCUSSION OF RESULTSGround Thermal Regime
Permafrost exists as a result of a thermal condition where the ground tempera- ture does not rise above 32 OF. The ground temperature pattern is complicated, varying with depth from the surface and with time, and fluctuates in response
152 CANADIAN GEOTECHNICAL JOURNAL
to the heat losses and heat gains at the ground surface. If a relatively large change in the balance between annual heat losses and heat gains is created then a local permafrost condition may be destroyed (or created).
Such a situation has occurred at Kelsey where, because of flooding, an en- tirely new and warmer temperature environment has been suddenly imposed on the ground surface. The heat exchange at the ground surface.has been radically altered and the ground thermal regime must therefore adjust to the new temperature environment. Under natural conditions the mean annual ground surface temperature in permafrost areas at Kelsey, deduced from ground temperature measurements, is about 31 OF. An annual amplitude of about 40°, ranging from 20 to 60 OF, was indicated by temperatures measured at the installations in the undisturbed area and in the forebay prior to filling of the reservoir. The average annual maximum depth of thaw was about 5 f t ( 1 . 5 m ) .
By mid June 1960, when water first covered the two forebay temperature cables, thawing due to natural conditions had taken place to a depth of about
2 ft (.6 m ) . From that date the mean annual ground surface temperature imposed by the water has been about 42 OF, i.e. an increase of approximately 11 OF. The annual amplitude of ground surface temperature under this new condition is about 303S0, ranging from slightly above 32 OF to 65 O F .
Thawing under the forebay following submergence in 1960, is clearly shown by the isotherms in Fig. 8. The rate of thaw varies during the year from mid- 1960 until it reaches a depth of about 10 ft (-3 m ) during 1962. The thaw rate within the top 10 ft ( 3 m ) is influenced directly by fluctuations in the ground surface temperature (water temperature); the thaw rate, in general, decreases during the winter period of cool water temperatures and increases during the summer. Below 10 ft ( 3 m ) the influence of annual fluctuations in the water temperature on the 32 OF ground isotherm becomes less evident and is essentially damped out.
Changes in the ground thermal regime, as it adjusts to the newly imposed surface conditions, are clearly indicated by the temperature isotherms. For example, at the 10 ft ( 3 m ) depth, the annual fluctuation in ground temper- ature prior to disturbance was only a few tenths of a degree. By the end of 1967, the annual fluctuation in temperature at this depth had increased to more than 7" (from about 33 to 40 OF).
At East Dyke No. 2, the situation is more complex than under the forebay because of the more complicated boundary conditions. Temperatures in and under the dyke are affected not oilly by t l ~ e standing water, but also by the natural climatic environment which is in contact with the top and downstream slope of the dyke. In addition, the dyke fill and the seepage of water through it introduces further complications when one attempts to analyze the thawing effect in the foundation. Settlement of the foundation and removal of thaw water or penetration of forebay water through the sand drains and the erratic occurrence of unfrozen areas under the dyke also influence thawing.
The flow of water through the previous dyke fill is probably complex. It is assumed that no underseepage occurs in the highly impervious varved clay foundation. The forebay is maintained at an elevation of about 604 ft (184 m ) . Seasonal frost penetration in the dyke is several feet below this elevation ( Fig. 9 ) , but there is some flow through the dyke at these locations all year round. This has been confirmed visually at the site where seepage has been observed during the winter under the snow at the downstream toe.
JOHNSTON: DYKES ON PEMAFROST, MANITOBA 153
The foundation surface temperature at cables KT3 and KT4 is above freezing throughout the year and the annual variation is approximately the same at each, ranging from about 33 to 60 OF. The mean annual sulface temperature at these locations is apparently only slightly less than that under the forebay.
At thermocouple location KT3 water did not contact the dyke until late November 1960. Following construction but prior to flooding, the dyke fill froze completely each winter, but thawing occurred to a depth of 1 ft ( . 3 m ) into the foundation each summer (1959 and 1960). As shown by the tempera- ture isotherms, thawing of the foundation began in 1961 and proceeded at an irregular rate such that by mid 1965 all permafrost had been thawed. I t is of interest to note that thawing also took place from the bottom. It is suspected that the rather irregular thaw pattern occurred because the cable may have been near the edge of an 'island' of frozen ground, and therefore thawing occurred not only from the top but also from the sides. In addition, because sand drains at this location penetrated the sandy, gravelly till underlying the frozen varved materials, percolating water could have a significant influence upon thawing from below.
In 1959 at the second cable (KT4) the fill was completely frozen for its full depth following construction and did not thaw completely during that summer. Water came in contact with the dyke in this location in June 1960, but apparently did not significantly affect the ground thermal regime until mid 1961, when thawing of the foundation began.
The situation at the third location (Fig. 9 ) is not as clear. Prior to October 1962, with the exception of short periods in late 1960 and mid 1961, no water was in contact with the dyke at this point. From that date, the water depth has been 1 to 2 ft (3-.6 m ) . In the 3 years following construction, before flooding, it is evident that the ground thelmal regime is warming in response to the new surface condition imposed by the dyke fill alone. The warming trend is accelerated when flooding occurs until finally, in 1966, a completely thawed zone remained throughout the year. Prior to that, the dyke and foundation had completely refrozen each winter.
The shallow water at this location freezes completely each winter. Prior to 1966, when the dyke and foundation were completely frozen, no water flow through the dyke could occur during the winter. As thawing continues and ground settlements occur it can be expected that the situation will change. The ground surface temperature has been changing constantly (warming) follow- ing construction of the dyke, and it appears that it will rapidly approach a value
a ions. similar to that experienced at the other dyke loc t '
At the three locations in the dyke, because water is able to seep through the pervious material of which it is constructed, thawing of the foundation follows a pattern similar to that experienced under the reservoir. At the near surface depths, the rate of thaw each year fluctuates in response to the annual cycle experienced by the water temperature. The rate of thaw is markedly reduced during the winter period when the ground surface temperature is just above 32 OF. A significant increase in the thaw rate occurs during the summer months. Once depths of about 10 feet ( 3 m ) are reached the cyclical effect is essen- tially damped. The transient condition of the ground thermal regime as it adjusts to the newly imposed environment is well expressed by the tempera- ture isotherms for the three locations in the dyke.
Considerable variation in thaw rate is apparent depending on the local con- ditions and situation. In general, however, thawing during the initial 2 or 3
154 CANADIAN GEOTECHNICAL JOURPJAL
years, both in the reservoir and under the dyke, seems to occur at a rate of about 5 to 6 ft (1.5-1.8 m) per year, after which it proceeds at 2 to 3 ft (.6-
.9 m ) per year, apparently decreasing with time.
Dyke Movements
The crest of East Dyke No. 2 was constructed in 1959 to an. elevation of 610 ft (185.8 m ) except for a 150 ft (45.7 m ) long section near the south end, which was built to elevation 611 (186.1 m ) . Differential settlements repre- sented by local depressions, have occurred each year along the dyke, giving the crest a 'roller-coaster' effect. Substantial (as much as 5 ft (1.5 m ) ) localized settlements had occurred by June 1962 and a general raising of the dyke crest to elevation 611 ft (186.1 m ) was carried out that summer. Fill was again placed in 1964 and 1966 to bring depressions in the dyke crest to an elevation of at least 610 ft (185.8 m ) , i.e. 5 ft (1.5 m ) above forebay level. Some remedial work was carried out in intervening years to repair small local sags.
Maximum settlements of nearly 7 ft (-. 2.1 m ) have been experienced by the dyke crest to date. These have occurred at points between the instrumented sections, and a continuous record of settlement at these locations has not been obtained. Some longitudinal cracks in the crest and dish-shaped depressions on the downstream slope have occurred and are mainly associated with those locations experiencing the larger movements. Similar localized depressions and sags have occurred on the upstream slope, but cannot be defined because they are covered by water. No transverse cracking has been observed. The largest longitudinal cracks, which are from 1 to 2 in. ( 2 . 5 5 cm) wide at the surface, appear to be only 2 to 3 ft (.6-.9 m ) deep and t o occur primarily in the granu- lar trafFic layer overlying the main sand core. A general view of East Dyke No. 2 is shown in Fig. 11.
JOHNSTON: DYKES ON PERMAFROST, MANITOBA 155
Similar movements have been experienced by West Dyke NO. 2. In June 1961, a localized depression (maximum depth of 5 ft (1.5 m ) ) occurred suddenly in the crest, extending down both upstream and downstream slopes. This was repaired temporarily at the time, followed by a major maintenance program in 1962. Further repairs have been made to both East and West Dykes No. 2 as required.
Appreciable settlements of the fill and foundation have been measured at two of the insbmented locations in East Dyke No. 2, as shown in Fig. 10. Total settlement of the foundation to the end of 1967 measured at these two locations (KS1 and KS2), where the fill is approximately 12 and 16 ft (3.64.8 m ) , has been about 3.5 ft ( 1 m ) and 5 ft (1.5 m ) respectively. At the third i n s b - mented location (KS3) where the fill is 8 ft (2.4 m ) , movements have been observed only recently and less 'chan 1 ft (.3 m ) of settlement has occurred to date. Unfortunately, because certain of the settlement gauges did not function as desired and the exact elevation of bedrock at the instrumented locations is not known, compression of individual soil layers or of the over-all foundation thickness cannot be determined with any degree of accuracy.
It is apparent from a comparison of the settlement curves and the penetra- tion of thaw in the foundation that, as is to be expected, major settlements begin shortly after thaw reaches the depth at which the gauge is positioned. All gauges indicate that some settlement occurs before thawing reaches the gauge- such can be attributed to the general softening of the soil, which occurs as the ice melts during thawing.
It is of interest to note that the rate of settlement follows a pattern similar to that observed for the rate of thaw. Settlement rates for part of the year are, in general, much less than those occurring during the remainder of a 12-month period and occur mainly during the late winter and early summer. They co- incide almost identically with the periods of different thaw rates. The settle- ment and thaw rate patterns differ, however, in that while fluctuations in the thaw rate are damped out fairly rapidly with increasing depth, changes in the rate of settlement during the year apparently continue each year in much the same manner for every depth. It is expected, of course, that in time, as settle- ment continues it will do so at a decreased rate and eventually the rapid move- ments now observed as a result of ice melting will be considerably reduced.
The total settlement of the dyke surface at a location underlain by thawing permafrost can be considered to result from the following causes:
( a ) escape of the water resulting from thawing of the large ice inclusions in the foundation;
( b ) compression of the thawed soil in the foundation; and ( c ) compression of the dyke sand fill.
Considerable differential settlement of the dyke, which was anticipated and has been observed, will occur not only because both unfrozen and frozen layers having different compression characteristics underlie the dyke, but also because of the variable nature of the ice content in the frozen soil itself.
The greater part of the total settlement experienced by the Kelsey dykes is due to thawing of the ice inclusions, which occur mainly as closely spaced horizontal lenses up to several inches thick. Some of the free water resulting from thawing of the ice may be absorbed by the soil layers between ice lenses as they would have been preconsolidated by the growth of ice lenses when permafrost formed. It is assumed that the varved materials have a greater
156 CANADIAN GEOTECHNICAL JOURNAL
permeability in the horizontal direction and that most of the free water has been expelled laterally to the sand drains. Because of the rather complex con- ditions existing as the thaw water is redistributed during and after thawing it is extremely difficult to determine the amount of settlement that has occurred to date due to consolidation of the soil layers.
Compaction of the sand fill during construction was accomplished by trac- tors which, although no measurements of density were made, resulted in a dense fill. Settlement due to compression of the fill, apparently is less than 0.5 ft
(
<
15 cm). Some of this, no doubt, is due to additional compaction resultingfrom the use of heavy equipment during the various periods of dyke repair carried out during the years.
CONCLUSIONS
The highly variable soil and permafrost conditions encountered at the Kelsey Generating Station posed difficult problems in the design and construction of two small dykes on permafrost. Nevertheless, field observations have confirmed generally the estimated changes in the ground tl~ermal regime and the magni- tude of settlements that were anticipated.
The dykes are perfo~ming as expected during thawing of the underlying ice-laden varved clay foundation. Several feet of differential and total settle- ments have occurred, but because of the flexible nature of the sand fill which allows it to adjust and accommodate these movements, together with addition of fill to the crest when required, the integrity of the dyke as a water-retaining structure has been maintained.
Serious problems of foundation instability have not been experienced. Apparently the large amount of free water released upon thawing has been able to dissipate in a manner and at a rate which, so far, has not been critical. Although it may be assumed that the sand drains are serving the purpose for which they were intended, it is not possible to assess accurately their contri- bution.
Obselvations of performance of the dykes are being continued at Kelsey. It is hoped that similar, but somewhat more detailed studies, which will include determination of the extent of thaw under a dyke and the contribution of sand drains to the dissipation of thaw water, as well as settlement and ground temperature observations, will be carried out at future developments in northern hllanitoba. Significant information to assist in the design and construc- tion of such structures can be obtained from these studies, of which Kelsey was a first.
ACKNOWLEDGMENTS
The continuing interest and cooperation of Manitoba Hydro and H. G. Acres & Co. Ltd. with the program of studies at Kelsey are sincerely acknowl- edged. Special thanks are due to Manitoba Hydro personnel at the Kelsey Generating Station, who, winter and summer, through the years have made the field observations, often under adverse conditions. The author is most grateful to Manitoba Hydro for their permission to present this paper, which is a contribution from the Division of Building Research, National Research Coun- cil of Canada, and is published with the approval of the Director of the Division.
JOHNSTON: DYKES ON PERMAFROST, MANITOBA 157 REFERENCES
MACDONALD, D. H. 1963. Design of Kelsey dykes. Proc. Intern. Permafrost Conf., Lafayette, Indiana 1963. (Publ. No. 1287, Nat. Acad. Sci., Nat. Res. Council, Washington, D.C. pp. 4 9 2 4 9 6 , 1966.)
MACDONALD, D. H., PILLBIAN, R. A., and H O P P ~ , H. R. 1960. Kelsey Generating Sta- tion dam and dykes. Eng. J., 4 3 ( l o ) , pp, 87-98.
JOHNSTON, G. H. 1965. Pem~afrost studies at the Kelsey Hydro-Electric Generating Station-research and instrumentation. Nat. Res. Council Can., Div. Building Res., Tech. Paper No. 178 ( NRC 7943), 57 pp.
-- 1966. A conlpact self-contained ground temperature recorder. Can. Geotech. J., III, ( 4 ) , pp. 246-250.
JOHNSTON, G. H., Brown, R. J. E., and Pickersgill, D. N. 1963. Perm,drost investigations at Thompson, Manitoba: terrain studies. Nat. Res. Council Can., Div. Building Res., Tech. Paper No. 158 ( N R C 7568), 96 pp.