HAL Id: hal-00960857
https://hal-univ-rennes1.archives-ouvertes.fr/hal-00960857
Submitted on 19 Mar 2014
HAL is a multi-disciplinary open access
archive for the deposit and dissemination of
sci-entific research documents, whether they are
pub-lished or not. The documents may come from
teaching and research institutions in France or
abroad, or from public or private research centers.
L’archive ouverte pluridisciplinaire HAL, est
destinée au dépôt et à la diffusion de documents
scientifiques de niveau recherche, publiés ou non,
émanant des établissements d’enseignement et de
recherche français ou étrangers, des laboratoires
publics ou privés.
Resynchronization Therapy Optimization
François Tavard, Antoine Simon, Christophe Leclercq, Erwan Donal, Alfredo
Hernández, Mireille Garreau
To cite this version:
François Tavard, Antoine Simon, Christophe Leclercq, Erwan Donal, Alfredo Hernández, et al..
Mul-timodal Registration and Data Fusion for Cardiac Resynchronization Therapy Optimization. IEEE
Transactions on Medical Imaging, Institute of Electrical and Electronics Engineers, 2014, 33 (6),
pp.1363-1372. �10.1109/TMI.2014.2311694�. �hal-00960857�
Multimodal Registration and Data Fusion for
Cardiac Resynchronization Therapy Optimization
Franc¸ois Tavard, Antoine Simon, Christophe Leclercq, Erwan Donal, Alfredo I. Hern´andez and
∗Mireille Garreau
Abstract—Cardiac Resynchronization Therapy (CRT) has been shown to improve cardiovascular function in specific patients suffering from heart failure. This procedure still needs to be optimized to overcome the high rate of implanted patients that do not respond to this therapy. We propose in this work a better characterization of the electro-mechanical (EM) coupling of each region of the left ventricle (LV) that could be useful to precise the best implantation site. A new descriptor is proposed with the extraction of local electro-mechanical delays. Their measurement is based on the fusion of anatomical, functional and electrical data acquired using computed tomography (CT), speckle tracking echocardiography (STE) and electro-anatomical mappings (EAM). We propose a workflow to place multimodal data in the same geometrical referential system and to extract local electro-mechanical descriptors. It implies the fusion of electrical and mechanical data on a 3D+t anatomical model of the left ventricle (LV). It mainly consists in four steps: (1) the modeling of the endocardium using a dynamic surface estimated from CT images; (2) the semi-interactive registration of EAM data and CT images; (3) the automatic registration of STE data on the dynamic model, using a metric based on Fourier descriptors and Dynamic Time Warping (DTW); (4) the temporal alignment between EAM and STE and the estimation of local electro-mechanical delays. The proposed process has been applied to real data corresponding to five patients undergoing CRT. Results show that local electro-mechanical delays provide meaningful information on the local characterization of the LV and may be useful for the optimal pacing site selection in CRT.
Index Terms—Electrophysical imaging, X-ray imaging and computed tomography, Ultrasound, Heart, Multi-modality fusion, Registration.
I. INTRODUCTION
T
HE number of patients with chronic heart failure is in-creasing rapidly in developed countries. Cardiac dyssyn-chrony is frequently observed in these patients and leads to a poor outcome if left untreated. Dyssynchrony is caused byManuscript received January 10, 2014; revised March 2, 2014; accepted March 3, 2014. This work was supported in part by French National Research Agency (ANR) through project IMOP (ANR CIC-IT no
04 187-188-189-190) and Labex CAMI (ANR-11-LABX-0004-01). It was conducted in part in the experimental platform TherA-Image (Rennes, France) supported by Europe FEDER. Asterisk indicates corresponding author.
F. Tavard, A. Simon and A. Hern´andez are with the INSERM, U1099, Rennes, F-35000 France and also with the Universit´e de Rennes 1, LTSI, Rennes, F-35000 France.
∗M. Garreau is with the INSERM, U1099, Rennes, F-35000 France and
also with the Universit´e de Rennes 1, LTSI, Campus de Beaulieu, Bˆat. 22, Rennes, F-35000 France. (email: [email protected])
C. Leclercq and E. Donal are with the INSERM, U1099, Rennes, F-35000 France, with the Universit´e de Rennes 1, LTSI, Rennes, F-35000 France and also with the CHU Rennes, Service de cardiologie et maladies vasculaires, Rennes, F-35000 France.
Copyright c 2014 IEEE. Personal use of this material is permitted. How-ever, permission to use this material for any other purposes must be obtained from the IEEE by sending a request to [email protected].
a delay between the activation of both ventricles (interven-tricular dyssynchrony) or by a disrupted ven(interven-tricular activation sequence (intraventricular dyssynchrony).
Cardiac resynchronization therapy (CRT) has been validated as an efficient treatment among selected patients suffering from ventricular dyssynchrony (NYHA III with a wide QRS complex). By pacing both ventricles, the prime goal of CRT is to restore ventricular synchrony. To this end, three leads are generally implanted: one on the endocardium of the right ventricle (RV); one inserted through the coronary venous network to pace the left ventricle (LV) from the epicardium; one in the right atrium [1].
However, around one-third of the patients treated with CRT do not show any response to the therapy [2]. Different ways are considered to optimize the treatment. The atrioventricular and interventricular pacing delays could be optimized [3], [4]. The optimal stimulation site could be pre-operatively localized and characterized, and its access through the venous network could be planned [5], [6]. The prediction of patient response could be improved, especially using images such as echocardiography [7]. The last two purposes can be reached with a better characterization of the electro-mechanical (EM) coupling. Indeed, if clinical guidelines recommend the use of electrocardiography (ECG) to identify dyssynchrony (“electri-cal dyssynchrony”), the mechani(“electri-cal dyssynchrony can be char-acterized on anatomical segments using echocardiography. For this purpose, electro-mechanical delays (EMD) are measured between: (i) the QRS peak on the ECG (marking the electrical depolarization of the ventricles) and (ii) a mechanical event (e.g. contraction or displacement) associated to the anatomical segment and assessed by echocardiography. These delays provide a characterization of the electro-mechanical coupling,
i.e.the coupling between the electrical activation of the cardiac tissue and its mechanical contraction. However, the surface ECG is a global view of the cardiac electrical activation. Therefore, considering it as the electrical reference amounts to making the assumption that electrical delays within cardiac segments (intra-segment delays) are negligible compared to delays between cardiac segments (inter-segment delays). In other words, these delays consider that all cardiac segments are electrically activated simultaneously. Moreover, the cor-relation between electrical and mechanical dyssynchrony has not proven to be strong [8]. This may explain why the use of echocardiography only for the analysis of mechanical dyssynchrony has been shown as an insufficient mean for a better selection of patients undergoing CRT (RethinQ and PROSPECT studies [9], [10]).
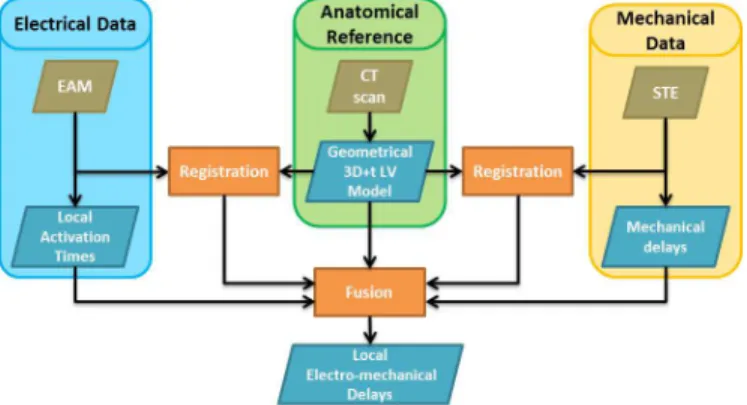
Fig. 1. Proposed workflow.
proposed through combining multi-modal data, whether they are: mechanical and anatomical (e.g. 3D dyssynchrony maps and venous access given by Tissue Doppler Imaging, CT and angiography RX [11]); anatomical and electrical (local activation time displayed on a surface model [12]); mechanical and electrical (by considering the displacement of the roving probe of an electro-anatomical mapping device [13]).
In this work, we seek to characterize local EM coupling by combining speckle tracking echocardiography (STE) and electro-anatomical mapping (EAM) which gives access to intra- and inter-segment electrical activation times. The aim is to study how this characterization can provide additional information to classical EMD. For this purpose, a pilot study was designed including the acquisition of STE, EAM and CT-scan on a limited number of patients. STE and EAM are registered according to a geometrical model estimated using a dynamic CT-scan. Indeed, CT images provide an anatomical reference of high spatial resolution as well as needed infor-mation for CRT implantation guidance (e.g. venous network access). By the fusion of STE, EAM and CT-scan, a new descriptor of cardiac dyssynchrony is then proposed: local electro-mechanical delays (local EMDs).
The paper is organized as follows. First the proposed method is detailed, including the considered data, the regis-tration process and the local EMDs extraction. Eventually the first data fusion and EMD results obtained on five patients undergoing CRT are presented, discussed in a qualitative way, and followed by conclusions.
II. METHOD
Fig. 1 illustrates the proposed workflow. It can be divided into two main parts: (1) registration; (2) data fusion for the extraction of local EMDs. During the registration process, a geometrical 3D+t LV model is computed to provide a reference surface for subsequent EAM-CT and STE-CT registrations. During the data fusion process, a synchronization step is performed between EAM and STE data before computing the local EMDs.
Each step of the method is described in the following sections.
A. Data sources
In order to provide complementary descriptions of the LV, a pilot study was conducted including CT-scan, Speckle Tracking Echography (STE) and Electro-anatomical cardiac mapping (EAM) acquisitions on a set of eight patients candi-date for CRT. Datasets corresponding to five patients were finally complete and could be exploited. CT-scans provide rich anatomical information, while STE give the mechanical description and EAM the electrical data. CT-scans and STE data were acquired in a pre-implantation step.
1) 3D cardiac imaging: The CT-scan, offering an anatom-ical description of the cardiac chambers as well as the ve-nous network, is used as the anatomical reference for the registration. CT data was acquired with a Multi-Slice Com-puterized Tomography scanner (General Electric Healthcare LightSpeed VCT 64-slice Scanner). The image volumes were reconstructed every 5% of the cardiac cycle by retrospective ECG-gating, leading to 20 3D volumes of size512×512×180 and resolution0.31 × 0.31 × 0.63 mm. Dynamic MRI can also be used to provide a geometrical reference, however its poor resolution in the Z-axis makes the registration steps (to EAM and STE) more prone to uncertainties.
2) Speckle Tracking Echocardiography (STE): 2D ultra-sound images were acquired using a General Electric Vivid SevenTMechograph. Acquisitions were realized using 2 and
4-chamber apical views over a cardiac cycle, along with a single ECG derivation. On each view, the endocardium wall has been manually segmented by the expert and tracked using Speckle Tracking (General Electric ECHOPACTM workstation). On
each view, the strain is then automatically computed by the Speckle Tracking software on 6 anatomical segments (giving 12 segments in total).
3) Electro-anatomical cardiac mapping (EAM): The elec-trical signals in EAM, acquired by the St. Jude Medical’s EnSite NavXTMsystem, are intracardiac electrograms (EGM),
from which two measures are typically analyzed: (i) local activation time delays, i.e. time to reach a local EGM peak with respect to a given reference (the activation of the sinus node, for example) and (ii) local activation amplitude (volt-age). The former measure gives an indication of the electrical propagation properties within the region being analyzed, while the latter is related to the number of cells that are actually electrically recruited in a given region. EGM are acquired after CRT implantation in two stimulation modes: spontaneous (no stimulation of the ventricles) and bi-ventricular (stimulation of left and right ventricles). Also during the EAM procedure, a low resolution reconstruction of the endocardium surface is acquired by localizing the probe in 3D-space.
B. 3D dynamic geometrical model of the left ventricle
For each CT-scan volume, a segmentation of the left cham-bers is performed using a fuzzy connectedness algorithm [14]. The robustness of this approach has been tested and has shown only reduced local spatial uncertainties, not affecting the global shape of the LV. A separation of the LV from the other segmented surfaces is then performed using an automatic estimation of the localization of the mitral plane [15]. The
application of these methods produces a dynamic 3D (3D+t) geometrical model of the LV, which describes the ventricle in a cylindrical coordinate system whose origin is the apex and the Z-axis is defined according to the great axis of the heart. LV meshes are interpolated between each instant by using Bezier curves. The temporal and spatial resolutions of the anatomical model obtained in this way can be arbitrarily defined, making it a particularly useful reference for a registration purpose and data fusion.
C. Registration of EAM and CT-scan and projection of elec-trical measurements
The registration of EAM and 3D imaging (classically CT-scan or MRI) remains a difficult task due to the poor geomet-rical description of the LV provided in EAM. Two main types of registration methods have been proposed in the literature: (1) quasi-simultaneous acquisitions i.e. EAM and 3D imaging are acquired in the same space, giving a reliable initialization step before completing the registration by classical methods (ICP) [16], [17], [12]; (2) feature-based registration (using the aorta location for instance) [18], [19], [20].
Briefly, in the first step of this method, the great axis and apex from EAM and CT-scan surfaces are automatically matched. In a second step, an interactive rotation of the EAM surface around its great axis is performed, in order to correct for the mis-rotation between the two surfaces. This rotation is realized according to some anatomical features, such as the position of the beginning of the aorta.
EAM provides sparse measures that are projected and interpolated on the reference surface. In the literature, different approaches are used for the interpolation, such as (1) closest point methods, where the closest electrical measure from the reference surface is considered [21], [22]; (2) interpolation radius, where every measurement point within a specified radius is considered for interpolation [23]; (3) radial basis functions (RBF), which are often used to display electrical data on the reference surface [17], [20]; (4) inverse problem approaches that consist in the resolution of a Dirichlet problem (of electrical potentials), often through a finite element method [24], [25], [26]. In our approach, electrical data are displayed on the model surface through a two-step method : the elec-trical measures are (i) radially projected, using the cylindrical coordinate system of the cardiac model and (ii) interpolated, using radial basis functions. Since no interpolation occurs in the projection step, the accuracy of measurement points is preserved.
D. Dynamic registration of STE and CT-scan
Very few works have been proposed in the literature for multimodal cardiac data registration considering 2D US data [27] or 3D US data [28]. The goal of these works is mainly to compare pre- and per-operative data during surgical gestures guided by US [29], or to combine complementary descriptors to help in diagnosis [30]. The temporal synchronization of data is often the first problem to solve. Some works use the ECG, by considering only one instant related to the same cardiac phase [31], whereas others use a dynamic registration
relying on an interpolation process [30], [32]. The proposed approaches can be classified in: (1) stereotactic methods that rely on the identification of the US probe position in pre-operative data (registered with MRI data), and in real time during the operation [29], [30], [33]; (2) iconic methods based on mutual information that have been applied to 2D US images [33], 3D US images [34] and IVUS images [32]; (3) geometrical methods that need the definition of geometrical landmarks during the acquisition (MRI/US registration) [35] or by user interaction (PET/US registration) [36]; (4) modelling methods that are based on the simulation of US images from CT data allowing, for example, the disposal of the temporal synchronization step [30]. All these methods show encouraging results, however they are highly dependent on pre-processing steps and manual interaction. We propose a method based on Fourier descriptors to handle differences in spatial resolution and Dynamic Time Warping (DTW) to deal with differences of cardiac rates and ECG sampling frequencies.
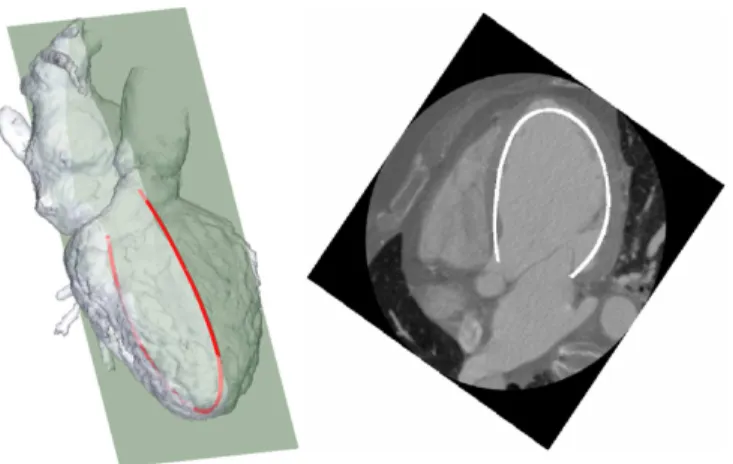
The proposed Speckle Tracking Echocardiography (STE) and CT-scan registration is based on the search of the STE acquisition plane PST E in the CT referential. STE provides
the central lines of the myocardium, on which speckles are tracked over the cardiac cycle, giving a dynamic 2D (2D+t) contour CST E(tST E), with tST E = 1, . . . , TST E (TST E
being the number of frames acquired in STE). The position of CST E(tST E) in the CT coordinate system is defined by
the origin O, the normal −−−→NST E of PST E and the rotation
angle around the normal. The origin is an approximation of the apex, selected in CST E by considering the midpoint
of the contour. For each position, PST E is used to slice
through the 3D geometrical model, resulting in a 2D+t contour CCT(tCT), tCT = 1, . . . , TCT (TCT being the number of frames acquired in CT). The spatial resolution of this 2D+t contour is thus modified according to the spatial resolution of 2D US contours, providing smooth 2D+t contours. A metric, based on Fourier descriptors (to deal with the difference in level of details between the two contours) and DTW (to handle variations in cardiac cycle dynamic between both acquisitions) is then computed between the two dynamic contours. This metric is used to optimize the position of PST E, using a
gradient descent. The optimization is initialized assuming the following: the apex is considered as the origin O and−−−→NST E is
chosen as the vector forming a 90◦ angle (for the 4-chamber
view) or 180◦ (for the 2-chamber view) with −→GA∧−→Z (−→GA
being the great axis of the LV and−→Z the CT coordinate Z-axis).
The computation of the metric to optimize is detailed in the following paragraphs.
a) Contours decomposition by Fourier descriptors: Let C be a contour composed of N ordered (e.g. clockwise) points labelled zn, n∈ {0, . . . , N − 1} in the complex space (zn =
xn+ i.yn). The Fourier descriptors Zk (k = 0, . . . , K) are
obtained by using the discrete Fourier transform:
Zk = N −1 X n=0 znexp(−2iπ N .kn) (1)
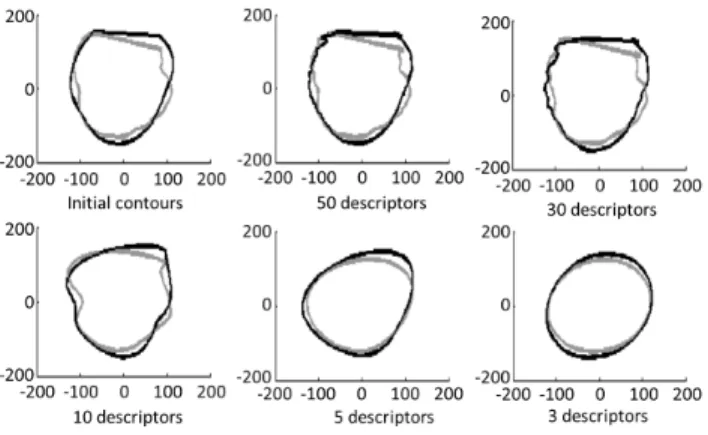
Fig. 2. CT (grey) and STE (black) contours as a function of Fourier descriptors’ order (upper left: original contours).
These descriptors are translation- (by setting Z0 = 0) and
rotation- (when considering only the coefficients’ modulus) invariant. The maximum considered order has been selected as K = 50 as it provides a precise enough description with respect to the smoothness of the STE contours (Fig. 2). Moreover, in order to give more importance to the first components, a weight inversely proportional to the order was applied. Finally, we have:
Z′ k =
1
k+ 1kZkk (2) which is defined for both modalities and for each of their instant: Z′
CTk(tCT) and Z
′
ST Ek(tST E).
b) Dynamic Time Warping based metric: Dynamic Time Warping (DTW) [37] enables to measure similarity between two sequences which may vary in time or speed. The se-quences are then warped non-linearly in the time dimension. For this purpose, DTW is based on the search for a warping function F = {(i1, j1), (i2, j2), . . . , (iN, jN)} which is a
sequence of N couples of (tCT, tST E) such that a distance
D(F ) is minimized (see Fig. 3). This distance is defined to optimize the match between the Fourier descriptors along the cardiac cycle: D(F ) = PN
n=1d(in, jn).w(in, jn), where
d(in, jn) is the distance between the two contours at times in
and jn : d(in, jn) = [Pk=50k=0 (ZCT′ k(in) − Z
′
ST Ek(jn))
2
]1/2,
and w(in, jn) is a weight (with a classical symmetric form)
introduced to compensate the variation of the path length: w(in, jn) = (in− in−1+ (jn− jn−1)) (3)
Some classical restrictions on the warping function are added in order to preserve the structures of both cardiac cycles: (i) Monotonic conditions: in≥ in−1 and jn ≥ jn−1
(ii) Continuity conditions: in− in−1≤ 1 and jn− jn−1≤ 1
(iii) Boundary conditions: i1 = 1, iN = TCT, j1 = 1
and jN = TCT (iv) Slope constraint condition: to avoid
unrealistic correspondences, the gradient of F should not be too steep or too gentle. If a couple (i, j) moves forward in the horizontal or vertical direction, it is not allowed to step further in the same direction before stepping once in the diagonal direction.
Fig. 3. Left: dynamic time warping between two signals U and V . Right: restriction domain on the search space.
c) Dynamic programming: In order to find the warping function F minimizing D(F ) and following the previous constraints, dynamic programming is used. The minimization is seen as the computation of a sequence g(i, j) using the following recursive algorithm:
(i) Initial condition: g(i1, j1) = 2d(i1, j1)
(ii) Dynamic programming equation to iteratively compute the value of g(i, j) starting from the initial conditions:
g(i, j) = min
g(i − 1, j − 2) + 2d(i, j − 1) + d(i, j), g(i − 1, j − 1) + 2d(i, j),
g(i − 2, j − 1) + 2d(i − 1, j) + d(i, j) (4) (iii) Time-normalized distance of the optimized warping func-tion Fopt :
D(Fopt) = 1
TCT + TST E
g(TCT, TST E) (5)
Moreover, the search domain has been restricted using a combination of Itakura’s parallelogram [38] and Sakoe’s ribbon [37] (Fig. 3-Right).
E. Electro-mechanical coupling
The two registration methods allow for the comparison in a common space of local electrical and mechanical data resulting from EAM and STE, respectively. The goal is then to combine both sources of information to characterize the local EM coupling. The temporal resolutions differ from both modalities (1400 measures per sec. for EAM and around 80 images per sec. for STE). Also, acquisitions are not simultaneous, non-linear differences could arise between signals from the two modalities, such as a reduction of diastolic duration while sys-tolic duration remains almost constant. Therefore a temporal registration has to be considered before characterizing the local EM coupling.
1) Temporal registration: The temporal registration is the search of a temporal matching between both modalities and is done in two steps: (i) the choice of reference signals and their synchronization and (ii) the computation of the correspondence between the two time spaces.
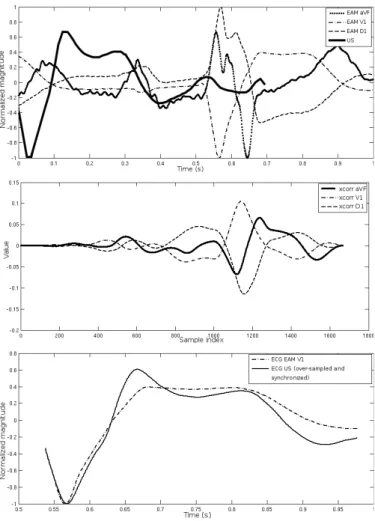
a) Reference signal selection and synchronization: ECGs are acquired during both acquisitions, using three different derivations (usually D1, V1, aVF) for EAM and a unique derivation for STE (which may differ from one acquisition to another, depending on the position of the leads) (see Fig.
Fig. 4. Reference signal selection and synchronization. Top: ECG signals before synchronization: one derivation acquired during the US-STE acquisi-tion and three derivaacquisi-tions from EAM (D1, V1, aVF). All the signals have been normalized and centered. Middle: Cross-correlation between the US ECG and the three derivations from EAM. The EAM derivation with the higher correlation (V1) is selected as the reference EAM ECG. Bottom: US ECG with the V1 derivation of the EAM ECG, after synchronization on the maximum of the cross-correlation.
4). A classical approach based on the calculation of the cross correlation between the unique ECG of STE and the different derivations of EAM is applied in order to select the best-matching EAM derivation. The ECG of STE is re-sampled for this purpose. The maximum of cross correlation gives the best-matching derivation and is also used to synchronize both acquisitions.
b) Correspondence of time spaces: Once the EAM ECG derivation has been chosen, the two alike ECGs (ECGST E(tST E) and ECGEAM(tEAM)) can be compared.
Since both signals differ in temporal resolution and are not acquired simultaneously, their similarities are to be found in their shapes rather than in their magnitudes. A correspondence between the time spaces tST E and tEAMis therefore obtained
through the computation of a DTW between the first derivative over time of the two ECGs: dECGST E
dtST E and
dECGEAM
dtEAM . With
both modalities in the same 3D+t space, we are able to characterize local EM coupling.
2) Local electro-mechanical delays: In STE, EM delays are computed by considering the delay between the peak of
strain (radial, longitudinal or circumferential) and a global time reference which is usually the beginning of the QRS complex on the ECG. We refer to these EM delays as “global electro-mechanical delays” (global EMD). By opposition, we propose a new indicator of the EM coupling: local electro-mechanical delay (local EMD). Local EMD is the time from local activation tLAT to local minimum of strain tstrain (in
this work, we considered the longitudinal strain which is the most robust and reproductible). It represents the time δEM D
from the electrical stimuli to the maximum of contraction. δEM D= tstrain− t′LAT
where t′
LAT is the instant tLAT in the STE time referential.
The main factor limiting the accuracy of δEM Dis the accuracy
of tstrain, measured with a sampling frequency of 80.8 Hz,
to be compared to 1200 Hz for t′
LAT. The expected accuracy
of the local EMD is therefore±12.4 ms.
III. RESULTS AND DISCUSSION
A. Patient data description
Data from five patients undergoing CRT (identified as P0 to P4) have been collected and analysed using the proposed workflow. For these five patients, CT-Data and STE data were acquired before the pacing probe implantation, with 2 and 4-chamber views in STE for patients P0, P1 and P3 and with only 4-chamber view for patients P2 and P4. EAM data were acquired in post-implantation stage, with two modes of activation (spontaneous and bi-ventricular stimulation). All the patients presented left bundle branch block, this dysfunction being more important for the patient P3. The follow-up of these patients has been realized in post-implantation period.
B. Registration of EAM and CT-scan
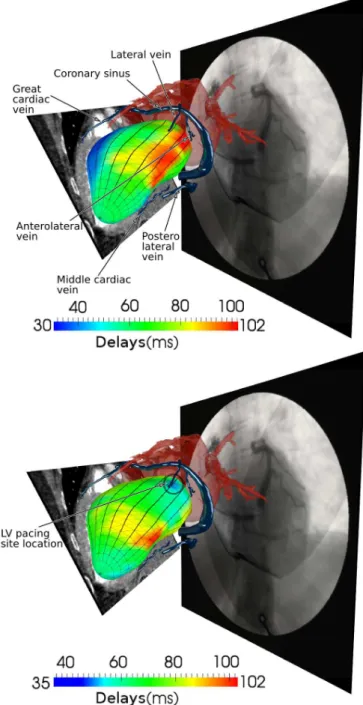
The registration of EAM and CT enables to integrate descriptors of the electrical activation with an anatomical description of the ventricle and of the venous network. New representations have been generated, corresponding to the projection of local activation times on the LV surface, com-bined with the 3D venous coronary network that has been previously extracted from these CT images [6]. An example of these representations is illustrated Fig. 5-top. This figure illustrates the result of the EAM - acquired in spontaneous (i.e. no stimulation) mode - and CT registration. It provides an integrated visualization of the left cardiac segmented surfaces (the atria in a transparent red color), a CT-scan slice (in grey levels) cutting the 3D model, the 3D segmented venous coronary network (in blue) and the per-operative angiography. This type of representation can be very useful for planning or assisting the implantation step. It enables the clinician: (i) to have a precise representation of the electrical activity in a realistic anatomical reference; (ii) to select the best candidate implantation sites based on the electrical information and on the venous network. On the presented case (Fig. 5-top), late activated regions are to be seen on lateral regions (basal and anterior), and lateral and anterolateral veins are the nearest to these regions.
According to the specificities of these data, it remains difficult to realize a quantitative evaluation of this registration process. But the most significant information that can be used to validate the reliability of the result concerns the spatial matching that we must observe between: (1) the spatial localization of the firstly activated LV region in bi-ventricular stimulation mode, projected on the LV surface; and (2) the localization of the stimulation lead implanted using a venous access.
This comparison is realized through manual identification by a cardiologist, based on the per-implantation 2D X-Ray contrast injected images, of the position of the lead in the corresponding vein in the CT image.
Fig. 5-bottom shows the result of the EAM/CT registration and enables to compare the first activated LV region with the identified pacing lead position in the lateral vein (encircled). This figure provides an integrated visualization of the same data but with the mapping of local activation times correspond-ing to a bi-ventricular stimulation. We can see that the position of the activation lead is corresponding to an early electrical activation, in blue colors on the electrical map at the distal part of the lateral vein. This information allows to show the reliability of the EAM/CT registration process. The obtained results have been validated by the cardiologist who performed the implantation.
C. Dynamic registration of STE and CT-scan
The dynamic registration of STE and CT-scan has been evaluated on simulated and real data.
1) Evaluation on simulated data: An evaluation of the pro-posed metric has been carried out on simulated data. Dynamic US contours are simulated in four steps: (i) the acquisition plane is defined arbitrarily and used to cut through the 3D+t CT surface, generating 2D+t contours; (ii) the position in space of the points defining the contours is smoothed using a
sinc kernel filtering; (iii) the 2D+t contours are interpolated over time to get as many instants in the simulated data as in a standard US acquisition (about 70 instants in the cardiac cycle); (iv) finally, the 2D+t contours are scaled to match the size of a myocardial contour rather than endocardial. The scale factor is 110%.
Elementary transforms were applied to the simulated 2D+t contours. Three parameters have been tested: the translation along the US plane’s normal, the rotation around an orthogonal axis to the same normal θ1, and the rotation around the great
axis θ2 (Fig. 6).
The metric value (eq. 5) is then computed between the 3D+t CT surfaces and the transformed simulated 2D+t contours. Fig. 7 provides a comparison between the proposed metric and a classical metric: the sum of squared Euclidean distances (SSD) between the contours at the first instant, for different values (X axis) of translation, θ1and θ2. The proposed metric
is much smoother than the SSD and does not show local min-ima contrarily to SSD. The minimum of the metric in each case is pointed by an arrow. For the two first elementary transforms (translation along the US plane’s normal and rotation around an orthogonal axis to the same normal), the minimum value of
Fig. 5. Result of the EAM / CT registration for the patient P2 and comparison between the first activated LV region and the pacing lead position (telediastolic phase). Top: left cardiac chambers segmented surface (transparent red), segmented venous coronary network (blue), CT-scan slice and angiography (grey levels). Bottom: same data with local activation time (corresponding to a bi-ventricular stimulation) mapped on the geometrical LV model. The position of the stimulation lead corresponds to an early electrical activation (in blue).
the metric is reached for the initial position of the simulated contours. Considering the rotation around the great axis, the minimum value is reached for a rotation of 5◦ around the
great axis. Moreover, this metric shows two maxima around −100◦ and100◦ (in the case of the rotation around the great
axis). Those rotations represent conditions for which contours are distant (in terms of the metric). As the shape of the left ventricle endocardium is almost a surface of revolution, the two maxima point out the fact that not only the geometric but
Fig. 6. Illustration of the three tested parameters for the metric evaluation. Left: translation along the US plane’s normal. Middle: rotation around an orthogonal axis to the same normal θ1. Right: rotation around the great axis
θ2.
Fig. 7. Metric as a function of the three elementary transforms applied to the simulated 2D+t contours (left) compared to the distance (sum of squared distance) between first instants contour and surface (right). Top: translation along the US plane’s normal. Middle: rotation around an orthogonal axis to the same normal θ1. Bottom: rotation around the great axis θ2. The arrows
point at the minimum for each case.
mainly the dynamic component is important in the proposed metric.
The shape of the metric in a neighbourhood of a minimum position shows few local minima and a global minima rather well defined. Those specificities of the metric allow the use of a gradient descent optimization.
2) Results on real data: For two of the five patients, only the 4-chamber view was available. The result of the proposed approach is illustrated Fig. 8. For the three other patients, the US acquisition included both 2- and 4-chamber views. The superposition of the US contour and the corresponding CT reformated slice is illustrated Fig. 9.
The qualitative assessment of all results is satisfying. All the obtained US acquisition planes are realistic, as for the relative positions of the two views when available. The major differences between the US contour and the CT data are localized in the apical segments which can be explained by a well-known problem: the difficulty to visualize the apical area in echography.
Fig. 8. Result of the STE-CT registration for the patient P2. Left: segmented surface from the CT data and US plane result after registration. Right: superposition of the US contour and the corresponding CT slice (4-chamber view).
Fig. 9. Result of the STE-CT registration with the Superposition of the US contour and the corresponding CT reformated slice. Left/right columns: patients P1 and P3, respectively; Upper row: 4 chambers view; lower row: 2 chambers view.
These results have been presented to an echocardiographic expert who has evaluated them as being reliable.
D. Data fusion
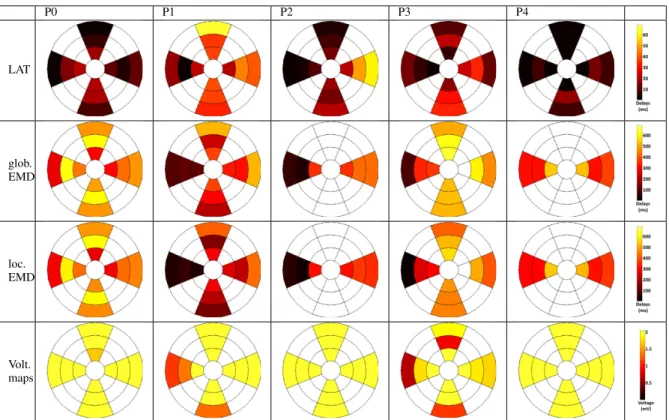
Strains are measured on 6 segments of each apical view. If both a 4-chamber view and a 2-chamber view are available, EMD can be computed on 12 segments, such as for patients P0, P1 and P3. The number of segments is reduced to 6 if only one view is available (patients P2 and P4). Results are presented using bull’s-eye visualizations (from center to external: apex to basal, top: anterior, bottom: inferior, left: septal, right: lateral), given Fig. 10 and are discussed.
P0 P1 P2 P3 P4 LAT glob. EMD loc. EMD Volt. maps
Fig. 10. 12 segments bull’s-eye visualizations of LAT (ms), global and local EMD (ms) and voltage maps (mV) (in rows), for the five patients of this study (in columns).
1) Local activation time (LAT): For patients P1, P2 and P3, the earliest activated segments are, as classicaly expected, located on the septal wall and the latest activated segments on the lateral or anterior walls. The entire electrical depolarization of the LV is performed in approximately 60 ms for patients P1 and P2 and in about 40 ms for patient P3. These values are quite high compared to a normal case [10] but are coherent with the pathological condition of these patients, who present a left bundle branch block. Bull’s-eyes of patients P0 and P4 present more homogeneous electrical maps with low values, the most delayed locations belonging to segments that are not observed in US.
2) Global electro-mechanical delays: Since the electrical reference of global EMD is the surface ECG, these delays reflect a combination of (i) inter-segment activation delays (the delays generated by the electrical propagation of the depolarization front in the different segments) and (ii) the electrical and mechanical intra-segment delays (the delays generated by the local electrical impulse, the mechanical response and the contraction).
For patients P1, P2 and P3, the shortest global EMD are found on the septal wall and for the other segments, global EMD are greater (between 100 and 550 ms). The mechanical activation is more delayed for patients P0 and P4. For patients P3, P4 and especially P0, the maximum of contraction occurs after the aorta valve closure providing ineffective contraction.
3) Local electro-mechanical delays: Unlike global EMD which combine inter- and intra-segment delays, local EMD only consider the intra-segment electro-mechanical delays, therefore better describing the local characteristic of the LV wall. For a healthy patient, the local EMD values should be
homogeneous, with low values. For the considered patients, some significant differences between global and local EMD are observed for patients P1, P2 and P3. For patients P0 and P4, because of the low LAT values on the considered segments, global and local EMD maps are very similar.
4) Voltage maps: Compared to the voltage map of patients P2 and P4 for which every value is above 2mV (showing a good recruitment of cardiac muscular cells), the maps of patients P0, P1 and P3 show some low voltage segments. Voltage maps can be misinterpreted for different reasons due to the acquisition method itself. In fact, since the peak-to-peak amplitude is considered from the roving probe, a low voltage can have three explanations: (i) a deficiency in electrical conduction (block, necrosis tissue); (ii) a lack of activation (good conduction but no stimulation); (iii) a weak probe-to-endocardium contact during measure. Voltage is a complementary information to local EMDs even if local EMDs maps are more reliable.
5) Patient response to CRT: The actual quality of the response to CRT is given by the 6-month clinical follow-up for these patients, considering mainly ejection fraction, end-diastolic volume, QRS duration, walk test and quality of life:
• Patients P2 and P4 respond very well to CRT. Patient P2
went from a 35% left ventricular ejection fraction (LVEF) to 60% after implantation (with no more asynchronism) and P4 from 20% to 45%. Their QRS duration, from initial values higher than 170 ms, were reduced to values lower than 120 ms;
• Patients P0, P1 and P3 were considered as
non-responders, with LVEF values inferior to 30 and QRS duration higher than 140 ms after the implantation.
The goal of CRT is to stimulate segments that are delayed but which present a good intra-segment electro-mechanical coupling so that they could provide a good local mechanical response to the electrical stimulation. These targeted segments should therefore present homogeneous local EMDs with low values.
The five considered patients have all been implanted in the medial or basal lateral segments. If we focus on these segments, patients P2 and P4, who presented the best response to the implantation, show medium local EMD values and quite a good homogeneity. For the three other patients, these segments show either higher values, or a higher heterogeneity. Local electro-mechanical delays therefore provide a com-plementary description of the LV local behavior that may be used for CRT optimization.
IV. CONCLUSION
We have proposed a new method for the characterization of local (intra-segment) electro-mechanical coupling of the left ventricle. This method is based on the fusion of multi-modal data (anatomical, mechanical, electrical) that provides the means to extract significant information about electro-mechanical coupling.
It relies on the acquisition of a large amount of data by using an invasive protocol (especially for EAM) which is nowadays possible only in this kind of experimental studies including a limited number of patients. However the recent progresses of the acquisition modalities should enable both to acquire all data non-invasively and to provide more extensive results.
Results on five patients show that local electro-mechanical delays provide additional information on the local character-ization of the LV that could be used to precise the optimal pacing site selection in CRT.
In future works, the use of 3D ultrasound will be investi-gated in order to compute local electro-mechanical delays over the whole cardiac wall and to consider all the components (radial, longitudinal and circumferential) of the strain. More-over, providing a full description of the cardiac wall, it should facilitate the registration with the CT data. However, the loss of spatiotemporal resolution when going from 2D to 3D should be considered carefully. The proposed approach will also be adapted to deal with other EAM acquisition protocols such as the St. Jude Medical’s EnSite ArrayTMsystem, enabling to
include more patients in this study (euHeart project FP7/2008-2012). We know also that even if EAM provides a very rich characterization, its inclusion in clinical routine needs today a very heavy investment. Other ways to compute local EMDs, for instance from surface ECGs [39], should be a key to CRT optimization. Other improvements should be studied, such as the use of an identical ECG derivation in all acquisitions and of an iconic metric for the registration of CT and US data.
This work is, to our knowledge, the first to propose a process to estimate local electro-mechanical delays and to compare them to global electro-mechanical delays. CRT being an electrical therapy to treat a mechanical pathology, the understanding of the local electro-mechanical coupling of the LV is of primary importance to better localize the implantation probe site.
REFERENCES
[1] J. Daubert, P. Ritter, H. Breton, D. Gras, C. Leclercq, A. Lazarus, J. Mugica, P. Mabo, and S. Cazeau, “Permanent left ventricular pacing with transvenous leads inserted into the coronary veins,” Pacing and
clinical electrophysiology, vol. 21, no. 1, pp. 239–245, 1998. [2] J. Bax, T. Abraham, S. Barold, O. Breithardt, J. Fung, S. Garrigue,
J. Gorcsan, D. Hayes, D. Kass, J. Knuuti, C. Leclercq, C. Linde, D. Mark, M. Monaghan, P. Nihoyannopoulos, M. Schalij, C. Stellbrink, and C. Yu, “Cardiac Resynchronization Therapy: Part 1– Issues Before Device Implantation,” Journal of the American College of Cardiology, vol. 46, no. 12, pp. 2153 – 2167, 2005.
[3] Z. Whinnett, J. Davies, G. Nott, K. Willson, C. Manisty, N. Peters, P. Kanagaratnam, D. Davies, A. Hughes, J. Mayet et al., “Efficiency, reproducibility and agreement of five different hemodynamic measures for optimization of cardiac resynchronization therapy,” International
journal of cardiology, vol. 129, no. 2, pp. 216–226, 2008.
[4] M. Zuber, S. Toggweiler, M. Roos, R. Kobza, P. Jamshidi, and P. Erne, “Comparison of different approaches for optimization of atrioventricular and interventricular delay in biventricular pacing,” Europace, vol. 10, no. 3, p. 367, 2008.
[5] N. Van de Veire, N. Marsan, J. Schuijf, G. Bleeker, M. Wijffels, L. van Erven, E. Holman, J. De Sutter, E. van der Wall, M. Schalij et al., “Noninvasive imaging of cardiac venous anatomy with 64-slice multi-slice computed tomography and noninvasive assessment of left ven-tricular dyssynchrony by 3-dimensional tissue synchronization imaging in patients with heart failure scheduled for cardiac resynchronization therapy,” The American journal of cardiology, vol. 101, no. 7, pp. 1023– 1029, 2008.
[6] M. Garcia, J. Velut, D. Boulmier, C. Leclercq, M. Garreau, P. Haigron, and C. Toumoulin, “Coronary Vein Extraction in MSCT Volumes using Minimum Cost Path and Geometrical Moments,” IEEE Journal of
Biomedical and Health Informatics, vol. 17, pp. 336 – 345, 2013. [7] C. Yu, J. Sanderson, T. Marwick, and J. Oh, “Tissue doppler imaging: a
new prognosticator for cardiovascular diseases,” Journal of the American
College of Cardiology, vol. 49, no. 19, pp. 1903–1914, 2007. [8] N. Varma, P. Jia, C. Ramanathan, and Y. Rudy, “RV electrical activation
in heart failure during right, left, and biventricular pacing,” JACC
Cardiovascular Imaging, vol. 3, no. 6, p. 567, 2010.
[9] J. Beshai and R. Grimm, “The resynchronization therapy in narrow QRS study (RethinQ study): methods and protocol design,” Journal of
Interventional Cardiac Electrophysiology, vol. 19, no. 3, pp. 149–155, 2007.
[10] E. Chung, A. Leon, L. Tavazzi, J. Sun, P. Nihoyannopoulos, J. Merlino, W. Abraham, S. Ghio, C. Leclercq, J. Bax et al., “Results of the predictors of response to CRT (PROSPECT) trial,” Circulation, vol. 117, no. 20, pp. 2608–2616, 2008.
[11] F. Tournoux, R. Chan, R. Manzke, M. Hanschumacher, A. Chen-Tournoux, O. G´erard, J. Solis-Martin, E. Heist, P. Allain, V. Reddy et al., “Integrating functional and anatomical information to guide cardiac resynchronization therapy,” European journal of heart failure, vol. 12, no. 1, p. 52, 2010.
[12] P. Chinchapatnam, K. Rhode, M. Ginks, R. Aldo, P. Lambiase, R. Razavi, S. Arridge, and M. Sermesant, “Model-based imaging of cardiac apparent conductivity and local conduction velocity for diagnosis and planning of therapy,” IEEE Transactions on Medical Imaging, vol. 27, no. 11, pp. 1631–1642, 2008.
[13] O. Camara, S. Oeltze, M. De Craene, R. Sebastian, E. Silva, D. Tam-borero, L. Mont, M. Sitges, B. Bijnens, and A. Frangi, “Cardiac Motion Estimation from Intracardiac Electrical Mapping Data: Identifying a Septal Flash in Heart Failure,” in Functional Imaging and Modeling
of the Heart, 2009, pp. 21–29.
[14] J. Fleureau, M. Garreau, A. Simon, R. Hachemani, and D. Boulmier, “Assessment of global cardiac function in MSCT imaging using fuzzy connectedness segmentation,” in Computers In Cardiology, 2008, pp. 725–728.
[15] F. Tavard, A. Simon, C. Leclercq, D. Pavin, A. Hern´andez, and M. Gar-reau, “Data fusion of left ventricle electro-anatomical mapping and multislice computerized tomography,” in IEEE International Conference
on Image Processing (ICIP), 2009, pp. 1725–1728.
[16] K. Rhode and M. Sermesant, “Modeling and registration for electro-physiology procedures based on three-dimensional imaging,” Current
Cardiovascular Imaging Reports, vol. 4, pp. 116–126, 2011.
[17] G. Gao, P. Chinchapatnam, M. Wright, A. Arujuna, M. Ginks, A. Ri-naldi, and K. Rhode, “An MRI/CT-based cardiac electroanatomical mapping system with scattered data interpolation algorithm,” in IEEE
International Symposium on Biomedical Imaging: From Nano to Macro, 2010, pp. 464–467.
[18] Y. Okumura, B. Henz, S. Johnson, T. Bunch, C. O’Brien, D. Hodge, A. Altman, A. Govari, and D. Packer, “Three-dimensional ultrasound for image-guided mapping and intervention: Methods, quantitative vali-dation and clinical feasibility of a novel multi-modality image mapping system,” Circulation: Arrhythmia and Electrophysiology, vol. 1, no. 2, pp. 110–119, 2008.
[19] J. Dong, H. Calkins, S. Solomon, S. Lai, D. Dalal, A. Lardo, A. Lardo, E. Brem, A. Preiss, R. Berger, H. Halperin, and T. Dickfeld, “Integrated electroanatomic mapping with three-dimensional computed tomographic images for real-time guided ablations.” Circulation, vol. 113, no. 2, pp. 186–94, 2006.
[20] Z. Malchano, “Image guidance in cardiac electrophysiology,” Ph.D. dissertation, Massachusetts Institute of Technology, 2006.
[21] K. S. Rhode, M. Sermesant, D. Brogan, S. Hegde, J. Hipwell, P. Lam-biase, E. Rosenthal, C. Bucknall, S. A. Qureshi, J. S. Gill, R. Razavi, and D. L. G. Hill, “A system for real-time XMR guided cardiovascular intervention,” IEEE Transactions on Medical Imaging, vol. 24, no. 11, pp. 1428–1440, 2005.
[22] K. Rhode, Y. Ma, J. Housden, B. Karim, A. Rinaldi, M. Cooklin, J. Gill, M. O’Neill, T. Schaeffter, J. Relan, M. Sermesant, H. Delingette, N. Ayache, M. Kruger, W. Schulze, G. Seemann, O. Dossel, and R. Razavi, “Clinical applications of image fusion for electrophysiology procedures,” in IEEE International Symposium on Biomedical Imaging:
Nano to Macro, 2012, pp. 1435 –1438.
[23] K. Wilson, G. Guiraudon, D. Jones, and T. Peters, “Mapping of cardiac electrophysiology onto a dynamic patient-specific heart model,” IEEE
Transactions on Medical Imaging, vol. 28, no. 12, pp. 1870–1880, 2009. [24] R. Juneja, “Radiofrequency ablation for cardiac tachyarrhythmias: prin-ciples and utility of 3D mapping systems,” Current science, vol. 97, no. 3, p. 416, 2009.
[25] Z. Badics and D. Harlev, “Real-time reconstruction of endocardial poten-tial maps in non-contact cardiac mapping,” COMPEL: The International
Journal for Computation and Mathematics in Electrical and Electronic Engineering, vol. 28, no. 4, pp. 865–878, 2009.
[26] B. Hor´aˇcek, J. Sapp, C. Penney, J. Warren, and J. Wang, “Comparison of epicardial potential maps derived from the 12-lead electrocardiograms with scintigraphic images during controlled myocardial ischemia,”
Jour-nal of Electrocardiology, vol. 44, no. 6, pp. 707–712, 2011.
[27] T. M¨akel¨a, P. Clarysse, O. Sipila, N. Pauna, Q. Pham, T. Katila, and I. Magnin, “A review of cardiac image registration methods,” IEEE
Transactions on Medical Imaging, vol. 21, no. 9, pp. 1011–1021, 2002.
[28] F. Li, P. Lang, M. Rajchl, E. Chen, G. Guiraudon, and T. Peters, “Towards real-time 3D US-CT registration on the beating heart for guidance of minimally invasive cardiac interventions,” in SPIE Medical
Imaging, 2012, pp. 831 615–831 615.
[29] Q. Zhang, R. Eagleson, and T. Peters, “Real-time visualization of 4D cardiac MR images using graphics processing units,” in IEEE
International Symposium on Biomedical Imaging: Nano to Macro, 2006, pp. 343–346.
[30] W. Wein, A. Khamene, D. Clevert, O. Kutter, and N. Navab, “Simulation and fully automatic multimodal registration of medical ultrasound,” in
Medical Image Computing and Computer-Assisted Intervention (MIC-CAI), 2007, pp. 136–143.
[31] M. Ledesma-Carbayo, J. Kybic, M. Desco, A. Santos, M. Suhling, P. Hunziker, and M. Unser, “Spatio-temporal nonrigid registration for ultrasound cardiac motion estimation,” IEEE Transactions on Medical
Imaging, vol. 24, no. 9, pp. 1113–1126, 2005.
[32] X. Huang, N. Hill, J. Ren, G. Guiraudon, and T. Peters, “Intra-cardiac 2D US to 3D CT image registration,” in SPIE Medical Imaging, 2007. [33] X. Huang, J. Moore, G. Guiraudon, D. Jones, D. Bainbridge, J. Ren, and T. Peters, “Dynamic 2D ultrasound and 3D CT image registration of the beating heart,” IEEE Transactions on Medical Imaging, vol. 28, no. 8, pp. 1179–1189, 2009.
[34] X. Huang, J. Ren, G. Guiraudon, D. Boughner, and T. Peters, “Rapid dynamic image registration of the beating heart for diagnosis and surgical navigation,” IEEE Transactions on Medical Imaging, vol. 28, no. 11, pp. 1802–1814, 2009.
[35] J. Hong, K. Konishi, H. Nakashima, S. Ieiri, K. Tanoue, M. Nakamuta, and M. Hashizume, “Integration of MRI and ultrasound in surgical navigation for robotic surgery,” in World Congress on Medical Physics
and Biomedical Engineering, 2007, pp. 3052–3055.
[36] A. Savi, M. Gilardi, G. Rizzo, M. Pepi, C. Landoni, C. Rossetti, G. Lucignani, A. Bartorelli, and F. Fazio, “Spatial registration of echocardiographic and positron emission tomographic heart studies,”
European Journal of Nuclear Medicine and Molecular Imaging, vol. 22, no. 3, pp. 243–247, 1995.
[37] H. Sakoe and S. Chiba, “Dynamic programming algorithm optimization for spoken word recognition,” IEEE Transactions on Acoustics, Speech,
and Signal Processing, vol. 26, no. 1, pp. 43–49, 1978.
[38] F. Itakura, “Minimum prediction residual principle applied to speech recognition,” IEEE Transactions on Acoustics, Speech and Signal
Pro-cessing, vol. 23, no. 1, pp. 67–72, 1975.
[39] O. Berenfeld, “Toward discerning the mechanisms of atrial fibrillation from surface electrocardiogram and spectral analysis,” Journal of