HAL Id: halshs-00577148
https://halshs.archives-ouvertes.fr/halshs-00577148
Preprint submitted on 16 Mar 2011HAL is a multi-disciplinary open access
archive for the deposit and dissemination of sci-entific research documents, whether they are pub-lished or not. The documents may come from teaching and research institutions in France or abroad, or from public or private research centers.
L’archive ouverte pluridisciplinaire HAL, est destinée au dépôt et à la diffusion de documents scientifiques de niveau recherche, publiés ou non, émanant des établissements d’enseignement et de recherche français ou étrangers, des laboratoires publics ou privés.
The Case of Niger
Dorothée Boccanfuso, Celine de Quatrebarbes, Luc Savard
To cite this version:
Dorothée Boccanfuso, Celine de Quatrebarbes, Luc Savard. Can the removal of VAT Exemptions support the Poor? The Case of Niger. 2011. �halshs-00577148�
Document de travail de la série
Etudes et Documents
E 2011.06
Can the removal of VAT Exemptions support the Poor?
The Case of Niger
Dorothée Boccanfuso*
Céline de Quatrebarbes**
Luc Savard*
*GREDI, Department of Economics Business Faculty Université de Sherbrooke **CERDI, Université d’Auvergne Clermont 1, celine.dequatrebarbes@gmail.com
Abstract:
In order to have the public funds necessary for its development, Niger is examining the possibility of expanding its Value- added tax (VAT) tax base to exempted goods and basic food products. This proposal has prompted violent opposition leading to the question of the social impacts of taxation. The first micro-macro computable general equilibrium model of Niger's actual economy has been developed. This model allows analysis of the social impact and distributional analysis of the following VAT structures: a pure VAT structure, a structure maintaining certain exemptions, and a multiple-rate VAT structure. The model’s results shows that although restoring the VAT rate would be socially costly compared to the initial situation, the distributional impact of the VAT differs according to the system implemented in the country. Maintaining VAT exemptions in food crop agriculture sectors associated with a tax base expansion in the remaining sectors will increase public revenue while taking into account the national goal of poverty reduction. The net social impact of exoneration depends on the economic structure of the concerned sector. If the national goal is the end of exemption, the model shows that applying a pure VAT conforming to the theory is preferable in terms of economic growth whereas applying a reduced-rate on food crop agriculture lightens the social impact of the end of exemptions compared to a single rate.
Introduction
Niger has reinforced its value-added tax (VAT) system in view of successfully completing its fiscal transition and mobilizing resources required for its development. According to the available statistics (UEMOA, 2008), Niger nonetheless remains one of the WAEMU countries with the lowest overall public tax collection rates.1 In 2009 Niger had a fiscal pressure rate of 13.9% and an average of 10.1% from 1998 to 2005 which is lower than the average of 14.08% of the GDP over the same period in the WAEMU.2 In 2005, the VAT revenues were roughly 5% of the GDP, one of the lowest tax ratios in Africa. The VAT efficiency ratio constructed by Ebrill and Keen (2001) 3 gives an average of 27% for Sub-Saharan African countries and 24% for Niger in 2005. It varies between 23% and 36% for the other WAEMU countries, except for Togo and Senegal whom have a much better performance.
Faced with this situation and in view of improving the returns of the internal indirect tax, the Nigerien government has tried to reduce VAT exemptions by extending the tax base to include basic food products. Exemption of these consumer goods indeed yields significant tax loss. Consumer goods represent an important share of transactions in the country but are often exempted or exchanged in the under-taxed traditional sector. Besides an increase in public revenue, the end of VAT exemptions should restore economic neutrality.
In a national and international poverty reduction strategies context it is important to assess the social impacts of this type of reform and to understand whether reinforcing public revenues might hamper efforts made to reduce poverty. The relation existing between the increase in public revenues and the establishment of effective poverty reduction programs is not always confirmed in the short term (Filmer et al., 1998; Gauthier, 2007). This enables the hypothesis that the social objectives of the country should be taken into account right from the definition of the characteristics of public tax collection. The increase in fiscal pressure can be seen as legitimate by the population only if it is quickly associated with effective public expenditure allowing an improvement in the welfare of populations and a reduction in
1
It is important to remember, however, that current comparison in terms of level of tax collection between WAEMU countries is somewhat biased by the lack of harmonization of ways to calculate the level of fiscal pressure. The rate of fiscal pressure is generally calculated by the relation between total tax revenues and the GDP, but the difference is due to the composition of the numerator. The comparison can be solid only when all countries use the same calculation basis, which hardly seems to be the case today.
2 Niger, Finance ministry, Institut National de la Statistique, (2008). Report « L’analyse de la politique fiscale au Niger et ses impacts sur la pauvreté ».
3
Ebrill and Keen (2001) have advanced efficiency differences of the VAT according to the economic and social structures of countries and have attempted to classify the countries and regions of the world according to VAT efficiency. The traditional measure is the “efficiency ratio”—the ratio of VAT revenues to the GDP divided by the standard VAT rate, that is, the single rate normally applied over all products. The efficiency ratio of a VAT system with satisfactory functioning is situated between 40% and 50%
poverty.With this hypothesis, it is important to analyze the impact of the end of exemptions in an economy like Niger and define in what way a VAT structure could support the poor. This analysis primarily seeks to determine the household categories most affected in terms of increased poverty and inequalities. The distributional consequences of introducing various tax systems was evaluated by using a computable general equilibrium model (CGEM) representing the Nigerien economy linked to a micro-simulation model (Decaluwe et al., 1999).
The remainder of this paper is split up into four sections. In the first, we present the characteristics of the VAT structure in Niger and some assumptions about the social incidence of the end of VAT exemptions in Niger. The micro macro CGE model is presented in the second section. The third focuses on the definition of the VAT scenarios and the analysis of the aforesaid scenario’s simulation. In the last section, we make some concluding comments.
1. The Nigerien choices regarding internal indirect taxation structure:
a. An imperfect VAT structure regardless to the theory:
The VAT was established in Niger on January 1, 1986. At the beginning, there were three VAT rates: 35%, 25%, and 15%. In 1994, these rates respectively became 24%, 17%, and 10%. In 1990, five years after the implementation of the VAT, comparable collection had decrease by more than 40%. This decline cannot be explained by movement in GDP which increased but by the importance increase of transaction exempt from VAT. Since 1998, Niger has had to conform to WAEMU directives regarding indirect taxation:4 choosing a single VAT rate ranging from 15% to 20%, harmonizing taxable goods and exemptions, possibly applying the VAT to the agricultural sector, and excluding transport activities. One of the objectives is to increase the taxation of the informal sector. Starting in January 2000, Niger thus implemented a single-rate VAT of 17%. In May 2000, with the establishment of the common external tariff and the expected decrease in customs revenues, the VAT rate climbed to 18% then to 19% in 2002.
The imperfections of the Nigerien VAT system are numerous compared to a “pure” VAT as prescribed by economic theories (Chambas, 2005; Ebrill and al., 2001). Between 2003 and 2005, legal exemptions still represented on average more than 43% of the internal VAT yield and exempted consumptions represented 48.6% of the consumption of Nigerien households living in Niamey. In rural areas, the VAT base represents only 43.1% of final consumption
4
due to the VAT does not apply only to monetary consumptions.5 It should be noted that VAT exemptions do not concern only commodities consumed by poor populations but increasingly extend to the industrial sector (mines and agro-food industry) for a more or less lengthy period. In addition to reducing the tax base, VAT exemptions create distortions within the economy that could have consequences on the economic level activity and on the poverty level.
b. The economic and social implications of exemptions
VAT exemptions and production
To avoid creating economic distortions, the VAT should theoretically be neutral in the production and distribution chain (for the producer, wholesaler, and retailer). Exemptions occur when output is untaxed but input tax is not recoverable. Exemptions break the VAT chain and create a cascading effect. The tax has to be paid by the producer using the exempted item, and no longer by the final consumer. This cascade effect increases production costs and creates distortions in the production choices. Contrary to common belief, the VAT 6no longer equals a consumption tax when exemptions are granted. The only way for the producer to remain neutral when faced with VAT exemptions would be to be able to charge this additional tax burden to the consumer by raising the sales price. This behaviour would be possible if the supply was very elastic and if the producer could fix the price.
Likewise, when the zero VAT rate on exported goods is not applied, the VAT credits of exporting firms are not reimbursed by the government and the problem is the same as in the presence of exemptions. The VAT cascading effect, which leads to the competitiveness of local producers in terms of international trading, creates a negative effective protection (Bonjean and Chambas, 2001). In this case, the VAT has functioned largely as a tax on exports. The existence of informal sector can also create distortion in VAT application (Emran and Stigltiz, 2005). Indeed, the informal sector is taxed by the VAT when it purchases its inputs from the formal sector: it then cannot obtain any credit refund for its tax credits because it is non-taxable.
The reduction in exemptions and effective application of the zero VAT rate should enable an increase in the country's economic efficiency and hence improve allocations of resources. From a social standpoint, any additional burden for the producer impacts the poverty level of the country by provoking a slow-down in the production system and a decrease in
revenues
5 1999 survey on household consumption and data from the Ministère de l’économie et des finances,
Institut National de la Statistique du Niger, (2008) Report « L’analyse de la politique fiscale au Niger et ses impacts sur la pauvreté ».
6
Exemption may be defines either in terms of particular commodities or in terms of particular trader. Only the first one is studied here.
from the production. Nevertheless, the end of exemptions can have an ambiguous effect in terms of poverty, as the latter also depends on households' ability to access basic goods. VAT exemptions and consumption
A “pure” VAT must also be neutral for the consumer. A uniform taxation avoids distortion between prices of goods available on the territory. This is no longer the case when one of the goods is exempted or subject to a reduced rate. The relative decrease in retail price of this good compared with other goods subject to a full rate can make it preferable for other substitutable goods and thus modifies the economic structure of the demand.
From a social point of view, the VAT does not take into account each individual's ability to pay. In this context, exemptions can improve the country's situation by enabling consumers to have access to basic goods at lower prices. In a context of agricultural prices instability7, an ad valorem tax like VAT can quickly increase tax burdens in household budgets.. In a country where 62.1% of the population lives below the poverty line (QUIBB_ 2005) and 34% in extreme poverty, where subsidies targeted at the level of household income are nearly inexistent, taxation can constitute an instrument to fight poverty. The progressivity of this type of measure is still limited compared to subsidies (Alderman, 2002; Ebrill et al., 2001). Indeed, exemptions apply to a consumer good and not to a targeted population. The social effect thus depends on the consumption structure of the various social groups. The tax burden on the consumer is all the heavier as consumers demand is inelastic, which is the case with basic food products.
VAT exemptions thus have an ambiguous impact on the poverty level. The distribution of the tax burden depends on the structure of the market as well as the nature of the social groups concerned by the exemptions. The levels of production and consumption are interdependent, and the poverty situations of households are a function of their activity sector and their consumption structure.
VAT exemption and public revenue:
First, the problem of VAT application creates a gap between the VAT nominal rate and the effective VAT rate. Secondly, the tax expenditure brought about by VAT exemptions is difficult to evaluate (Gautier, 1999): “Although the government loses revenues on the sales of non-taxable firms, it completely reclaims the non-exempted inputs of these same firms.” The effect therefore depends on the net value of the tax base.8 In addition, the various systems
7
In 2005, Niger experienced inflationary pressure notably owing to a strong reduction in agricultural production in 2004 due to climate problems.
8 According to Gautier (1999), “Net losses in government revenues are then equal to the sum of sales
of exempted firms, from which are subtracted the sum of exempted inputs purchased by non-taxable branches, and exempted sales purchased by non-taxable firms.”
can significantly disrupt the application of legislation and lead to increased fraud.
The end of exemption forces the government to choose a new VAT structure supporting the poor: that is a uniform rate structure close to a pure VAT structure or the introduction of a reduce rate on large consumption goods. Lots of studies present the qualities of the both system (Gautier, 2001; Ebrill et al., 2001).
2. A computable general equilibrium model to study the social impact of
expanding the tax base
Computable general equilibrium models (CGEM) have often been used to evaluate the macroeconomic impact of a tax reform, as presented in the literature review of Shoven and Whalley (1984) or Burgess and Stern (1993). Lots of MEGC have been used to study the impact of trade tax decrease (Clarete and Whalley, 1987; Cockburn, 2004) and more generally the impact of a change in national tax structure (Toh and al. 2005). VAT is usually conceptualized as a uniform consumption tax (Serra-Puche 1984 ; Ballard and Shoven, 1985, Ballard and al. 1987). Little CGEM take into account the intern complexity of VAT system while literature talks about it (Ebrill and al., 2001). Bovenberg (1987), Emini (2000) Giesecke and Nhi (2010) have examined the impact of the various VAT systems in a given economy. They discuss the possibility of moving away from a uniform taxation rate by multiplying rates and the possibility to exempt goods. The key variables in the analysis are consumption, sectoral factor reallocation, production, government revenue, and household welfare. Emini (2000) showed that by postulating budget neutrality with a lower level of taxation than the one set down in the finance act, re-establishing VAT neutrality by expanding the tax base enables economic expansion and an increase in household welfare compared to the initial situation. An increase in inequalities between household categories must nonetheless be noted. When Emini rejects the hypothesis of budget neutrality and re-establishes the VAT at the official rate, he shows that the sudden increase in VAT leads to a strong loss in reallocation, especially for sectors with a weak ex ante tax burden. In this context, household welfare decreases, as inequalities.
The model used aims to take into account imperfections at the level of the VAT system by modelling, starting with the initial situation, the existence of VAT exemptions in certain sectors of the Nigerien economy. It also aims to compare the social impact of different VAT systems ranging from single-rate to multiple-rate and to the preservation of certain exemptions on agricultural goods. We aim to analyse the impact of these changes on poverty and inequalities while taking into account heterogeneity in the structure of household income and expenses. We have constructed a CGEM micro-simulation to achieve this goal. This is
the first time this technique has been used to address this type of problems, as authors frequently use CGEMs with representative agents9.
Nigerien data
The model used data from a social accounting matrix (SAM) of the Niger economy for 2004 and a household survey Questionnaire unifié des Indicateurs de base du bien-être (QUIBB) for 2005. The information on Nigerien tax structure is provided by the country's fiscal office for the year 2006.
The SAM has been aggregated to cover five sectors: food crop agriculture, export agriculture, industry10 and services, the retail branch and transportation, as well as the production of public services by the government. The aggregation of the SAM provides a way to make up for the weakness in tax information. The distinction between food crop agriculture and export agriculture offers a way to take into account specific characteristics of these two agricultural sectors a primarily informal part of agriculture, an under-taxed locally consumed, and a primarily exported form of agriculture.
Primary sector production is predominant in Niger. Agricultural production, including export agriculture and food crop agriculture, represents 40.6% of national value added. Services constitutes 23.9% of the country's total value added, followed by industry with 19.3%. Extraction industries with the mining sector, gold and uranium, produce 9% of total value added. Agriculture has a high value added rate, respectively 91.7% for non-exporting food crop agriculture and 85.4% for export agriculture, based on the weak use of intermediate inputs. Trade with the rest of the world is concentrated in the industry sector (68.6% of exports and 85.1% of imports). Export agriculture represents 31.4% of exports and food crop agriculture, 10.4% of imports. The penetration rate of imports in the country is 18.53% and these imports are foremost made up of industrial goods, but available goods on the territory are nevertheless mostly locally produced. The labour factor receives the largest share of value added, primarily from the agricultural sectors. The informal sector (principally agriculture and trade) constitutes 70 to 80% of traded GDP, employs a large share of the population, and contributes to social stability by enabling populations to have a source of income. Households acquire their income from labour (91.3%) and capital (5.3%) but also transfers from government (2.5%) and the rest of the world (1%). Their main expenditure item is food.
9
Cockburn (2004) used micro-simulation to analyse the impact of a decrease in trade tax and en increase in consumption tax.
10
This sector includes the mining industry, food and beverage production, textile and clothing production, the chemical industry, metal production, other factories, electricity, gas, water, and finally construction.
The SAM has been disaggregated in order to distinguish VAT collected by the customs and by the general direction of taxes.11 According to the information from the SAM, it can be seen that the level of VAT collected is roughly 22% of the sum of payable VAT when considering a pure VAT at a 19% rate touching on only final consumption, representing a little less than 5% of GDP and 37% of total tax revenues, which is consistent with the available statistics. The VAT levied on customs represents 60% of total VAT revenues. The average VAT rate is thus significantly below the legal VAT rate, the difference being due to two factors: the high sum of VAT exemptions and tax evasion. Most internal VAT revenues come from the taxation of industrial goods. As for taxes on foreign trade, the sectors most affected are chemical, oil, and manufactured products. Direct taxes do not concern the entire population and the tax burden especially concerns the workers in the formal private and public sectors. Individual entrepreneurs in the informal sector also pay a direct tax (for example the overall trading tax), although the sum of these tax revenues is weak. (Data on the structure of the Nigerien economy based on the SAM can be found in Appendix 1.)
Characteristics of the computable general equilibrium model
The model draws on EXTER by Decaluwé, et al (2001) as a starting point. It has been modified to take into account the specificities of the Nigerien economy and takes up the SAM structure presented above. Each sector produces a single good. As a result, there is the same number of goods produced as there are production sectors, with the addition of oil, which is consumed but not locally produced. Only the “export agriculture” and “industry” sectors take part in international trade. The “trade,” “service,” and “food crop agriculture” sectors are non-tradable.
The production technology is represented by constant return to scale which combine labor and capital. We suppose full employment of factor. Labor is mobile from one sector to another while capital is fixed. The fixity of capital can be explained in Niger by the weak development of financial markets and the difficulty of transformation of capital in the short- to medium-term. Hence, the model considers the short-to medium term influences of a tax policy. The level of intermediate consumption is linked to production by fixed technical coefficients. The functional form describing the level of value added is a production function with constant substitution elasticity taking into account labour/capital substitution. Producers in each sector maximize profits subject to their technology constraint and determine optimal factor’s demand.
The double Armington assumption is used to distinguish imports and domestically produced
11
The initial SAM accounted for the VAT collected in levy in import taxes without distinction, which strongly underestimated VAT revenues.
goods, implying imperfect substitutability and to differentiate exports from goods for domestic use. The production possibility frontier of the economy is defined by a constant elasticity of transformation (CET) function between domestic supply and export and this yields the export supply function. The model defines a composite commodity made up of domestic demand and final imports, which is consumed by the households, firms and government. We assume a constant elasticity of substitution (CES) function between domestic demand and final import demand and this provides the import demand function. Import and locally produced goods are subject to the same taxation structure. The parameters of CES and CET functions are exogenously determined.
Households receive income from primary factor payments that they hold directly, transfers from government and from the rest of the world. Households spend in the consumption of goods and services, pay taxation, and saved. Household demands are represented by a linear expenditure system (LES) derived from the maximization of a Stone-Geary utility function. The analysis of the distributional impact of tax reform is complemented by a micro-simulation module in which demand functions are the same as those used in the CGE model. Government revenues are generated of all levied taxes, i.e. direct taxes, production taxes, import duties, export duties, and indirect internal taxes (VAT and excise duties), as well as foreign aid and remittances from the rest of the world. As for their tax component, revenues depend on exogenous tax rates but also on the variation of their tax base. International transfers to the government are exogenous. The government produces public services, consumes various goods, and remunerates civil servants. Government savings are residual and correspond to government revenue from which are subtracted public expenditures and transfers from government to Nigerien households.
Prices are modelled in standard fashion. Nevertheless, this work highlights a few specificities of our modelling of prices such as the market price of goods and services integrating the cost of marketing margins and transport margins and their VAT rate. We will detail VAT treatment further on.
The equilibrium conditions and closure of the model are traditional. For each market, equilibrium is ensured by a price mechanism that endogenously adjusts the supply and demand. Investment is determined by the level of savings of agents. Household savings and public savings, for their part, are residual and endogenous. The nominal exchange rate is chosen as numeraire; transfers between the various agents and foreign saving are exogenous and fixed to their initial values. The balance of payment is balanced by the adjustment of the real exchange rate. Public expenditure is fixed, which is easily explained in
a developing country such as Niger12 and corresponds to our analytical frame distinguishing the effect of an increase in public revenues and the establishment of an effective policy for poverty reduction.
Specificities in the treatment of internal indirect taxation
The value added tax is an ad valorem tax applies theoretically to the price of the composite good (locally produced and imported goods) including trade and transport margins. Exemption is modelled as a supplementary tax paid by the producer during the purchase of intermediate consumptions. Because of the hypothesis of perfect competition, the producer cannot charge this tax burden on the sales price of the output. We have consequently modelled two types of VAT: one concerning the price of intermediate consumptions (TCI) when the final good is exempted and when VAT credit are not refund, and the other concerning the final retail price (TC). If the VAT rate affecting intermediate consumptions is positive, the price of intermediate consumptions increases for the producer and the value added price decreases. The VAT exemptions are thus taken into account and the VAT is not only a consumption tax
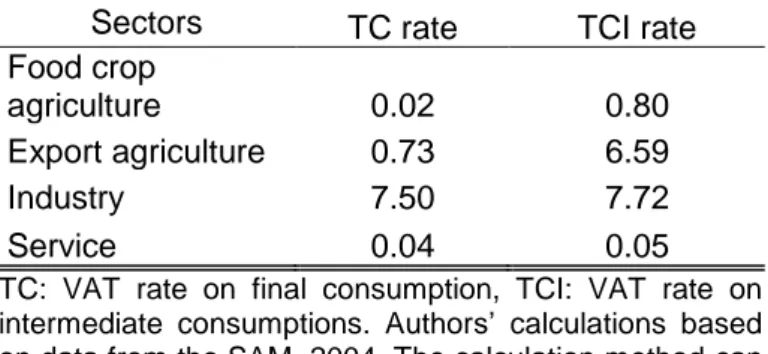
VAT rate applied to final consumption and to intermediate consumptions is calculated at the base year according to the proportion of VAT revenues collected on intermediate consumption goods. The sum of VAT collected on intermediate goods in food crop agriculture can be explained by the large number of exemptions but also by the informality of the sector. In export agriculture, VAT collected on intermediate goods is due to the non-application of zero-rate. This repayment default concerning exporting firms exists in Niger.13 In industry, VAT exemptions primarily concern the mining sector and firms that produce food, beverages, and tobacco. In services, it is foremost hotels and restaurants that are concerned. The proportion of VAT collected on intermediate consumption goods is fixed by sector, according to the available statistics.14 It is 80% of total VAT revenues for food crop agriculture; 60% for export agriculture, and 30% for the sector of industry and services. The sectors that bear the greatest tax burden on intermediate consumption are in fact export agriculture and industry, and this is related to the level of input use in production. The burden of VAT collected on intermediate consumptions in the initial situation influences the results of our simulations when the pure VAT system is re-established and when the cascading effect is cancelled. With this distribution of collected VAT revenues, we obtain the VAT rates presented in Table 1.
12
Between 1999 and 2003, government spending remained stable between 17 and 18% of GDP.
13
Report: l’évaluation de l’application des directives de l’UEMOA, portant harmonisation des
législations des Etats membres en matière de taxe sur la valeur ajoutée et de droits d’accises.
Table 1: Effective VAT rates in Niger according to sector and tax base
Sectors TC rate TCI rate
Food crop
agriculture 0.02 0.80
Export agriculture 0.73 6.59
Industry 7.50 7.72
Service 0.04 0.05
TC: VAT rate on final consumption, TCI: VAT rate on intermediate consumptions. Authors’ calculations based on data from the SAM, 2004. The calculation method can be consulted in Appendix 2.
We have considered low substitution elasticities of foreign trade for all products. In other words, we assume in standard fashion that there is a significant differentiation between domestic, exported, and imported products (de Melo 1998). We have done the same for the substitution elasticity of production factors (Appendix 4).
3. Differential analysis of the social impacts of different VAT systems
To analyse the effect of the end of exemption, five simulations were run. The first two options (simulations 1a and 1b) take up one of the propositions for Nigerien economic policy, namely the application of a uniform rate and the broadening of the tax base to primary consumer goods. The theoretical objective of a single-rate VAT system is not a high rate but the largest possible tax base, thus distributing the tax burden over the economy while favouring optimal budget performance. This is made possible by exploiting tax loopholes, by a near-zero sum of exemptions and by the taxation of agriculture (Bonjean and Chambas, 2001). These two first simulations capture the implementation of a pure VAT in the Nigerien economy in its theoretical dimension: no VAT on intermediate consumptions for any sectors expressing the total absence of VAT exemptions. In simulation 1a, we restore the official rate of 19% VAT imposed by the Finance act. In simulation 1b, we reduce the VAT rate at 10% as a result of the expansion of the tax base, which is consistent with the logic of the single rate. The model considers an endogenous public revenues and an exogenous VAT rate in order to assess the impact of a pure VAT on both public revenues and poverty.
The principle of “Equal Yield Tax Analysis” (Shoven and al., 1990) is made for the two following simulations. It aims to compare various taxation schemes while keeping constant the public expenditure and the State revenue. This analytical approach is adapted to capture the intrinsic incidence of alternative tax scenarios by isolating them from induced effects which may be related to the change in the State revenue, the State expenditures and savings. The public revenue in simulation 1b has been used as reference.
Simulation 2 takes into account the difficulty of taxing food crop agriculture products in developing economies. These goods are mostly exchanged in the informal sector or home consumed, which makes their consumption difficult to control and tax. The exemption of food crop agriculture implies maintenance of VAT cascading effect in the sector. This simulation should allow us to establish the net social impact of the end of exemptions in a sector where produced goods have been by far consumed but where the producer’s vulnerability is also very important. Under the hypothesis of budget neutrality, VAT exemptions as well as the VAT rate in food crop agriculture are kept exogenous at their initial level but the VAT rate on final consumption of other sectors is endogenous and uniform.
In simulation 3, we decide to impose a 5% rate on the whole of food crop agriculture. Under the hypothesis of budget neutrality, the VAT rates in the other sectors are endogenous and unique. Government revenue is assumed to be the same as in simulation 1b. This simulation takes up the economic theory of multiple rates without taking into account realities tied to self-consumption and the informal sector, thus enabling a comparison with the theoretical system of the single rate. The VAT is fixed exogenously without budget neutrality in simulation 4. We have fixed a reduced VAT rate of 5% in the sector of food crop agriculture associated with a VAT rate of 15% in the other activity sectors.
The last two simulations (3 and 4) take into account the rigidity of a pure VAT system to test the hypothesis of the progressivity of a double-rate VAT system and thus analyse the social impacts of this taxation compared to the establishment of a single rate. Various authors have concluded that a single-rate consumption tax would be undesirable from an economic and social standpoint, as Gautier (2001) shows in his literature review. The establishment of a reduced rate on a few sensitive products could provide a way to avoid the multiplication of ad hoc or permanent exemptions while avoiding penalizing the consumption of these products with a 19% or even 10% tax rate. It is important to note that this VAT system requires proper functioning of the tax authorities. The multiple rates can create VAT credits for firms when a part of the inputs is taxed at the full rate and the final product, at a reduced rate. To preserve neutrality of the VAT, all tax credits must be reimbursed by the tax authorities.
We will begin with a presentation of the sectoral and macroeconomic results before proceeding to a distributional analysis. The macroeconomic results of simulation 1b are detailed, as it corresponds to the reference simulation for the comparative analysis under the hypothesis of budget neutrality.
Macroeconomic results
Results of simulations 1a and 1bIn the two first simulations (1a and 1b), any possibility of imperfection related to the application of VAT have been eliminated (absence of informal sector, improved tax collection, absence of market power). VAT rate on final consumption increases considerably compared to the initial situation. The results of simulation 1b, will serve as the reference simulation for the subsequent comparative analysis. The results of simulation 1a are presented in Table 2 and these shed light on what would take place with the application of a pure VAT system associated with a high rate.
In this simulation (1b), two effects are combined. The first is related to the end of VAT exemptions and the second, to the establishment of an effective VAT rate of 10%. The restoration of VAT neutrality in the production process leads to a decrease in the cost of intermediate consumptions, which increases the value added price, irrespective of sectors. While the value added increases in food crop agriculture and services—expanding sectors— it decreases in industry and export agriculture. The increase in value added is nonetheless not sufficient in these two sectors to compensate the increase in cost of the labour. There is a reallocation of the labour towards food crop agriculture and services. In terms of foreign trade, this simulation shows that from this point on, the same tax level applies for selling locally or exporting (the zero rate of VAT being correctly applied) and the decision is made solely according to relative prices. Contrary to the other sectors, domestic price in industry decreases, which favours exports and reduces the price for the producer (the largest share of industrial production is sold locally in the initial situation). This situation favours the purchase of locally produced goods. The domestic price for other goods including export agriculture increases. It penalizes local sales in favour of imported goods. The fix current account balance explains that increase in exports finances imports. The export agriculture and industry sectors experience an impact different from the other branches owing to the greater burden of VAT on their intermediate consumption modelled in the reference situation, but also given their positioning on the international market.
When we integrate an official 10% VAT rate on the whole of goods and services, we see that the net effect is different than the one tied to the elimination of exemptions. On the local market, while the decrease in the domestic price resulted in a decrease in the price of the composite good permitting a decrease in the price of intermediate consumptions, the VAT rate strongly increases retail prices, which reduces domestic demand. Only the industrial good follows a different trend, as it benefits from a sufficient reduction in the price of the composite good for the VAT increase not to increase its retail price. Because industry is a
driving force in the economy (production and investment), this amplifies the demand on this sector and its expansion. Given our modelling assumptions, the behaviour of the retail branch depends on the level of production in the rest of the economy. The decrease in the value added price leads to a decrease in the demand for labour, except in industry. It can be seen that the average wage does not change compared to the initial situation. The earned rate of return follows the same trend as the sectors' demand for labour. The variations of factor payments and factor allocation affects the level of disposable income of households and thus their welfare, the poverty level, and inequalities, which we will analyse in the distributional analysis.
In terms of public finance, the end of exemptions and the increase in the effective VAT rate yields a considerable increase in tax revenues. The government benefits from exemptions’ suppression and from the re-establishment of a 10% effective VAT. VAT revenues now represent 11.70% of the GDP. Overall government revenue increases by 40.30%. The result in terms of public finance is nevertheless conditional upon the efficiency of the tax system. The positive effect noted on public finance impacts the level of investment by an increase in value of 45.05% compared to the initial situation. This is primarily a result of government savings since the total savings of Nigerien households decrease.
The reduction in VAT exemptions allows the industrial sector to develop by increasing the domestic demand (intermediate consumption, investment) as well as its participation in foreign trade, but the size of the other sectors is reduced given the strong reduction in the local demand of households. It should be noted that with a single VAT rate of 10%, the macroeconomic variables only slightly vary compared to the initial situation (which is not the case with a 19% VAT rate) where public finance improves considerably.
Results of simulations 2 and 3
Under the hypothesis of budget neutrality, the major macroeconomic indicators are only slightly influenced by the different simulated VAT systems. The evolution of public finance, investment, average wage, and the price index remain similar in simulations 1b, 2, and 3. Government revenues are fixed to the sum defined in simulation 1b. We should note that the variation in the utility of the representative agent remains similar.
In simulation 2, the VAT rate in sectors other than food crop agriculture is established at 12.86%. Preserving food crop agriculture as an informal sector thus requires a VAT increase on other goods. Maintaining food crop agriculture as a sector under taxation opens the way for supporting its development through a stabilization of domestic demand compared to the other strongly taxed goods. The value added price of food crop agriculture still decreases, as producers must now obtain intermediate consumptions at a 10% VAT rate without the
possibility of having their VAT credits reimbursed. This produces stronger VAT cascading effect compared to the initial situation, in which the other sectors were also less strongly taxed. Nonetheless, the value added price of food crop agriculture decreases only slightly, as Nigerien farmers use very few inputs. Food crop agriculture can thus maintain its activity compared to the other sectors experiencing a slow-down in their development comparable to that of a pure VAT system (except for industry, cf. simulation 1b). The production factors move from export agriculture and services to industry, as in simulation 1b. Food crop agriculture maintains its production capacities. In this simulation, the additional cost produced by the VAT exemption is reduced by a decrease in the retail price on this good, which is not the case for the other sectors taxed at 10%. The price index increases slightly at 105.16 and total private consumption decreases in volume by 5.30% with a strong decrease for the consumption of services and a slight decrease for food crop agriculture.
When a dual VAT rate with a reduced rate is introduced in food crop agriculture at 5% and an endogenously fixed VAT rate on other goods at 11.37%, the macroeconomic situation comes closer to the results of simulation 1b but do not favour consumption of the other goods any more than in simulation 2.
Results
of simulation 4
The introduction of a multiple-rate VAT structure with a 5% reduced rate in food crop agriculture and a 15% rate in the other sectors yields a 59.36% increase in public revenues compared to the initial situation, that is, 19 percentage points more than when we apply budget neutrality or with a single rate of 10%. Public savings, and hence investment, increase substantially. The VAT revenues now correspond to 15.1% of GDP, which is significantly higher than the WAEMU average and shows higher budget performance than with a 10% single rate. Household welfare nevertheless decreases by 10.51%, more than two points higher compared to the previous simulations. In terms of production, the situation is not very different from simulation 3.
On the whole, we observe that the macroeconomic effects of the different scenarios are very similar. However, it is important to analyse whether anticipations of the regressive nature of a pure VAT materialize through our distributional analysis. This analysis will also enable us to identify the best options in distributional terms.
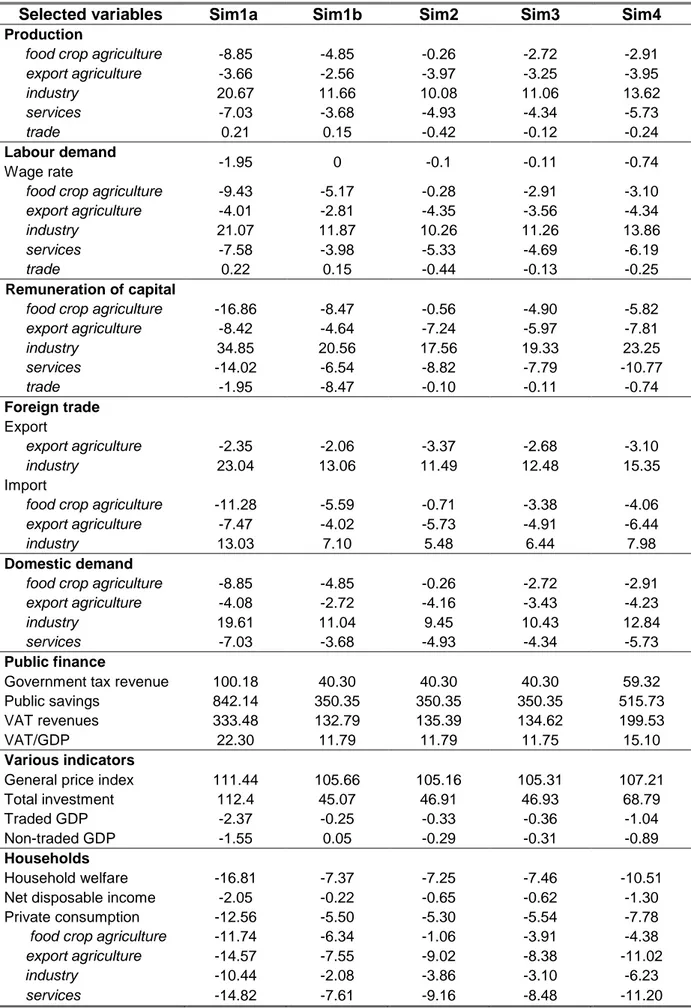
Table 2: Macroeconomic results of the simulations (Δ %)
Selected variables Sim1a Sim1b Sim2 Sim3 Sim4 Production
food crop agriculture -8.85 -4.85 -0.26 -2.72 -2.91
export agriculture -3.66 -2.56 -3.97 -3.25 -3.95 industry 20.67 11.66 10.08 11.06 13.62 services -7.03 -3.68 -4.93 -4.34 -5.73 trade 0.21 0.15 -0.42 -0.12 -0.24 Labour demand -1.95 0 -0.1 -0.11 -0.74 Wage rate
food crop agriculture -9.43 -5.17 -0.28 -2.91 -3.10
export agriculture -4.01 -2.81 -4.35 -3.56 -4.34
industry 21.07 11.87 10.26 11.26 13.86
services -7.58 -3.98 -5.33 -4.69 -6.19
trade 0.22 0.15 -0.44 -0.13 -0.25
Remuneration of capital
food crop agriculture -16.86 -8.47 -0.56 -4.90 -5.82
export agriculture -8.42 -4.64 -7.24 -5.97 -7.81 industry 34.85 20.56 17.56 19.33 23.25 services -14.02 -6.54 -8.82 -7.79 -10.77 trade -1.95 -8.47 -0.10 -0.11 -0.74 Foreign trade Export export agriculture -2.35 -2.06 -3.37 -2.68 -3.10 industry 23.04 13.06 11.49 12.48 15.35 Import
food crop agriculture -11.28 -5.59 -0.71 -3.38 -4.06
export agriculture -7.47 -4.02 -5.73 -4.91 -6.44
industry 13.03 7.10 5.48 6.44 7.98
Domestic demand
food crop agriculture -8.85 -4.85 -0.26 -2.72 -2.91
export agriculture -4.08 -2.72 -4.16 -3.43 -4.23
industry 19.61 11.04 9.45 10.43 12.84
services -7.03 -3.68 -4.93 -4.34 -5.73
Public finance
Government tax revenue 100.18 40.30 40.30 40.30 59.32 Public savings 842.14 350.35 350.35 350.35 515.73 VAT revenues 333.48 132.79 135.39 134.62 199.53 VAT/GDP 22.30 11.79 11.79 11.75 15.10
Various indicators
General price index 111.44 105.66 105.16 105.31 107.21 Total investment 112.4 45.07 46.91 46.93 68.79 Traded GDP -2.37 -0.25 -0.33 -0.36 -1.04 Non-traded GDP -1.55 0.05 -0.29 -0.31 -0.89
Households
Household welfare -16.81 -7.37 -7.25 -7.46 -10.51 Net disposable income -2.05 -0.22 -0.65 -0.62 -1.30 Private consumption -12.56 -5.50 -5.30 -5.54 -7.78 food crop agriculture -11.74 -6.34 -1.06 -3.91 -4.38
export agriculture -14.57 -7.55 -9.02 -8.38 -11.02
industry -10.44 -2.08 -3.86 -3.10 -6.23
Distributional analysis
The micro-simulation model associated with the CGE model enables us to study the effects of an economic policy for households observed in the survey. This technique takes into account the heterogeneity of households in terms of both their income structures and their expenditure structures observed in the household survey. This type of analysis is not possible with an approach based on representative agents. Moreover, according to Savard (2005), distributional analysis by representative agent can lead to qualitatively and quantitatively different conclusions. This type of model combining CGE and micro-simulation modules enables the distributional impact analysis of a tax policy on the real income of each household. Indeed, the model allows us to obtain new revenue and expenditure vectors after each simulation of economic policies implemented. New real income vector are computed after each simulation and thus it is possible to re-estimate poverty and inequality indices at the reference period and for each scenario.
Our study draws on data from the 2005 Questionnaire Unifié sur les Indicateurs de Base du Bien-être (QUIBB) including 6 690 Nigerien households. The poverty analysis is performed using the usual Foster, Greer and Thorbecke (1984) poverty measures (FGT) 15. This covers poverty incidence (α=0), depth (α=1), and severity (α=2). The poverty line used is 105 827 CFAF per year per capita in rural areas and 144 750 CFAF in urban areas in 2005 (PNUD 2005). As for the inequality measure, we selected the Gini index.
Four household groups were identified, first taking into account the place of residence: urban (households residing in Niamey and in other urban centres) and rural areas and second taking into account the main sector of activity of the head of household: agriculture or non-agriculture. The four groups analysed are thus Uagri, Ragri, Unagri, Ragri respectively representing 3.2%, 60%, 13.1%, and 23.7% of Nigerien households.16
Table 3: Structure of average consumption among Nigerien
households
Household groups Uagr Ragr Unagr Rnagr Food crop agriculture 43.66 56.53 38.26 52.40 Export agriculture 16.48 14.33 16.94 15.37 Industry 34.06 25.58 33.72 27.53
Services 5.8 3.56 11.08 4.7
Total 100 100 100 100
Source: Authors’ calculations based on data from the QUIBB_2005
15
The distributional analysis was conducted using DASP (Distributive Analysis Stata Package) software.
16
It is important to point out that the decomposition of households is independent from the CGE model. It is carried out based on data from the QUIBB survey.
Regardless of the group, the average per capita expenditure of households in food crop agriculture remains the largest expenditure item, followed by the industrial good. Self-consumption is included in food crop agriculture17.The importance of expenditures in agricultural goods may justify the fact that government and donor agencies favour this expansion of the tax base. We observe that the difference in the consumption structure depends more on the area of residence than on the activity of the head of household. For urban households with or without agricultural activity, food crop agriculture exhibit lower share of expenditure and their consumption is more diversified. Industrial goods and services occupy a slightly less important place in their budget (
Table 3).
We observe a relation between obtaining revenue from agriculture and the level of poverty, irrespective of the area of residence. The group least affected by poverty is the urban non-farmers (34%) while rural households headed by a farmer are most affected by poverty (70.8%). The Gini coefficient measuring the degree of inequalities has a value of 0.46 in 2005 in Niger (INS). Regardless of the group examined, the degree of inequalities is comparable despite a slightly higher rate among urban dwellers who do not obtain their revenue from agriculture (0.434).
Table 4: Analysis of poverty and inequalities in Niger
Uagr Ragr Unagr Rnagr
Incidence (FGT0) 70.8 64.4 34.0 53.1 Depth (FGT1) 30.3 25.8 10.8 19.4 Severity (FGT2) 15.9 13.3 4.8 9.6 Gini 0.427 0.429 0.434 0.428 Authors’ calculations based on data from the QUIBB_2005;
17 Self-consumption is more important in rural area. In the micro simulation model we have
consider self-consumption as a capital income. Self-consumption and food crop agriculture can be combined due to their under taxed character.
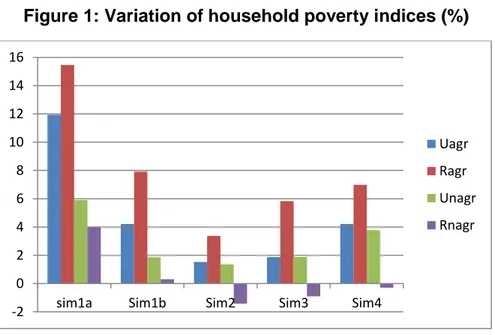
Figure 1
18 presents the variations in the FGT indices for the four household groups and forthe five simulations.
Figure 1: Variation of household poverty indices (%)
Authors' calculations, results of the micro simulation on DASP
Budget neutrality allows us to evaluate the effects of the various VAT systems by dissociating the macroeconomic effects from the microeconomic effects. First, we can see that regardless of the simulation considered, all poverty indices increase compared to the reference period. The results concerning the rural non-farm group are insignificant except for the simulation 1a. The extent of the deterioration of the situation differs according to the group and the simulation.19
The expansion of the tax base to the whole of consumer goods and the re-establishment of a pure VAT system is costly in social terms (simulations 1a and 1b). If we consider simulation 1b, we can see that the most negatively affected group is the agricultural rural households (Ragr) with a 7.92% increase in poverty incidence. This group was initially the second poorest. The increase in the poverty depth and severity for this simulation is nevertheless greater for those in urban agricultural households (Uagr), that is, the poorest household group at the reference situation. It is also interesting that even if the effects on poverty are greater in terms of the impact on agricultural households residing in rural areas compared to those in urban areas, the variations in average revenue in these two groups are very similar (Appendix 5). This suggests that price effects play an important role for changes in poverty indices for rural agricultural households. We should note that this is true regardless of the
18
The results for each simulation and for each poverty index are available inAppendix 1.
19
This is consistent with negative variations in average revenues observed in Appendix 5. -2 0 2 4 6 8 10 12 14 16
sim1a Sim1b Sim2 Sim3 Sim4
Uagr Ragr Unagr Rnagr
simulation, but it is less marked in other cases. Households obtaining their income from a non-agricultural sector are less concerned. It can also be seen that reducing the VAT rate to 10% (simulation 1b) reduces the negative social repercussions of an expansion of the tax base compared to a 19% single rate (simulation 1a).
Considering a more realistic tax base by maintaining food crop agriculture under taxation is much less negative in terms of poverty variation (simulation 2). For a similar macroeconomic activity, the variation in the effect of poverty on rural agricultural households drops from 7.92% to 3.37%. The increase in the depth and severity indices is also much weaker. We should note that our results are significant only for the groups of rural farmers and non-agricultural urban groups.
Establishing a dual VAT rate by taxing food crop agriculture at a reduced rate of 5% (simulation 3) amplifies all poverty impact for all groups except for rural non-farmer, compared to the initial situation and compared to simulation 2. Indeed, poverty incidence increases by 5.83% for the group of rural agricultural households, i.e. 2.46 percentage points more than simulation 2. It should be noted that the negative social impact of this VAT system is nonetheless weaker with a single-rate VAT of 10%. When compared to uniform rate, allocating taxes on all goods increases poverty even when the full rate of this system (11.4%) is higher than the uniform rate (10%).
Finally, if we compare simulation 4 with simulation 1b without budget neutrality, we can see that putting into place a dual-rate VAT system will imply that the government will favour one group over another. The difference in terms of poverty increase primarily affects rural farmers. Maintaining the reduced rate in food crop agriculture, thus permitting support of agricultural activity and hence revenues, increases the poverty of this group in lesser proportions than the single rate of 10%. Urban non-farmers for their part are more affected by the dual rate, which follows the same logic.
The establishment of a reduced rate of 10% (simulation 1b) or multiple rates (simulation 3) reduce inequalities among rural households regardless of their activity, as well as among urban non-farm households. It is difficult to define what type of VAT system is preferable between simulation 1b and 3, despite the fact that the single rate allows a greater reduction in inequalities within the group of rural farmers. Simulation 2, maintaining VAT exemptions in food crop agriculture, does not provide significant information when it comes to the modification of inequalities, which prevents concluding on the benefits of this fiscal policy on this criteria (
Figure 2).
Figure 2: Variation in the Gini index (%)
20Authors' calculations, results of the micro simulation on DASP
Although restoring the VAT rate would be socially costly compared to the initial situation, we can see that the distributional impact of the VAT differs according to the system implemented in the country. As for the impact on poverty, we can conclude that the establishment of a single-rate VAT associated with maintaining exemptions in food crop agriculture is preferable for all social groups identified, since the negative effect proves to be the weakest. Moreover, the reduction observed in inequalities suggests that although the number under the poverty line would be higher, it may be possible to target a larger number of households during the establishment of compensatory measures favourable to the poor.
4. Conclusions
This study has sought to describe the distributional impacts of expanding the tax base to encompass agricultural goods by considering various potential taxation systems. To do so, we built the first CGEM micro-simulation for Niger and performed a rich distributional analysis of a VAT reform in a developing country using this tool. Three main lessons emerge from our application.
First, the end of VAT exemptions is necessary to develop the industrial sector, which has a strong ripple effect on the rest of the economy. Nonetheless, maintaining VAT exemptions in food crop agriculture sectors associated with a tax base expansion in the remaining sectors is preferable for the agriculture expansion. On the first hand, this fiscal
20
The complete results and significance for each simulation are available in table form in Appendix 6. -2,00 -1,50 -1,00 -0,50 0,00 0,50
Sim1a Sim1b Sim2 Sim3 Sim4
Uagr Ragr Unagr Rnagr
choice avoids an increase in the tax burden on consumers which support demand. On the other hand, agriculture being a sector that uses little intermediate consumption, the tax burden tied to VAT exemptions is weak for the producer, which maintains the level of activity of this sector and hence the remuneration of farmers. The net distributional impact of VAT exemptions depends on the economic structure economic sectors and the initial tax burden on intermediate consumption. Furthermore, irrespective of the VAT system chosen, one must correctly apply the zero rate of VAT to avoid creating distortions between sales on the local market, where the VAT is neutral, and exportation.
Secondly, the model shows that applying a pure VAT structure conforming to the theory (simulation 1b) is preferable in terms of economic growth whereas applying a reduced-rate on food crop agriculture lightens the negative distributional impact of the elimination of exemptions compared to a single rate (simulation 4). The pure VAT structure induces an increase in poverty especially for rural farmers, the largest and second poorest group in Niger. Both simulations without imperfection in VAT application are border case.
Finally, when we take into account budget neutrality, we can see that maintaining VAT exemptions in food crop agriculture (simulation2) is the most judicious choice compared to a 5% VAT rate taxation of goods produced by this sector (simulation3). It is not the multiple rate VAT that is more progressive but the one with the tighter fiscal base
It must be kept in mind that all of our results relative to the establishment of a single rate, multiple rates, or exemptions on certain goods depend on the ability of the Nigerien’s tax authorities to control and reimburse VAT credits. To date, no study has evaluated the administrative cost of implementing the above-described VAT systems in developing or developed countries.
We intend to pursue this analysis by modifying certain hypotheses of the model and introducing different market structures in certain sectors of the economy. This will allow us to take into account the power of retailers and/or producers to determine market prices.
5. References
Alderman, H. (2002) Subventions en tant que filets sociaux de sécurité : efficacité et défis, Série d’introduction aux filets sociaux de sécurité, Washington, DC : World Bank. Armington, P. (1969) A Theory of Demand for Products Distinguished by Place of
Production, Staff Paper- International Monetary Fund, 16: 159-176.
Ballard, C.L., Don Fullerton, J.B Shoven and J. Whalley (1985) A general Equilibrium Model for Tax Policy Evaluation. National Bureau of Economic Research Monograph, The Universitu of Chicago Press, Chicago.
Ballard, C.L., Shoven (1987) The Value added Tax: A general equilibrium look a its efficiency and incidence. In Feldestein (Ed.) The effects of taxation on capital accumulation (pp.105-107). Chicago : University of Chicago Press.
Bonjean, C., G. Chambas (2001) « Le paradoxe de la fiscalité agricole en Afrique sub-saharienne », Revue Tiers Monde, vol. 42, issue 168 : 773-788
Bovenberg, A.L. (1987) “Indirect Taxation in Developing Countries: A General Equilibrium Approach”, Staff Papers - International Monetary Fund, 34(2): 333-373.
Burgess, R., N. Stern (1993) “Taxation and development”, Journal of Economic Literature 31: 762-830.
Chambas, G. (2005) « TVA et transition fiscale en Afrique : les nouveaux enjeux », Afrique contemporaine, 215(3), pp.1-181.
Cockburn, J. (2004) "Trade Liberalisation and Poverty in Nepal A Computable General Equilibrium Micro Simulation Analysis," Development and Comp Systems 0409012, EconWPA
Clarete, R.L., J. Whalley (1987) “Comparing the marginal welfare costs of commodity and trade taxes”, Journal of Public Economics, 33(3): 357-362.
Decaluwe, B., A. Marten, L. Savard (2001) La politique Économique du Développement, Montréal: Université Francophone-Presse de l’Université de Montréal.
Decaluwe, B., A. Patry, L. Savard and E. Thorbecke (1999) Poverty Analysis Within a General Equilibrium Framework, CREFA Research Paper 99/06.
De Melo, J. (1998) “Computable General Equilibrium Model for trade policy analysis in developing contries: a survey”, Journal of Policy Modeling, 10(4): 469-503.
Directive n°02/ 98/CM/UEMOA du 22 décembre 1998 portant harmonisation des législations des Etats membres en matière de TVA et n°03/98/CM/UEMOA sur les droits d’accise. Ebrill, L., M. Keen, J.P. Bodin and V. Summer (2001) The Modern VAT Washington, DC:
International Monetary Fund.
Emini, C.A. (2000) Analyse de l’incidence d’une TVA imparfaite à l’aide d’un modèle calculable d’équilibre général : Application au cas Camerounais, CREFA Research Paper 00/06, Université de Laval, Québec, Canada.
Filmer, D., J. Hammer and L. Pritchett (1998) Health policy in poor countries: weak links in the chain, Working paper No. 1874, Washington DC: World Bank.
Foster, J., J. Greer and E. Thorbecke (1984) A Class of Decomposable Poverty Measures. Econometrica, 52(3): 761-66.
Gauthier, B., R. Reinikka (2007) Methodological Approaches to the Study of Institutions and Service Delivery: A Review of PETS, QSDS and CRCS, African Economic Research Consortium framework paper, The World Bank, september, mimeo.
Gautier, J.F. (1999) Les paradoxes de la TVA dans un pays en développement : l'illustration de l'industrie malgache. Tiers-Monde, 40(157) : 187-211.
Gautier, J.F. (2001) Taxation optimale et réformes fiscales dans les PED: une revue de littérature tropicalisée, DIAL, Research Paper 2001/02.
Giesecke, J a., and T. H. Nhi (2010) “Modelling value-added tax in the presence of multi-production and differentiated exemptions.” Journal of Asian Economics 21, no. 2: 156-173.
INS, Ministère de l’économie et des finances, Niger (2008) L’analyse de la politique fiscale au Niger et ses impacts sur la pauvreté.
INS, Niger, (2006) Questionnaire des Indicateur de base du bien-être (QUIBB_2005), Profil de pauvreté.
Serra-Puche, J. (1984) « A general Equilibrium Model for Mexican Economy », in H.E. SCARF and J.B. Shoven (eds, 1984): Applied General-Equilibrium Analysis, Cambridge Unversity Press, Cambridge: 447-482.
Savard L. (2005) Poverty and Inequality Analysis within a CGE Framework: A Comparative Analysis of the Representative Agent and Microsimulation Approaches. Development Policy Review, 23(3): 313-331.
Shoven, J.B., J. Whalley (1984) Applied General-Equilibrium Models of Taxation and International Trade: An Introduction and Survey. Journal of Economic Literature, 22(3): 1007-1051.
Shoven, J.B., J. Whalley (1977) Equal yield tax alternatives: General équilibrium computational techniques. Journal of Public Economics, 8(2): 211-224.
Toh, M., Q. Lin (2005) An evaluation of the 1994 tax reform in China using a general equilibrium model, China Economic Review, 16(3): 246-270.
UEMOA (2008) Report : l’évaluation de l’application des directives de l’UEMOA, portant harmonisation des législations des Etats membres en matière de taxe sur la valeur ajoutée et de droits d’accises.
6. Appendix
Appendix 1: Presentation of the sectors of the Nigerien economy
Food crop agriculture
Export
agriculture Industry Services Trade Total
Mi/Qi 11.13 6.89 43.3 18.53 Mi/M 10.42 4.48 85.1 100 EXi/XSi 25.32 30.57 13.14 EXi/EX 31.36 68.64 100 VAi/VA 21.4 19.3 20.4 23.9 15.1 100 VAi/XSi 91.7 85.4 49.9 65.0 100 XSi/XS 16.8 16.3 29.5 26.5 10.9 100 LDi/LD 21 19 21 23 15 100 KDi/LD 23 29 5 30 13 100 LDi/VAi 93 91 98 92 95 KDi/VAi 7 9 2 8 5
I: sectors, Mi: imports, EXi: exports, Qi: quantity of available goods in the economy, VAi: value added, XSi: Production, LDi: labour factor demand, KDi: capital factor demand.
Authors’ calculations, SAM 2004
Appendix 2:
Presentation of equations for calculating VAT rates in the initial situation( )
∑ ( )
∑
Sum of total VAT revenues in the SAM
Appendix 3:
Matrix of technical coefficientsFood crop agriculture Export agriculture Industry services
Food crop agriculture 0.12 0.16 0.10 0.3
Export agriculture 0.1 0.23 0.12 0.2
Industry 0.49 0.54 0.56 0.46
Services 0.38 0.7 0.21 0.49
Authors’ calculations, SAM 2004
Appendix 4:
Elasticities used in this model
Food crop
agriculture Export agriculture Industry Service
Sigma 0.6 0.6 0.6 0.6
Sigmam(1) 0.8 0.8 0.8 0.8
Sigmae(2) 0.4 0.4
(1) is the substitution elasticity of the Armington function (CES) for imports and (2) is the transformation elasticity of the CET function for exports.
Appendix 5
: Variation of real average income of household groups (%)yr_sim1a yr_sim1b yr_sim2 yr_sim3 yr_sim4
Uagr -24.72 -13.73 -8.12 -11.37 -13.96
Ragr -28.88 -16.33 -5.64 -11.58 -13.68
Unagr -12.84 -5.67 -5.27 -5.99 -8.28
Rnagr -8.38 -3.24 1.70 -1.17 -1.75
Authors’ calculations
Appendix 6:
Simulation results in terms of povertyUagr Ragr Unagr Rnagr
sim1a FGTO 11.94** 15.46** 5.91** 3.99** FGT1 12.20** 12.05** 3.40** 3.21** FGT2 9.56** 8.38** 1.89** 1.87** Sim1b FGTO 4.21* 7.92** 1.86** 0.31 FGT1 6.37** 6.05** 1.01** 0.71** FGT2 4.84** 4.00** 0.47** 0.28* Sim2 FGTO 1.53 3.37** 1.37** -1.42 FGT1 3.71** 2.10** 0.77** -0.93** FGT2 2.72** 1.27** 0.34** -0.68** Sim3 FGTO 1.87** 5.83** 1.89** -0.90 FGT1 5.17** 4.22** 0.95** -0.06* FGT2 3.87** 2.70** 0.44** -0.19 Sim4 FGTO 4.22* 6.99** 3.78** -0.29 FGT1 6.34** 5.15** 1.58** 0.28 FGT2 4.83** 3.33** 0.81** 0.01
Authors' calculations, results of the micro simulation on DASP. **significant for a threshold of 5%, *significant for a threshold of 10%.
Appendix 7:
Simulation results in terms of inequalitiesNiger Uagr Ragr Unagr Rnagr
sim1a 0.64** 0.37 -1.86** -0.01 -0.30
Sim1b 0.14 0.08 -1.06** -0.43* -0.77**
Sim2 -0.11 -0.19 -0.02 -0.29 -0.45
Sim3 -0.07 -0.13 -0.60** -0.44** -0.70**
Sim4 -0.05 -0.12 -0.62** -0.33 -0.58
Authors’ calculations **significant at 5%, * significant at 10%.
Appendix 8:
Equations of the computable general equilibrium model and glossary of variables and parameters Sets:
=Products/branches; =Export sectors; =Import sectors; =Non-export sectors; Non-import sectors; = Trade sector; =Non-trade sectors; representative agent
Parameters:
Technical coefficientScale coefficient of the production function Parameter of the production function Exponent of the production function Substitution elasticity labour capital Share of i in investment
Parameter of the government expenditure function Propensity to consumption of household H
Propensity to consume good i of household h
Incompressible consumption in good i of household h Proportion of income from labour of household h Proportion of income from capital of household h Proportion of income from public sector of household h Parameter of the CET function
Parameter of the CES function Weight of the CET function Weight of the CES function