RESEARCH OUTPUTS / RÉSULTATS DE RECHERCHE
Author(s) - Auteur(s) :
Publication date - Date de publication :
Permanent link - Permalien :
Rights / License - Licence de droit d’auteur :
Institutional Repository - Research Portal
Dépôt Institutionnel - Portail de la Recherche
researchportal.unamur.be
University of Namur
The structure of intra-party competition within Belgian lists
Dodeigne, Jérémy; Pilet, Jean-Benoit
Publication date:
2021
Document Version
Early version, also known as pre-print
Link to publication
Citation for pulished version (HARVARD):
Dodeigne, J & Pilet, J-B 2021, 'The structure of intra-party competition within Belgian lists: What can real ballots tell us about the dispersion of preference voters?', Paper presented at ECPR Joint Sessions of Workshops 2021, Virtual Event, Virtual event, 17/05/21 - 25/05/21 pp. 1-17.
General rights
Copyright and moral rights for the publications made accessible in the public portal are retained by the authors and/or other copyright owners and it is a condition of accessing publications that users recognise and abide by the legal requirements associated with these rights. • Users may download and print one copy of any publication from the public portal for the purpose of private study or research. • You may not further distribute the material or use it for any profit-making activity or commercial gain
• You may freely distribute the URL identifying the publication in the public portal ?
Take down policy
If you believe that this document breaches copyright please contact us providing details, and we will remove access to the work immediately and investigate your claim.
ECPR Joint Sessions of Workshops – May 2021 Intraparty Competition in Comparative Perspective
Virtual conference
The structure of intra-party competition within Belgian lists: what can real ballots tell us about the dispersion of preference voters?
Jérémy Dodeigne (Université de Namur) [email protected]
Jean-Benoit Pilet (Université libre de Bruxelles-ULB) [email protected]
*** This is our very first version of the paper, comments and suggestions are welcomed ***
Introduction
There has been a growing interest over recent years of intraparty competition within list PR systems allowing voters to cast preference votes. One of the main research goals has been to understand under which conditions we might observe the following three scenarios (Dodeigne & Pilet 2019): (1) a centralization of party competition with a leader attracting most preference votes; (2) an oligarchization of party competition, with a few candidates attracting most preference votes, and (3) decentralization of party competition with preference votes being spread across many candidates, from the most prominent to the less visible ones.
From the perspective of voters’ behaviour, scholars have relayed on survey data in which voters are asked for which candidates they have cast a preference vote, and why (see Wauters et al. 2020 for a review on the Low countries). Another strand in the literature has examined the perspective of candidates by using aggregate electoral results: scholars calculate to what extent preference votes are dispersed, or rather concentrated, over candidates within the list (Katz and Bardi 1980, Wildgen 1985, Villodres 2003, Arter 2013, Dodeigne and Pilet 2021). The number of preference votes obtained by candidates were also studied to understand which candidates’ characteristics provide a vote-earning capacity advantage (Maddens and Putte 2013, Van Erkel and Van Aelst 2016). Insights from these approaches have permitted to empirically highlight critical dimensions of the nature of intraparty competition within list PR systems.
In this paper, we provide a new approach to the question by relying directly on a large sample of genuine ballot papers that we have been granted access to during few weeks after the 2018 local elections in Wallonia (Belgium). In total, we have been able to consult and to recorde data from 47.239 electoral ballots, covering 4.906 candidates campaigning on 188 lists of candidates within 57 municipalities. This sample of ballots provide a unique opportunity to study – beyond the curtains of the voting booths – how voters support differently distinct types of candidates. It allows us (1) to examine how much preference votes voters cast and for which candidates, and (2) to understand what factors tend to increase (or limit) the number of preference votes cast. On that basis, we shed a new light on the debates on intraparty competition in list PR systems allowing for preference votes. We identify the factors leading voters to centralize intraparty competition by casting a vote on a single candidate, and in particular to the leader of the list. And we compare this behaviour with voters who rather support a few (up to five) or multiple candidates (six and more candidates).
The paper proceeds as follows. We start by a literature review on earlier studies on intraparty competition and on preference votes in order to develop various hypotheses that explain variance in candidates’ electoral success. We then shortly present the context of the 2018 local elections in Belgium and of the open list PR system with multiple preference votes that is used. In the third section, we present our unique dataset of ballot papers. We then move to analysing them. In the fourth section, we report on the number of preference votes cast by Walloon voters and assess the relevance of the factors affecting the number of votes cast. We conclude by discussing how these findings might affect the literature on intraparty competition in list PR system.
1. Intraparty competition and preference voting: a literature review
Most list PR systems allow voters to cast preference votes for one or several candidates. Only closed list systems (used in Spain, Portugal and Israel, for example) do not allow for such a
choice. In other list PR systems there is, therefore, a direct competition between co-partisans running on the same list. For any candidate, convincing a voter is not only convincing a voter to cast a vote for his/her party, but also persuading to vote for him/her personally. In other words, the personal vote-earning capacity matters to decide which candidates will receive the seats won by the party list. Building upon these premises, a growing body of literature has developed over recent years to study and understand the dynamics of intraparty competition under list PR systems allowing for preference votes. Several lines of research have been pursued.
First, several authors have discussed conceptually what kind of configurations of intraparty competition could be identified. They have especially connected the study of intraparty competition to the literature on the personalization of politics. On this topic, Balmas and colleagues (2014) have stressed the importance to conceptually distinguish between centralized and decentralized personalization. The earlier refer to a growing importance of party leaders within parties, while the later points at the growing dispersion of power within parties towards a great variety of individual politicians, from the most prominent to the less visible ones. In terms of intraparty competition, a centralization would mean that one actor, the leader, dominate strongly electoral competition within the list by attracting most votes and most attention. By contrast, a logic of decentralization would mean that nobody dominates, but that votes within the list are spread across many candidates. In between these two logics, a few earlier studies have pointed at an intermediate situation. Personalization would not empower all politicians (decentralized), nor party leaders only (centralized), but a small set of top politicians (Ohr, 2011: 30; Holtz-Bacha, Langer and Merkle, 2014: 164). Lindqvist (2018) suggests referring to this trend under the label of ‘elitization’. Dodeigne and Pilet (0219) label it as ‘oligarchization’.
A second line of research has, more empirically, explored which voters tend to cast preference votes more often, and for which reasons. Such an approach normally builds upon either voter surveys (Andeweg and Van Holsteyn 2012; Andre et al. 2012) or experimental data (Nagtzaam and Van Erkel 2017, Christensen et al. 2021). It has allowed to examine two things. First, how voters use their preference votes, that is for whom they vote (Holli and Wass 2010, Teney et al. 2010, Wauters et al. 2018, Marien, Wauters, & Schouteden, 2017, Janssen et al. 2017). Second, when they can cast multiple preference votes, do they do it, and to what extent (Wauters et al. 2015, Wauters 2021)? On the later aspects, it appears that voter divide between those casting a vote for the leader only, or for the leader a few candidates, versus voters casting preference votes for one or several less visible candidates. The two questions are relevant for the broader debate on the nature of intraparty competition in its different forms (centralized, decentralized, oligarchized). Voters casting one or a few preference votes for a leader or a few prominent candidates concur to the centralization or oligarchization of intraparty competition. By contrast, voters casting many preference votes for a wide range of candidates, or preference vote only for second-order candidates would rather contribute to the decentralization of party competition.
Finally, another body of research has examined empirically which candidates appear to benefit the most from preference voting. Some studies have looked at it by considering candidates’ performance in the election. This logic is first found in studies that have studied, and tried to quantify, the nature of intraparty competition within lists to capture how many candidates dominate, and to what degree preference votes within the list are concentrated around a few candidates. In this wake, Katz and Bardi (1980) suggested calculating how preference votes were dispersed among three subsets of candidates: top-of-the-list candidates,
middle candidates positioned just below them, and lay candidates positioned at the bottom of the list. This typology evaluated whether intra-party competition was dominated by a single leader, concentrated around a few candidates, or dispersed over many candidates. Other authors proposed rather to use indicators such as a GINI index of preference votes concentration (Wildgen 1985, Villodres 2003, Arter 2013). More recently, Dodeigne and Pilet (2021) combined a GINI index with another indicator, the Effective number of candidates. The latter measure is directly inspired from Laakso and Taagepera (1979) effective number of parties.
Another way candidates’ performances have been analysed to study intraparty competition is by looking at which factors could influence the amount of preference votes obtained by candidates. Several factors have been isolated. In particular, it appears that established politicians, incumbents, tend to receive more preference votes (van Holsteyn and Andeweg, 2012, Thijssen, 2013, Maddens and Put 2013, Górecki and Kukołowicz 2014). It is even more salient for party leaders and the most prominent politicians such as ministers (Wauters et al. 2018). The incumbency advantage is due to the greater notoriety of incumbents among voters, but also to several indirect competitive advantages of incumbents and leaders for getting more preference votes. They often tend to occupy higher position on the list (Van Erkel and Van Aelst 2016, Söderlund et al. 2021). They can spend more money in campaign (Maddens 2006, Maddens and Put 2013). They receive more media attention (Van Aelst et al. 2008; Van Erkel et al. 2020). Other studies have underlined that some sociodemographic characteristics of candidates might affect the share of preference votes received. In particular, candidates’ gender or ethnic background appear to affect their electoral performance within list. Yet, findings are not univocal regarding the direction of the relationships. Some studies would argue that male and native candidates tend to overperform female and ethnic minority candidates on average (Wauters, Maddens and Weekers 2010, Bergh and Bjorklund 2013). Yet, others would rather show that when controlling for factors such as incumbency, media attention or list position, the imbalance disappears (Thijssen and Jacobs 2004, Thijssen 2013). It could even be that female and ethnic minority candidates would attract more votes because they attract support from some voters would want to vote only for women or for ethnic minority candidates (Erzeel & Caluwaerts, 2015; Holli & Wass, 2010; Van Erkel 2019, Janssen 2020). Finally, a few studies have shown that candidates’ ideology, and in particular deviating a bit from party line might help candidates in attracting more preference votes (Isotalo et al. 2020).
What is interesting in such studies for the broader discussion on the degree of centralization of intraparty competition is that they point at some factors that could push for more decentralization with a dispersion of preference votes, while others would concur to more centralization and concentration. For instance, factors such as gender and ethnicity or ideological distance can be mobilized by many candidates. They would therefore lead to voters spreading voters across more candidates, and to more decentralization. By contrast, factors such as incumbency, leadership, list position, media attention, or campaign expenses tend to give a competitive advantage to a few candidates and would therefore push for some form of oligarchization or even centralized personalization.
2. Exploring preference voting on basis of ballot papers: hypotheses
All the above-mentioned studies rely on two sources of data: aggregate electoral results in terms of preference votes or survey data that includes questions on how many preference votes respondents have cast, and for which candidate(s). Aggregate scores in preference votes are interesting since they cover all votes. Yet, they do not provide direct information on how specific voters have spread their votes on the ballot. We do not know precisely how many voters
have cast a voted one single vote, and for whom, nor how many have cast a vote for several candidates, and with which profile. Survey data could provide more information in that respect, but they only provide a limited number of observations as most election study would only include a few thousands respondents.
In the present study, we propose a new approach thanks to a dataset of over 50,000 ballots cast on the 2018 local elections in Wallonia (Belgium). Such a unique dataset provides a great opportunity to understand more precisely what share of voters opt for single preference voting, for limited preference voting and for extensive preference voting. The dataset also contains detailed information on the characteristics of candidates, of the list they belong to, and of the municipality in which they run for elections. We would therefore be able to explore which factors are more often associated to which type of preference voting (single, limited multiple, extensive multiple).
And for answering this latter question, we can try to build up hypotheses on the basis of the literature presented in the previous section. A first range of factors appear to be the characteristics of candidates themselves. Some factors are resources only available to a few candidates, and therefore concurring to voters casting one or a few preference votes. The primary resource in that respect is holding an electoral mandate prior to running at elections. It could be a local mandate such as mayor, aldermen, CPAS presidents, local councillors, or a mandate at an upper level (regional, federal, and European) such as MP or minister. As elaborated above, it indeed appears that incumbent tend to attract more preference votes (van Holsteyn and Andeweg, 2012, Thijssen, 2013, Maddens and Put 2013, Górecki and Kukołowicz 2014). Established politicians, and in particular the more prominent, have also been shown to lead to some form of centralization or oligarchization of party competition (Wauters et al. 2018, Dodeigne and Pilet 2021). We can therefore formulate the following hypotheses:
H1. Incumbent politicians would obtain more often votes from voters casting one
or a few preference votes than other candidates.
H2. Prominent politicians (local mayor, MP and ministers) would attract more
voters casting one or a few preference votes than other candidates.
In the same logic, earlier studies have shown that candidates position higher on the list benefit from a competitive advantage over other candidates placed below on the list (Van Erkel and Van Aelst 2016, Söderlund et al. 2021). We would therefore formulate the following hypothesis.
H3. Candidates positioned higher on the list would attract more voters casting one
or a few preference votes than candidates with a lower position on the list.
By contrast, another set of candidates’ characteristics would rather be associated with less concentration of preference votes. It is especially the case of candidates’ gender and ethnic background, which could lead some voters to cast preference votes in blocks for several ethnic minorities or female candidates (Teney et al. 2010, Marien, Wauters, & Schouteden, 2017). It would lead to the following hypotheses:
H4. Female candidates would attract more voters casting extensive multiple
H5. Foreign candidates would attract more voters from voters casting extensive
multiple votes than Belgian candidates.
Lists’ characteristics may also affect the nature of intraparty competition as Wauters, Van Aelst, Thijssen and Pilet (2018) have demonstrated. Established parties are associated with a lower concentration of preference votes. It is the case for older parties, parties who have been in power and in larger parties. Such parties have had the time to consolidate a greater number of candidates that voters would be familiar with. It could lead to the following hypotheses:
H6. Candidates running on lists that were in the incumbent local majority between
2012 and 2018 would attract fewer voters casting a single or a few preference votes than candidates of the opposition.
H7. Candidates on emerging lists would attract more voters casting a single or a
few preference votes than other party lists.
H8. Candidates from local lists would attract more voters casting a single or a few
preference votes than other party lists.
H9. Candidates from smaller lists would attract more voters casting a single or a
few preference votes than larger parties.
Finally, Dodeigne and Pilet (2021) have demonstrated that intraparty competition was also influenced by the context of the elections. Elections at lower tiers of government and in smaller districts tend to show higher levels of concentration of preference votes. We might expect to observe the same trend across Walloon municipalities. We can therefore formulate the following hypothesis.
H10. Candidates running in the largest municipalities would attract lower voters
casting a single preference vote than candidates from the smallest municipalities.
3. The 2018 local elections in Belgium: case selection and data collection
The 2018 local elections in Wallonia were organized under open list PR with multiple preference votes allowed. Voters can decide to vote on top of the list or to vote for minimum one and maximum as many candidates as there are seats to be filled within the list. Lists and preference votes are aggregated to allocate seats between lists (according to the Imperialli quota). Only preference votes are then considered for allocating seats within lists between co-partisan candidates. Seats within lists are allocated to candidates with the highest number of preference votes, irrespective of their initial position on the list. It was the first time local elections were held with fully open lists in Wallonia (Belgium). Prior to the 2018 elections, a flexible list system was ever in place (Dodeigne, Pilet and Talukder 2020).
As we discussed above, preference votes are typically studied via (1) aggregate scores in preference votes of candidates, or (2) on the basis of survey data asking respondents for which candidate(s) they have voted. With the first method, we can estimate the number of preference votes cast on a party list, but we do not have information on how voters cast those votes between candidates. Heuristically, the use of electoral surveys – and in particular mock ballots – has been a fruitful alternative research tool to better understand voters’ behaviour
(Jacobs et al., 2014; Marien et al., 2017). Despite the respective merits of such analyses, the final number of voters surveyed remain ultimately limited to a few thousands. It means that the number of respondents per lists is small, especially for smaller lists and in smaller municipalities. Robust analyses are, therefore, extremely reduced.
To overcome this issue, researchers need access to real electoral ballots. Thanks to a collaboration with the Walloon Administration that has organized the 2018 local elections, we were granted such an exceptional access at the 2018 local elections in Wallonia. During a short window of opportunity of two months after the election and until the final destruction of the ballots (as required by the electoral legislation), we gathered an original dataset covering a representative sample of 51,198 electoral ballots (47,239 once blank votes are removed). The sampling procedure was set in four steps.
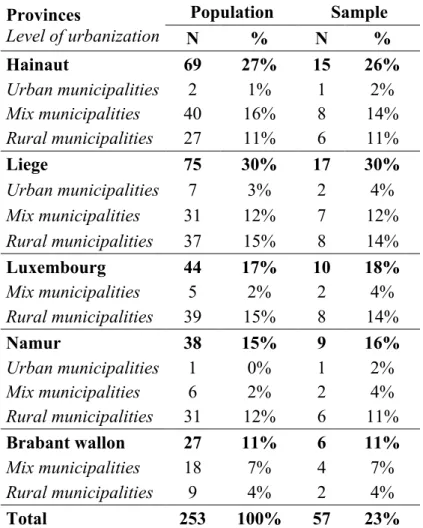
Figure 1. Geographical distribution of the sample Provinces Level of urbanization Population Sample N % N % Hainaut 69 27% 15 26% Urban municipalities 2 1% 1 2% Mix municipalities 40 16% 8 14% Rural municipalities 27 11% 6 11% Liege 75 30% 17 30% Urban municipalities 7 3% 2 4% Mix municipalities 31 12% 7 12% Rural municipalities 37 15% 8 14% Luxembourg 44 17% 10 18% Mix municipalities 5 2% 2 4% Rural municipalities 39 15% 8 14% Namur 38 15% 9 16% Urban municipalities 1 0% 1 2% Mix municipalities 6 2% 2 4% Rural municipalities 31 12% 6 11% Brabant wallon 27 11% 6 11% Mix municipalities 18 7% 4 7% Rural municipalities 9 4% 2 4% Total 253 100% 57 23%
First, we created a representative sample of 57 Walloon municipalities of the 253 municipalities on three criteria (population size, degree of urbanization based on Eurostat classification), and the structure of party competition (according to the comprehensive analysis of Close, Dodeigne, Jacquet Matagne 2020). Secondly, within each municipality, we randomly drew a number of vote-counting stations. Votes counting stations are the bureaus where electoral votes from three polling stations are stored, merged, and counted by elections officials. Within each municipality, the number of votes counting stations selected varies from 2 to 9, depending on the population size of a municipality. Thirdly, we randomly selected large bags
in which ballot papers are stored. Within those bags, ballot papers are stored in envelopes. The content of an envelope is determined by the list that obtained the vote and divided as such within the large bags, for valid ballots. The last step of the sampling procedure was to randomly draw a sample of ballots within envelopes. Finally, we completed the dataset with variables at the candidate, list and the municipality levels (e.g. type of parties, size of the municipality, profile of candidates).
Although our case selection primarily rests upon the unique opportunity of accessing real ballots, studying intra-party competition for local elections in Wallonia presents several merits for our research goals. Previous studies on intra-party competition for local elections in Wallonia has, for instance, established that they could be seen as an extreme case of intense competition among co-partisans running on the same lists (Dodeigne et al. 2020). And extreme cases are of particular interest to explore and test causal mechanisms (Gerring 2001). Moreover, Wallonia has just shifted to fully open lists for the recent 2018 local elections. This new rule may be expected to intensify even further between candidates within a list to secure a seat.
4. Descriptive statistics on voters’ behaviors
Based on the unique dataset that we have just described; we hope we will provide a fine-grained understanding regarding about how Walloon voters’ behaviour casting preference votes. The first analysis we are proposing is descriptive and aims at understanding how many preference votes appear to be cast on the 51,198 ballot papers that we have collected and coded.
Firstly, we examine how voters behave in terms of the number of preference votes they cast. Five main groups of preference voters emerge (see table 1). The first group covers the majority of voters who opted for a single preference vote (52.2 percent). The size of the other four groups is substantially lower with a constant decreasing percentage of voters for each category (from 15.6 percent to 9.3 percent). Yet, we observe a slight increase for the last group (12.3 percent). The latter gathers voters who used in the most extensive way the possibility of preference votes casting six and more preference votes. These numbers tend to confirm the data gathered via former electoral surveys (but conducted at upper tiers of government) asking respondents how much preference votes they cast. Such studies have shown that between one-quarter and one third of voters cast only a single preference votes, while very few candidates cast more than 5 preference votes (see André et al., 2014).
Table 1. Distribution of preference votes cast according to different group categories Single pref vote 2 pref votes 3 pref votes 4-5 pref votes 6+ pref votes Total
% 52.2 15.6 10.4 9.3 12.6 100
N 24,654 7,352 4,895 4,379 5,959 47,239*
* The total number of ballots is lower than the original sample because of blank votes.
These first figures indicate that we may distinguish between three types of preference voters: - Single-preference voters: 52.2% of all ballots marked with at least one preference votes - Limited multiple preference voters (between 2 and 5 preference votes): 35.2% of all ballots; - Extensive multiple preference voters (supporting 6 or more candidates): 12.6% of all ballots; The three types of preference voters might have different implications for the dynamics of intraparty competition. Single-preference voters could either push for a centralization of intraparty competition in case voters would mostly support one candidate (the leader) or a few
more prominent candidates (oligarchization). They might also push for the decentralization of intraparty competition if they coordinate badly and spread their unique preference votes across many candidates.
Limited multiple preference voters could also have diverging effect. They would, by definition, not concur to a full centralization of intraparty competition as they vote for more than one candidate. But we do not know whether they would contribute to the emergence of an oligarchy of leaders within the list, or they would also spread their 2 to 5 votes over many different candidates. Block voting in favour of several female candidates or several ethnic minority candidates could contribute to such dynamics (Teney et al. 2010, Marien, Wauters, & Schouteden 2017).
Extensive multiple preference voters seem to be easier to read. They cast a lot of preference votes and therefore contribute to a decentralization of intraparty competition. Yet, what is unclear is whether they vote for one prominent politician (first on the list, incumbent mayor or alderman, national politician) and for many other candidates. Or would they rather vote for many candidates who are mostly among the less prominent candidates on the list? In order to understand it more precisely, we move to a series of multivariate regressions in the next section.
5. Results of the multivariate analyses
In the next step of the paper, we seek to determine which factors of the candidates, lists, and municipalities’ characteristics explain why some candidates managed to concentrate preference on their mere individual merit whereas other candidates have difficulties to emerge on the lists as their supporters mostly vote for them but in combination with other co-partisans. Our dependent variable is thus operationalized according to the main conclusions of the previous section distinguishing three main behaviors in terms of preference voting: (1) percentage of preference votes obtained individually, (2) percentage of preference votes obtained with two, three or four other candidates, (3) percentage of preference votes obtained with five and more other candidates.
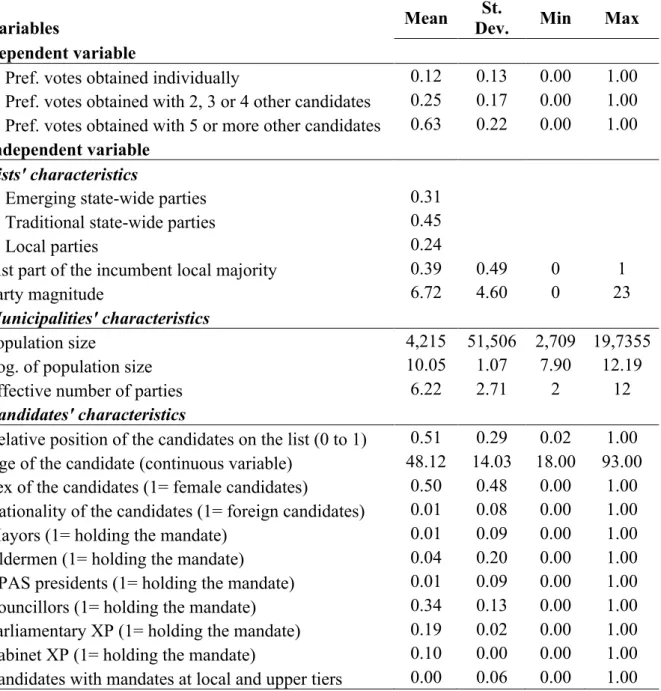
We carefully remind the reader that our vantage point has now shifted: while the previous section has analysed the electoral behaviour of 47,239 voters in terms of preference voting; we now seek to assess how their behavior impacts the concentration/dispersion of preference votes from the viewpoint of 4,906 candidates. In this respect, table 2 shows that candidates can rarely claim that their electoral success is due to their mere individual merit: on average, hardly 12% of their total number of preference votes is based on a single preference vote, and 25% are cast combination with up to four co-partisan candidates. As a matter of fact, most candidates’ electoral performance often reflects extensive multiple preference voting: 63% of the overall preference votes are obtained with five and more co-partisans. Interestingly, there is a significant variance between candidates as some of them obtained particularly higher scores in some of the three categories, it is this variance that we seek to explain via multivariate analysis.
In order to test our hypotheses, our dataset of ballots was combined with official information about municipalities’ characteristics available via the Walloon administration (IWEPS and DGO5). We also rely on information about the 2018 elections regarding party lists and party competition (Close et al. 2021) as well as candidates’ biographies (Dodeigne 2018;
Dodeigne, Teuber, Vandeleene 2020). Table 2 presents descriptive statistics for these different variables.
Table 2. Preferences votes obtained by mayor on the list according to voters’ electoral
behaviour
Variables Mean
St.
Dev. Min Max
Dependent variable
% Pref. votes obtained individually 0.12 0.13 0.00 1.00 % Pref. votes obtained with 2, 3 or 4 other candidates 0.25 0.17 0.00 1.00 % Pref. votes obtained with 5 or more other candidates 0.63 0.22 0.00 1.00
Independent variable
Lists' characteristics
% Emerging state-wide parties 0.31 % Traditional state-wide parties 0.45
% Local parties 0.24
List part of the incumbent local majority 0.39 0.49 0 1
Party magnitude 6.72 4.60 0 23
Municipalities' characteristics
Population size 4,215 51,506 2,709 19,7355
Log. of population size 10.05 1.07 7.90 12.19
Effective number of parties 6.22 2.71 2 12
Candidates' characteristics
Relative position of the candidates on the list (0 to 1) 0.51 0.29 0.02 1.00 Age of the candidate (continuous variable) 48.12 14.03 18.00 93.00 Sex of the candidates (1= female candidates) 0.50 0.48 0.00 1.00 Nationality of the candidates (1= foreign candidates) 0.01 0.08 0.00 1.00 Mayors (1= holding the mandate) 0.01 0.09 0.00 1.00 Aldermen (1= holding the mandate) 0.04 0.20 0.00 1.00 CPAS presidents (1= holding the mandate) 0.01 0.09 0.00 1.00 Councillors (1= holding the mandate) 0.34 0.13 0.00 1.00 Parliamentary XP (1= holding the mandate) 0.19 0.02 0.00 1.00 Cabinet XP (1= holding the mandate) 0.10 0.00 0.00 1.00 Candidates with mandates at local and upper tiers 0.00 0.06 0.00 1.00
Considering the structure of the data (4,906 candidates are nested in the 188 lists within municipalities), we specified a multilevel linear regression with a varying intercept for our three dependent variables, i.e. the average percentage of preference votes obtained individually, with two or four co-partisans and five and more other co-partisans. In this regression equation, β0j is the intercept, β1j to β15j are the regression slopes for the variables testing our ten hypotheses, and εij is the usual residual error term. The subscript j is for the lists within municipalities (j = 1...J ) and the subscript i is for candidates running on lists (i = 1...nj )1.
1 Note that at this stage of the paper, we have not observed significant interactions between candidates’ and lists’
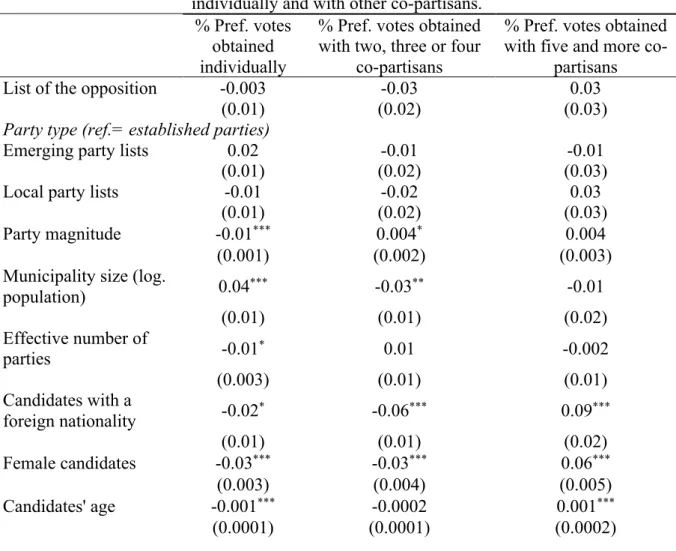
The results of the multilevel linear model are presented in Table 5 that assessed the impact of candidates, lists and municipalities’ characteristics on the share of candidates’ preference votes obtained individually and with other co-partisans. As predicted by our first two hypotheses, the candidates’ political capital has a statistically significant enhancing effect upon the concentration or the dispersion of preference votes on his/her candidacy. More interestingly, the results are particularly enlightening vis-à-vis the three concepts on intraparty competition we discussed above: centralization, oligarchization, and decentralization. While prominent politicians such as incumbent mayors, (national or regional) MPs and ministers tend to attract substantially much more preference votes on an individual basis than other candidates (respectively a positive effect of 15, 10, and 7 percentage points – i.e. more than one standard deviation); candidates with intermediary positions such as incumbent aldermen, CPAS presidents and local councillors present the strongest enhancing effects in small group voting with no more than 4 co-partisans. These latter findings seem to be in line with the oligarchization argument. Incumbent aldermen and councillors could be considered as mid-level politicians in terms of notoriety. They attract more votes than lay candidates and concentrate to some extent party competition, but do not manage to concentrate most of their preference votes on the mere candidacy (enhancing effects of their mandates are about twice lower for single preference votes), contrary to mayors, MPs or ministers.
By contrast, lay candidates without political capital are those who obtained the greatest shares of preferences votes when voters supported five or more other co-partisans (this is indicated by the negative for all variables associated with political capital in the third column, as candidates without political are the reference category of this binary variable). In that respect, these lay candidates concur to deconcentrate intraparty competition and to a more decentralized form of personalization.
The same kind of logic is observed with candidates’ relative positions on the list. As we have seen in the literature review, candidates positioned higher on the list, and especially on amongst the few eligible positions, tend to attract more preference votes (Van Erkel and and Van Aelst 2016). Yet, we do not know whether the higher aggregate scores in preference votes stem from ballots with one, a few or many preference votes. We have, however, hypothesized (H3) that candidates positioned higher on the list will attract more votes from single-preference ballots because they are more often the “big fish” of the party list, which should lead voters to exclusively vote for them (see Wauters et al. 2018). In our multivariate regression, the variable relative position must be read as follows: the higher the score, the lower the candidate’s position on the list (1 indicating the last position of the list). We observe that this variable has a negative effect on the proportion of preference votes received from ballot with one or a few presence votes. By contrast, it has a positive effect on the candidates’ share of ballots with multiple preference votes. In other words, candidates with lower positions on the lists attract on average lower percentage of voters casting preference votes for those candidates (or for him and few candidates). And the opposite holds for candidates with better positions on the list: those
Percentage of pref. votes obtained individually (or with other candidates) ij = β0j + β1j Incumbent majority j + β2j ENP j + β3j Party typesj+ β4j Party magnitude j + β5j Log. population j + β6j Nationality of candidates ij + β7j Sex of candidates ij + β8j Age ij + β9j Parliamentary XP ij + β10j Cabinet XP ij+ β11j Mayor ij
candidates tend to secure a higher proportion of voters casting preference votes exclusively for them. H3 is therefore confirmed.
H4 and H5 are about the differences between female and male candidates, and for candidates with nationalities other than the Belgian nationality. Our hypotheses suggested that female and ethnic minority candidates would receive mostly preference votes from voters casting extensive multiple preference votes. Here again, the multivariate regressions presented in table 3 confirms these expectations. Female and ethnic minority candidates do receive relatively fewer votes from ballot with single or a few preference votes, and relatively more from ballots with many preference votes - whereas Belgian male candidates are precisely advantaged in that category. In other words, with a lower percentage of single preference votes, those female and ethnic minority candidates face more challenges to emerge vis-à-vis their co-partisan candidates. And contrary to some expectations, the higher proportion of multiple preference votes is not necessarily an electoral advantage for those female and ethnic minority candidates because they hardly benefit from “bloc voting” in our sample (i.e. voting only for female candidates or ethnic minority candidates). As a matter of fact, we observe that there are even slightly more “men only preference votes” (2,8% of the voters), than “women only preference votes” (2,3% of the voters). In other words, not only do male candidates secure more individual preference votes than female candidates, but when “bloc voting” is observed it is also in favour of the former (albeit the differences are limited).
Table 3. Multilevel linear model predicting share of candidates’ preference votes obtained
individually and with other co-partisans. % Pref. votes
obtained individually
% Pref. votes obtained with two, three or four
co-partisans
% Pref. votes obtained with five and more
co-partisans
List of the opposition -0.003 -0.03 0.03
(0.01) (0.02) (0.03)
Party type (ref.= established parties)
Emerging party lists 0.02 -0.01 -0.01
(0.01) (0.02) (0.03)
Local party lists -0.01 -0.02 0.03
(0.01) (0.02) (0.03)
Party magnitude -0.01*** 0.004* 0.004
(0.001) (0.002) (0.003)
Municipality size (log.
population) 0.04*** -0.03** -0.01 (0.01) (0.01) (0.02) Effective number of parties -0.01* 0.01 -0.002 (0.003) (0.01) (0.01) Candidates with a foreign nationality -0.02* -0.06*** 0.09*** (0.01) (0.01) (0.02) Female candidates -0.03*** -0.03*** 0.06*** (0.003) (0.004) (0.005) Candidates' age -0.001*** -0.0002 0.001*** (0.0001) (0.0001) (0.0002)
Candidates cumulating mandates at local and
upper tiers 0.10 *** 0.09** -0.19*** (0.03) (0.04) (0.05) Candidates with councillor mandate 0.04*** 0.10*** -0.14*** (0.01) (0.01) (0.01) Mayors 0.16*** 0.08*** -0.25*** (0.02) (0.02) (0.03) Aldermen 0.06*** 0.14*** -0.19*** (0.01) (0.01) (0.01) Candidates with parliamentary XP 0.10*** 0.07*** -0.17*** (0.02) (0.02) (0.03)
Candidates with cabinet
XP 0.08** 0.03 -0.11**
(0.03) (0.04) (0.05)
Candidates with CPAS
president XP 0.05*** 0.12*** -0.18***
(0.02) (0.02) (0.03)
Relative position of the
candidates -0.07*** -0.10*** 0.16*** (0.01) (0.01) (0.01) Constant -0.11* 0.61*** 0.57*** (0.06) (0.11) (0.16) N candidates 4,906 4,906 4,906 N lists 188 188 188 Log Likelihood 3,581.01 2,959.18 1,746.20
Akaike Inf. Crit. -7,122.02 -5,878.35 -3,452.40 Bayesian Inf. Crit. -6,992.05 -5,748.39 -3,322.43 Key: *p<0.1; **p<0.05; ***p<0.01
We can now move to hypotheses related to the nature of the list on which candidates are running. We expect candidates campaigning on lists of the incumbent majority (H6), from emerging party lists (H7), from local lists (H8) and from smaller lists (H9) to present a relatively larger share of their preference votes from ballots with a single or a few preference votes. Here, findings are less neat. Candidates from emerging party lists receive relatively more votes from preference voters (H7). Candidates from larger parties receive fewer votes from single-preference voters, and a bit more votes from ballots with a few single-preference votes (2 to 5) (H9). For the other configurations (H6 and H8), there is no statistically significant effects. In other words, the effects seem less salient at the list-level than the candidates-level characteristics.
Finally, Dodeigne and Pilet (2021) have demonstrated that intraparty competition was also influenced by the context of the elections. Elections at lower tiers of government and in smaller districts tend to show higher levels of concentration of preference votes. H10 stems from that and suggests that in larger municipalities, candidates would receive fewer votes from single-preference ballots. Our findings do not really corroborate it. We can only see one difference that is statistically significant.
Discussion and conclusion
The goal of the paper was to shed a new light on voters’ behavior in open list PR system allowing voters to cast multiple preference votes. Analyses of such systems have so far relied on the study of the aggregate scores of candidates, or on survey data asking a few thousands voters to tell whether they have cast preference votes and for how many candidates. Yet, none of these approaches provide direct access to how precisely voters cast their preference votes on their ballot. Do they vote for one, several or many candidates? And what types of candidates do they support? For that, we need access to real ballots. It is what we have done in this study, having the chance to record more than 50,000 ballots of the 2018 local elections in Wallonia.
This unique dataset has first shown that there were three main types of preference voting behavior. First, about one half of all ballots are marked with a single-preference vote for a single candidate. Then, about a third of all voters cast a few preference votes between 2 and 5 candidates. Finally, a minority of voters, about 15 percent, cast preference votes for an extensive number of multiple candidates (6 or more).
On that basis, we have tried to assess to what extent factors at the level of candidates, lists and municipalities explain the variance observed in terms of a candidate’s relative share of single preference votes, of limited multiple preference votes and of extensive preference votes. Our findings suggest that the main drivers are related to the candidates’ profile. In particular, a candidate’s political capital is a decisive explanatory variable to explain the types of preference votes received. On the one hand, prominent politicians (incumbent mayors, MPs and ministers) do attract disproportionally more single-preference votes than all other types of candidates while mid-level politicians (aldermen, CPAS presidents and to a councilor) secure mostly preference votes via group voting – and to a lower extent (twice as lower), via single preference votes. On the other hand, lay candidates without specific political experience or visibility attract disproportionally more votes via ballots with extensive preference votes. The same trend is observed in relation to candidates’ positions on the list. Candidates with the better positions (close to the top of the lists) attract relatively more ballots with a single or a few preference votes, whereas candidates lower on the list attract votes from ballots with extensive preference votes. Regarding the human capital of candidates, it appears that female candidates and ethnic minority candidates attract more often votes from ballots with many preference votes. On opposite, our results indicate that Belgian male candidates are more likely to emerge in the electoral contests because they manage to concentrate more (single, or few preference votes) on their candidacy. Finally, the other factors, at list and municipality levels, have limited or nuanced impact, if any.
These elements bring interesting insights for the debates about intraparty competition. Established politicians concur to concentrate intraparty competition via the logic of centralized personalization (for the most prominent politicians) or of oligarchization (for mid-level politicians). By contrast, lay candidates without specific political capital seem responsible of decentralized personalization. In terms of human capital, specific sociodemographic traits (women, ethnic minorities) also contribute to deconcentrate intraparty competition, following the logic of decentralized personalization; whereas Belgian male candidates tend to trigger the logic of centralized personalization. These findings are not radically new. Yet, they are based for the first time on direct and robust evidence regarding how a large number of voters actually cast their vote on ballots in an open list PR system with multiple ballots. Last but not least, our findings confirm that the debate in the literature should move beyond the dichotomy between centralization and decentralization; and acknowledge the equal importance of the phenomenon of oligarchization in the dynamics of intraparty competition.
List of references
André, A., Wauters, B., & Pilet, J.-B. 2012. It's Not Only About Lists: Explaining Preference Voting in Belgium. Journal of Elections, Public Opinion and Parties, 22: 293-313.
Arter, D. 2013. The ‘Hows’, not the ‘Whys’ or the ‘Wherefores’: The Role of Intra-party Competition in the 2011 Breakthrough of the True Finns. Scandinavian Political Studies, 36 (2) : 99-120. Balmas, M., Rahat G., Sheafer, T. & Shenhav, S.R. 2014. Two Routes to Personalized Politics:
Centralized and Decentralized Personalization. Party Politics, 20(1): 37–51.
Bergh, J., & Bjørklund, T. 2011. The Revival of Group Voting: Explaining the Voting Preferences of Immigrants in Norway. Political Studies, 59(2), 308–327.
Christensen, H. S., Järvi, T., Mattila, M., & von Schoultz, Å. 2021. How voters choose one out of many: A conjoint analysis of the effects of endorsements on candidate choice. Political research exchange,
3(1). https://doi.org/10.1080/2474736X.2021.1892456
Dodeigne, J., & Pilet, J.-B. 2021. Centralized or decentralized personalization? Measuring Intra-party Competition in Open and Flexible list PR systems. Party Politics, 27(2):234-245.
Dodeigne, J., Close, C., & Teuber, F. 2020. Nationalisation of local party systems in Belgium (1976-2018): The combined effects of municipality size and parliamentary parties’ dominance. Local
Government Studies (Online first).
Dodeigne, J., Close, C., Jacquet, V., & Matagne, G. 2020. « Le scrutin communal : une affaire nationale ou locale ? », In Les élections locales du 14 octobre 2018 en Wallonie et à Bruxelles: une offre
politique renouvelée?, Dodeigne J., Close C, Jacquet V., Matagne G. (Eds.), Bruges: Vanden Broele,
pp. 32-57.
Dodeigne, J., Teuber, F., & Vandeleene, A. 2020. “La professionnalisation du scrutin communal de 2018 en Wallonie : loin d’une arène d’‘amateurs’, mais une professionnalisation en baisse”, In Les
élections locales du 14 octobre 2018 en Wallonie et à Bruxelles : une offre politique renouvelée?,
Dodeigne J., Close C, Jacquet V., Matagne G. Eds.), Bruges : Vanden Broele, pp. 149-174.
Dodeigne, J., Pilet, J.-B., & Talukder, D. 2020. Personnalisation des élections dans un contexte de fin de l’effet dévolutif, In Les élections locales du 14 octobre 2018 en Wallonie et à Bruxelles : une offre
politique renouvelée?, Dodeigne J., Close C, Jacquet V., Matagne G. (Eds.), Bruges: Vanden Broele,
pp. 175-215.
Dodeigne, J. 2018. Who governs? The disputed effects of regionalism on legislative career orientation in multilevel systems. West European Politics, 41(3): 728-753.
Erzeel, S., & Caluwaerts, D. 2015. Is It Gender, Ideology or Resources? Individual-Level Determinants of Preferential Voting for Male or Female Candidates. Journal of Elections, Public Opinion and
Parties, 25(3), 265–283.
Górecki, M. A, & Kukołowicz, P. 2014. Gender Quotas, Candidate Background and the Election of Women: A Paradox of Gender Quotas in Open-List Proportional Representation Systems. Electoral
Studies, 36: 65-80.
Holli, A. M., & Wass, H. 2010. Gender-based voting in the parliamentary elections of 2007 in Finland.
European Journal of Political Research, 49(5), 598–630.
Isotalo, V., Mattila, M., & von Schoultz, Å. 2020. Ideological mavericks or party herd? The effect of candidates’ ideological positions on intra-party success. Electoral Studies, 67, [102187].
Janssen, C., Dandoy, R., & Erzeel, S. 2017. Het electorale success van ethnische minderheden in Brussel: de rol van de kiezers en partijen. Res Publica: Belgian journal of political science, 59, 389. Janssen, C. 2020. Shaping the (dis) advantage: the impact of partisan and demographic factors on ethnic minority candidates’ success in preferential voting systems. Evidence from the Brussels case.
Journal of Elections, Public Opinion and Parties, 1-24.
Katz, R. S. & L. Bardi, L. 1980 'Preference Voting and Turnover in Italian Parliamentary Elections',
American Journal of Political Science, 24 (1): 97-114.
Maddens, B., & Put, G.-P. 2013. Office Effects and Campaign Spending in a Semi-Open List PR System: The Belgian/Flemish Federal and Regional Elections 1999–2010. Electoral Studies 32: 852-63.
Maddens, B., Wauters, W. Noppe, J., & Fiers, S. 2006. Effects of Campaign Spending in an Open List PR System: The 2003 Legislative Elections in Flanders/Belgium. West European Politics, 29: 161– 168.
Marien, S., Wauters, B., & Schouteden, A. 2017. Voting for Women in Belgium’s Flexible List System.
Politics & Gender, 13(2), 305-335.
Nagtzaam, M. A., & Van Erkel, P. F. 2017. Preference votes without preference? Institutional effects on preference voting: an experiment. Journal of Elections, Public Opinion and Parties, 27(2), 172-191.
Söderlund, P., von Schoultz, Å., & Papageorgiou, A. 2021. Coping with complexity: Ballot position effects in the Finnish open-list proportional representation system. Electoral Studies, 71
Teney, C., Jacobs, D., Rea, A., & Delwit, P. 2010. Ethnic voting in Brussels: Voting patterns among ethnic minorities in Brussels (Belgium) during the 2006 local elections. Acta politica, 45(3), 273-297.
Thijssen, P. 2013. Are parties stimulating candidate-centred voting? The case of the Belgian district council elections 2000–2006. Acta Politica, 48(2), 144–166.
Thijssen, P., & Jacobs, K. 2004. Determinanten van voorkeurstemproporties bij (sub-)lokale verkiezingen: de Antwerpse districtraadsverkiezingen van 8 oktober 2000. Res publica : tijdschrift
voor politieke wetenschappen, 4, 460–485.
Van Aelst, Peter, Bart Maddens, Jo Noppe, & Stefaan Fiers. 2008. Politicians in the News: Media or Party Logic? Media Attention and Electoral Success in the Belgian Election Campaign of 2003.
European Journal of Communication, 23: 193–210.
Van Erkel, P& and Van Aelst, P. 2016. The first one wins: Distilling the primacy effect. Electoral
Studies, 44: 245-264.
Van Erkel, P. F. 2019. Sharing is caring: the role of voter-candidate similarities in intra-party electoral competition. European Political Science Review, 11(1), 75-89.
Van Erkel, P. F., Van Aelst, P., & Thijssen, P. 2020. Does media attention lead to personal electoral success? Differences in long and short campaign media effects for top and ordinary political candidates. Acta Politica, 55(2), 156-174.
Van Holsteyn, J., & Andeweg, R. 2012. Tweede orde personalisering: voorkeurstemmen in Nederland.
Villodres, C. O. 2003. Intra-party Competition under Preferential List Systems: The Case of Finland,
Representation, 22(3), 55–66.
Wauters, B., Weekers, B. & Pilet, J.-B. 2004. Het gebruik van de voorkeurstem bij de regionale en Europese parlementsverkiezingen van 13 juni 2004. Res Publica, 46 (2-3): 377-411.
Wauters, B., Weekers, K., & Maddens, B. 2010. Explaining the number of preferential votes for women in an open-list PR system: An investigation of the 2003 federal elections in Flanders (Belgium). Acta
Politica, 45(4), 468–490.
Wauters, B., & Weekers, K. 2008. Het gebruik van de voorkeurstem bij de federale parlementsverkiezingen van 10 juni 2007. Res Publica, 50 (2): 49-88.
Wauters, B., Van Aelst, P., Thijssen, P., Rodenbach, J., Smulders, J., & Pilet, J. B. 2015. Présidentialisation versus personnalisation? Clés de lecture à la baisse des votes préférentielles. In
Décrypter l’électeur: le comportement électoral et les motivations du vote du 25 mai 2014 (pp.
76-98). Lannoo campus.
Wauters, B., Thijssen, P., Van Aelst, P. & Pilet, J.-B. 2018. Centralized personalization at the expense of decentralized personalization. The decline of preferential voting in Belgium (2003–2014).Party
Politics, 24: 511-523.
Wauters, B., Thijssen, P., & Erkel, P. 2020. Preference Voting in the Low Countries. Politics of the Low
Countries, 2(1), 77-106.
Wauters B. 2021. Intraparty competition and preference voting in local elections. Personalization at different levels? Paper presented at the ECPR Virtual Joint Sessions, May 2021.
Wildgen, J.K. 1985. Preference Voting and Intra-party Competition in Italy: Some New Evidence on the Communist-Christian Democrat Stalemate, Journal of Politics, 47 (3): 947-57.