HAL Id: hal-02807366
https://hal.inrae.fr/hal-02807366
Submitted on 6 Jun 2020HAL is a multi-disciplinary open access archive for the deposit and dissemination of sci-entific research documents, whether they are pub-lished or not. The documents may come from teaching and research institutions in France or abroad, or from public or private research centers.
L’archive ouverte pluridisciplinaire HAL, est destinée au dépôt et à la diffusion de documents scientifiques de niveau recherche, publiés ou non, émanant des établissements d’enseignement et de recherche français ou étrangers, des laboratoires publics ou privés.
Evaluation of a reference population in dairy goats for
genomic selection
Céline Carillier
To cite this version:
Céline Carillier. Evaluation of a reference population in dairy goats for genomic selection. Life Sciences [q-bio]. 2012. �hal-02807366�
European Master in Animal Breeding and Genetics (EM-ABG)
Master Sciences et Technologies du Vivant et de l’Environnement
Spécialité : Génétique Animale, Génome et Diversité
Evaluation of a reference population in dairy
goats for genomic selection
Céline CARILLIER
Supervisors:
Virginie Clément, Hélène Larroque, Isabelle Palhière, Christèle Robert-Granié, Rachel Rupp
Abstract
Reference population is the main point to succeed in genomic selection, improving genetic breeding value accuracies. The aim of this study was to characterize the structure of the multi-breed (Alpine and Saanen) dairy goat reference population genotyped with a 50k chip, studying level of relationship and linkage disequilibrium extent within population. Several reference populations (from 20 males to 705 males and 1 946 females) were designed to examine effect of population size and interest of female genotypes on genomic estimated breeding values (GEBV) using GBLUP. Feasibility of genomic selection in goats was considered comparing GEBV accuracies and ascendance accuracy calculated for young males. The reference population considered in this study with 250 effective founders and 0.115 level of LD extent between two consecutive markers was not perfect for genomic selection. Increase population size induced proportional increase in GEBV accuracies from + 2% to + 31 % according to the case studied and the trait. Adding female genotypes improved accuracy from + 0.28 to + 0.01 depending on the reference population and trait studied, more relevant considering small population size. Genomic selection did not improve GEBV accuracies for young males except for those with sires genotyped.
Key words: Dairy goats, multi-bred reference population, female genotypes, linkage
Abstract
Genomic selection is done in several species like in bovine since 2010. In dairy goat, a 50k chip and genotypes are recently available. Interest of genomic selection lies in reduction of generation interval, already quite small in goats, and in improving accuracy of genetic breeding value of animals especially at birth. In this study, several multi-breed (Alpine and Saanen) reference populations, considering several population sizes with or without female genotypes (from 20 males to 705 males and 1 946 females), were used to compare accuracies of genomic estimated breeding values (GEBV). A characterization of the entire reference population structure, estimating level of relationship, LD extent and persistence between breeds was used to estimate GEBV accuracy level expected. Then genomic evaluation using GBLUP were done on several populations considered. The whole reference population studied was 705 males and 1 946 females. The traits studied were milk production traits, somatic cell score (SCS) and type traits. Effect of population size and interest of female genotypes were examined on the genomic accuracies. Feasibility of genomic selection was studied by comparing GEBV accuracies to ascendance accuracies calculated for young males. The high number of founders, 250, and the low LD extent between two consecutive markers, 0.115, in this reference population was not perfect for genomic selection. But results on persistence of LD phases, the same as in Manech red faced and black faced for low marker distance, justified using Alpine and Saanen in a unique reference population.
The population size had an important effect on GEBV accuracies, from + 2% to + 31 % according to the case studied and the trait. Increasing it with females would be more interesting considering small population size, + 0.15 with 93 animals, than bigger one, + 0.06 with 705 animals in average. Genomic selection did not improve accuracy of genetic breeding values, even with all animals in the reference population. But some improvements in accuracy were noticed for males with fathers genotyped.
To applied genomic selection in dairy goats some improvement had to be done like adding females with higher genetic potential as dams of bucks or considering another methods than GBLUP to estimate marker effects. Nevertheless this study allowed suspecting quantitative trait locus (QTL) on SCS. It is an interesting result needing using methods of QTL detection to specify the localization of it.
Abbreviations glossary
AI: Artificial Insemination
BLUP: Best Linear Unbiased Predictor
CD: Coefficient of Determination (EBV accuracy) EDC: Effective Daughter Contribution
DGV: Direct Genomic Value DRP: DeRegressed Proofs DYD: Daughter Yield Deviation EBV: Estimated Breeding Value FP: Fat Percent in milk
FU: Fore Udder FY: Fat Yield in milk
GBLUP: Genomic Best Linear Unbiased Predictor GEBV: Genomic Estimated Breeding Values LD: Linkage Disequilibrium
PA: Parent Average
popQTL: population of females and males genotyped popIA: population of AI bucks genotyped
PTA: Predicted Transmitting Ability PP: Protein Percent in milk
PY: Protein Yield in milk QTL: Quantitative Trait Locus RUA: Rear Udder Attachment SCS: Somatic Cells Score
SNP: Single Nucleotide Polymorphism TO: Teat Orientation
UFP: Udder Floor Position UP: Udder Profile
Table of contents
Introduction ... 1
I. Background ... 2
I.1. Structure of the reference population ... 2
I.1.A. Extent of LD ... 2
I.1.B. Levels of relationship within reference population ... 2
I.2. Multi breeds or multi populations reference population ... 3
I.2.A. Using several populations ... 3
I.2.B. Using several breeds ... 4
I.2.B.a. In dairy cattle ... 4
I.2.B.b. In beef cattle ... 4
I.2.C. Several models to use multi-breed reference population ... 5
I.1. Use of female genotypes ... 5
I.2. Phenotypes used ... 6
II. Material and methods ... 7
II.1. Reference population in French Alpine and Saanen goats ... 7
II.1.A Description of popQTL and popIA population structures ... 7
II.1.B Phenotypes available ... 9
II.1.B.a. YD and DYD ... 9
II.1.B.b. Weight of phenotypes ... 11
II.1.C Genotypes of the reference population ... 12
II.1.C.a. Genotypes available ... 12
II.1.C.a. Calculation of LD extent and persistence of LD between breeds ... 12
II.1.C.b. Simulation of bucks genotyped ... 12
II.2. Prediction of GEBV ... 13
II.2.A. Prediction of GEBV accuracy ... 13
II.2.B. Estimation of GEBV ... 14
II.2.B.a. GBLUP ... 14
II.2.B.a. Calculation of accuracy ... 14
II.2.B.b. Cases studied ... 14
III. Results and discussion ... 15
III.1. Structures of the two populations genotyped ... 15
III.1.B. PopIA ... 16
III.2. LD extent in the population genotyped ... 17
III.2.A. LD within the population ... 17
III.2.B. Persistence of LD between Alpine and Saanen goats ... 18
III.3. Simulation of bucks genotypes ... 18
III.4. Prediction of GEBV accuracy level ... 18
III.4.A. In functions of the heritability and population size ... 18
III.5.A. Function of LD extent ... 19
III.5. Results on genomic evaluation ... 20
results could indicate that these males are homozygote for a QTL concerning SCS. But further analyses are needed. ... 21
III.5.A. Effect of population size on GEBV accuracy ... 21
III.5.B. Interest of female genotypes ... 22
III.5.C. Interest of genomic selection ... 22
Conclusion ... 24
Acknowledgements ... 26
Figure 1.Scheme of cross-validation method to estimate accuracy of genomic breeding values
Predicted DYD
GEBV
r (EBV, GEBV) = accuracy r² (EBV, GEBV) = reliability
Validation test EBV Genotypes Training set Predicting equation observed DYD Phenotypes + genotypes or r ( , ) = accuracy
1
Introduction
Arrival of genomic techniques in dairy cattle selection is a revolution. Indeed the breeding value of an animal could be predicted at birth just using genotype which is a genome scan using dense markers. Genomic selection leads to decrease generation interval in male pathway and increase accuracy of genomic breeding values (GEBV) predictions. Besides, costs of selection are lower than the ones necessary for classical selection because bulls are used earlier and for a shorter time than in progeny testing.
The principle of genomic evaluation is to estimate the breeding value of an animal summing the estimated effects of each marker (SNP: single nucleotide polymorphism or haplotypes, sequence of marker alleles on a chromosome). Marker effects are generally estimated with genomic best linear unbiased prediction model (GBLUP), estimating simultaneously marker effects and random polygenic ones.
A reference population is needed to predict SNP effects and to estimate genomic breeding values (GEBV) of animals without genotypes. The reference population is split in two parts: a training set consisting of old animals with phenotypes and genotypes and a validation set of the most juvenile animals in which only genotypes are considered. The genomic prediction equation is defined from a training set. Then the GEBVs of the validation set are predicted from these equations. Accuracy of genomic predictions is estimated using cross-validation method and is computed from the correlation between GEBVs and the observed phenotypes (Figure 1). The quality of predictions depends on number phenotypes, heritability, number of genetic markers and reference population size.
In France, genomic selection is already done in dairy cattle since 2010 and is under development in dairy sheep. In goats, arrival of 50k chip and recent genotyping allow studying the feasibility of genomic selection in this species. Gains in generation interval with applying genomic to goats and sheep are expected to be lower than in bovine. Increase in accuracy of GEBVs depends on reference population (size and structure) and on relationships between reference population and candidate ones. Therefore aim of this study is to evaluate changes in accuracy using genomic selection in goats (Saanen and Alpine). First, the way to constitute this reference population will be studied. Examining several parameters like structure and linkage disequilibrium (LD) extent in the reference population chosen will lead to predict GEBV accuracy. It will be compared to ones calculated using GBLUP model. This will allow characterizing feasibility and defining the limits of a genomic selection in goats.
2
I.
Background
I.1. Structure of the reference population
When animals are highly related within a population, level of linkage disequilibrium (LD) between markers and quantitative trait loci (QTL) is high (Robert-Granié et al, 2011). GEBVs accuracies are dependent on LD extent and therefore on population structure.
I.1.A. Extent of LD
Linkage disequilibrium between marker and QTL refers to non-random association between alleles of marker and QTL. In genomic selection, LD between marker and QTL has to be persistent in all the reference population across generations (Hayes, 2011).
D, the deviation from a random association between markers is a measure of LD. If we consider two markers A with alleles A1, A2 and B with alleles B1, B2, D can be calculated as: D=
[
p(A1B1)×p(A2B2)] [
− p(A1B2)×p(A2B1)]
, wherep(A1B1)is the frequency of A1B1haplotype in the population. The ² (Hill and Robertson, 1968) measure of DL less dependent on allele frequencies is used to compare LD extent between population:
) ( ) ( ) ( ) ( ² ² 2 1 2 1 p A p B p B A p D r × × ×
= , where p(A1)is the frequency of allele A1 in the population. Values of this measure range from 0 for no LD to 1 for complete LD between two markers. If we consider a marker and a QTL, ² is the measure of variation caused by alleles at QTL which is explained by marker (Hayes, 2011). The ² coefficient between two markers at the same distance in two breeds can have the same value even if phases are reversed.
Correlation between two coefficients ( ² ) in two different populations is preferred as a measure for LD phases persistence between populations. The value of depends on marker distance and breed considered. Indeed for high marker distance (superior to 100 kb), LD level is the same whatever breeds studied. The largest difference of LD pattern between two bovine breeds (New Zeeland Holstein Australian Angus) is obtained for low marker distance (70-75 kb) (De Roos et al, 2008). LD extent is higher in multi-breed reference population than in purebred one. Moreover, persistence of LD phase was less consistent if the training and validation population are very different (Toosi et al, 2010).
I.1.B. Levels of relationship within reference population
Increasing level of relationship between training set and validation set improve GEBV accuracies. Including in training set father, half sibs and full sibs of animals of validation set increase accuracies of 50% for milk yield compare to including non relatives (Habier et al, 2010). And including sires of cows used in validation set in the training set increases female
3 GEBV accuracy of 47% for milk yield. Using all sires of predicted bulls in the training set increases GEBV accuracies of 26 % in fertility and 12% in protein yield compare to training set excluding sire. In fact, adding sires in the training data leads to estimation of GEBV not only from the LD but also from sire genetic information (Lund et al, 2009).
Regarding lower levels of relationship between training and validation set, including half sibs compare to first cousin improves GEBV accuracy of 112% (from 0.27 to 0.57) in Merinos beef sheep (Clark et al, 2012). Even adding maternal and paternal grandsires in the training test increases accuracies of 9.8% in protein yield and of 16.1% in somatic cell score compare to training set without relatives of sires (Pérez-Cabal et al, 2010).
Reliabilities of direct genomic values (DGV), sum of all marker effects excluding polygenic effects and information from non-genotyped relatives, are 88% higher with an increase of 0.55% in average squared relationship between training and candidate sets. These differences observed in reliabilities are proportional of heritability of the trait. But, DGV reliabilities decrease with the level of relationship between animals within reference population. When cows within training set are highly related (descendant of only 5 sires), reliabilities of DGV are 18.3% under DGV reliabilities of low related population (40 sires) for a simulated trait (h²=0.3) (Pszczola et al, 2012).
Strong LD between candidates and reference population caused by high level of relationship between the two could be damaged by recombination at next generations. It seems to be better to genotype and phenotype relatives of candidates like their dam and sire or their sire and maternal grandsire (Robert-Granié et al, 2011). So it is important to pay attention to the structure of the reference population to make genomic selection.
I.2. Multi breeds or multi populations reference population
Multi-breed or several populations in a same reference population increase the size of the reference population and GEBV accuracies but could not be a good choice in terms of LD extent for very divergent breeds or populations.
I.2.A. Using several populations
Using the “European across countries population” as training set for Holstein cows and only one country population as validation, reliabilities of DGV are higher than using only one country in training set. DGV Reliabilities are improved of 21, 11%, 8% and 9% respectively for German, Nordic, Dutch/Flemish and French population compare to national reference population (Lund et al, 2010; Lund et al, 2011). A training set consisted of one population (Danish Red) to predict other ones (Swedish and Finnish Red) does not estimate
4 well DGV reliabilities (-14% and -17% compare to national evaluation) in dairy traits. Nevertheless the use of combined reference population improves DGV reliabilities (3% for Danish and 7% for Finnish and Swedish) compare to using national reference population. However adding a third population to a two-population reference one does not really increase reliabilities even if increasing is higher for genetically close populations like Swedish and Finnish Red cows (Brøndum et al, 2011).
Adding 1 000 individuals of a simulated population B to a training set made up with 1 000 animals from simulated population A induces an increase on DGV reliabilities of population A of 0.12 (maximum) depending on LD extent and time of divergence simulated. Using two genetically divergent populations by increasing number of divergent generations of 270 between A and B decreases reliabilities of 44.6% (De Roos et al, 2009). Small increase in DGV and GEBV reliabilities with combined reference population is conditioned by relationships between populations, heritability of the trait and marker density. Moreover adding a breed specific effect in the model which estimates GEBV from multi-breed reference population does not led to any improvement (Makgahlela et al, 2011).
I.2.B. Using several breeds
I.2.B.a. In dairy cattle
Using a multi-breed reference population has a small effect on GEBV accuracy predictions whatever the dairy trait considered (Hayes et al, 2009a; Pryce et al, 2011). In Jersey cows, accuracy for fat percent is 1% higher using a multi-breed than purebred reference population and 13% higher compare to non genomic accuracy (Hayes et al, 2009a). A three-breeds reference population induces a small increase in GEBV accuracy compare to using two breeds. Accuracy obtained in milk yield with the Holstein-Jersey-Fleckvieh reference population is 5% higher than the one calculated with Holstein-Fleckvieh reference population. The accuracy gain obtained for small breeds is not really noticed in large breed. In order to predict genomic gain in Holstein breed using only Holstein or multi-breed (Jersey, Fleckvieh, Holstein) reference populations gives the same accuracies of 0.41 in protein and fat yields (Pryce et al, 2011).
I.2.B.b. In beef cattle
Purebred training population (Angus) used with multi-breed validation population (Carcass Merit Project including Angus) gives good predictions for all breeds considered. Correlations between predicted and true genotypic values are 0.946, 0.969, and 0.972 for Hereford Brahman and Angus respectively. Multi-breed reference population increase
5 correlations of 1% for simulated phenotypes compare to Angus purebred reference population. Nevertheless correlation between predicted genetic merit and phenotype is better using multi-breed reference population (Kizilkaya et al, 2009).
Training in purebred population to predict genetic merit of multi-breed animals is possible but induce small increase in GEBV accuracies especially for large breeds. It is useful in livestock because of crossbreed or multi-breed lines but not in dairy cattle because accuracies are improved only in small breeds. GEBV are more accurate with a multi-breed than with purebred reference population in case of population without individuals genotyped and phenotyped (Pryce et al, 2011). Results using several breeds in a unique reference population were summed up in Annexe A.
I.2.C. Several models to use multi-breed reference population
Several statistical models tend to predict GEBV of animals like Bayesian models (Bayes A, B, etc) or GBLUP. At this time no any model is assume to be better than others. In genomic evaluation with multi-breed (Holstein-Jersey-Fleckvieh) reference population, GEBV accuracies in dairy traits calculated with GBLUP model (0.4) are really close to the ones calculated with BayesA (0.37) (Pryce et al, 2011). Some studies have shown the superiority of Bayesian model in case of multi-breeds reference population. Bayes A and Bayes_SSVS are more accurate than GBLUP for GEBV of Jersey animals using Holstein-Jersey reference population (Pryce et al, 2011). It seems to be better (16% higher than BLUP on weight at ultrasound scanning) to predict the breed mostly present (Merinos sheep) in the reference population (Daetwyler et al, 2010). On cows fat percent GEBV are 12% higher with Bayesian (0.82) models than with GBLUP (0.73). But BLUP is better for large breed like Holstein cows (Hayes et al, 2009a). GBLUP model with a specific breed effect leads to higher DGV reliabilities than Bayesian models (Makgahlela et al, 2010). A model with SNP effects different but correlated between breeds is 4.1% more accurate than model with same SNP effects for genetically distant breeds (Varona et al, 2010).
A reference population combining populations could improve the reliability of predictions except if marker effects are very different between populations. Markers need to be very close to QTL, the only ones in persistent LD with QTL across breeds or populations. So many projects focus on high density chip like the 800 k chip in ANR GEMBAL project for French beef cattle.
I.1. Use of female genotypes
Since 2011, decrease of genotyping cost allows examining the interest of female genotypes like ANR AMASGEN project (with a low density chip) which is expected to increase genetic
Figure 2. Diagram of breeding scheme simulated in Mc Hugh et al (2011) study
Figure 3. Annual genetic gain for several numbers of genotyping per year (0, 250, 1 000,
2 000) and several proportions of males and females in the reference population (Sørensen and Sørensen, 2010)
4 000 generations (Random selection and mating)
Random mating Selection Animals genotyped Gen 0 2 625 375 Animals genotyped Based population 100 100 Non selected candidate Animals genotyped 3 000 Candidate for nucleus 3 500 500 3 000 30 500 Selection 10 Gen 1 Selection nucleus Commercial cattle
6 gain and decrease inbreeding rates (Moser et al, 2010). In average combined male and female genotypes increases GEBV accuracies of 25% compare to progeny testing (Schaeffer, 2006). DGV reliabilities of cows using only female genotypes are 39% higher than EBV on energy balance (Verbyla et al, 2010) whereas genetic gain is more than twice higher using female genotypes in genomic selection than in progeny testing (Mc Hugh et al, 2011). In a simulated dairy cattle breeding scheme (Figure 2), using female genotypes increases the annual genetic gain compare to genomic selection with only male genotypes of 44% (Mc Hugh et al, 2011) or 21 % (Buch et al, 2010) depending on simulations. Using female genotypes to preselect them at birth leads to genetic progress 2.4% low than genomic selection which preselect males at birth (Schrooten et al, 2005).
Moreover increase number of cow genotypes used in reference population (from 1 000 to 2 000 ) improves DGV reliabilities of 40% (0.3 compare to 0.18) on a simulated trait (h²=0.3) (Calus et al, 2011). Indeed use 10% of female genotypes compare to 2% leads to an increase in accuracy of 4% for a simulated trait (h²=0.25). Furthermore annual genetic gain is maximum for 25% of male genotypes in reference population (Figure 3). In this case, increasing proportion of female genotypes in reference population (from 75% to 100%) does not improve the annual genetic gain (Sørensen and Sørensen, 2010). Using top ranking female genotypes does not improve GEBV accuracies compare to female genotypes chosen at random (Jiménez-Montero et al, 2010). Using female genotypes in the reference population is a good way to accelerate genetic progress and to improve accuracy of GEBV of both sexes. It is interesting because genotyping females would lead to better mating and high merit calves that would compete with current sires (Sørensen and Sørensen, 2010). Nevertheless even if female genotypes are not used, applying selection intensity (multiple ovulation and embryo transfer) in dams of cows leads to an increase in genetic gain (Pryce et al, 2010). Results are summed up in Annexe B.
I.2. Phenotypes used
Phenotypes mostly used for bulls in genomic selection are daughter yield deviations (DYD). DYD are average performance of bull daughters corrected for environmental effects and for their dam genetic merit. For females, yield deviations are used as phenotypes, and defined as YD= y−
(
β
+ p)
where is yield of cow, β is fixed effects and is permanent environment effect (Szyda et al, 2008). If DYD are not available like for stranger bulls, deregressed proofs (DRP) are considered as phenotypes (Robert-Granié et al, 2011). The DRP are average performance of daughters calculated from genetic merit of bulls using the inverse of a genetic evaluation method. In Nordic dairy cattle using DRP with single step genomic7 evaluation improve DGV reliabilities of 6.7%, 12.9% and 10% for milk, protein and fat yields respectively compare to using DYD (Mäntysaari et al, 2011).
Estimated breeding values (EBV) which already contain genetic information can be used as phenotypes. With GBLUP, GEBV reliabilities are slightly higher (+ 0.7%) using EBV than using DYD. However this difference depends on heritability (Guo et al, 2010). EBV easier to use because directly obtained from genetic evaluation contains smaller random error than DYD. Nevertheless EBV includes information of all relatives leading to double counting because predictions of GEBV also include information from relatives. DRP could be a good alternative because it does not take into account relatives and are easier to obtained compare to DYD (Guo et al, 2010).
A “single step approach” is for the moment the only method which analyses directly performance records for genomic predictions (Legarra et al, 2011). Indeed this approach combines phenotypic, genomic and pedigree information into a single simultaneous analysis. Using a one step approach leads to similar accuracy and smaller values (-73%) for prediction error variance and mean square error than using DYD in classical genomic evaluation method (Vitezica et al, 2010). Nevertheless based on coefficients of determination, one-step approach is 2.5% less accurate than multiple-step one using DYD (Aguilar et al, 2010).
II.
Material and methods
The aim of this study is to characterize the feasibility of genomic selection in the French dairy goat population. The interest of genomic selection consists in the decrease of generation interval in a higher accuracy of breeding values. For this study the feasibility of genomic selection was estimated by comparing GEBV’s accuracies to EBV ones. Two populations of genotyped animals (popIA and popQTL) were considered as the two sets of a reference population.
II.1. Reference population in French Alpine and Saanen goats
As described above, population structure has an important effect on accuracy of GEBV. Therefore the two populations of genotyped animals were first analyzed in terms of pedigree and genetic structure.
II.1.A Description of popQTL and popIA population structures
PopQTL and popIA were the two populations genotyped with the Illumina 50K goat BeadChip. The popQTL was a population initially dedicated to QTL detection. It consisted in 20 AI bucks (9 Saanen and 11 Alpine) born between 1999 and 2004 and their 2 246 daughters with an average of 112 daughters genotyped per male (from 74 to 127). Bucks of popQTL
8 population had high total merit index (ICC, including type and production traits) from 0.97 to 5.76. The popIA population consisted in 1 012 AI bucks (429 Saanen and 582 Alpine) including bucks from popQTL, born between 1985 and 2011 with an ICC merit from - 6.48 to 7.78. Among these 1 012 bucks, only the 850 youngest bucks born after 1998 will be genotyped. Negatives ICC values were obtained for former bucks because indexes were expressed as deviation from a rolling base updated each year with current bucks (with a better genetic level). At this time only 85 genotypes were available including 39 Saanen bucks and 46 Alpine ones.
The description of the population consisted in analysis of pedigree and genetic structure. The pedigree structure of the two populations was designed with Pedigree viewer software (Kinghorn and Kinghorn, 2007) considering genotyped animals and 4 anterior generations (all parents known). Analysis of genetic structure was done with Pedig software (Boichard, 2006) considering 26 generations. The quality of pedigree information, given by the number of equivalent generation known, was evaluated using option “Ngen” of Pedig
software: n n n n n Ngen p gp ggp n × × × × + + + + = 2 1 ... 3 2 1 2 1 2 11 2
where
n
p is the number of parentknown,
n
gp the number of grandparents known,n
ggp the number of great grandparents known andn
n the number of ancestor known at generationn
(Danchin-Burge, 2011). The average number of ancestors by individual was also computed. Average inbreeding and parental coefficients were calculated independently for all animals: 1) from popQTL AI bucks pedigree, 2) from their daughter pedigree and 3) from popIA bucks pedigree considering the whole pedigree including 26 generations at maximum. The popQTL pedigree consisted in 34 771 animals, 18% had at list one parent unknown and 14% with both parents unknown. 17 912 animals made up the popIA pedigree, 21% had at least one parent unknown and 18% with both parents unknown. Inbreeding coefficient, calculated with “meuw” option of Pedig software, is the probability at a given locus that an individual received similar alleles from his both parents. It could be expressed as(
A)
n j F F × + = 1 2 1
where n is the number of individuals on parental line and FA is inbreeding coefficient of common ancestor (Verrier et al, 2001). Average parental coefficients had been calculated with “par” option of Pedig software taking 50 samples of 30 individuals at random. Parental coefficient between I and J is the probability that two alleles of a gene are similar in I and J genome (Verrier et al, 2001). Effective number of founders was calculated for AI bucks of popQTL and popIA with “probability of gene
Figure 4. Scheme of the two cases for achievement of phenotypes: one with all females’
information and another only with popQTL females’ information to analyze interest of female genotypes
Figure 5. The five morphology position used for this experiment as morphology phenotypes
Genetic evaluation (BLUP) All females (2.8 millions) Females of popQTL (2 246)
- Accurate YD of females from popQTL - Accurate DYDallfem of the 685 bucks chosen
-Less accurate YD of females from popQTL
-Less accurate DYDfemg of the 20 sires of females from popQTL
Adding female genotypes is not expected to actually improve GEBV accuracy of males
Adding female genotypes to genotypes of their 20 sires is expected to highly increase level of bucks GEBV accuracy Official indexation
model on
Simplified indexation model on
9 origin” option of Pedig software. This effective number of founders is the inverse of the probability that two genes in the population come from the same ancestor: this is the number of founders that given the same genetic variability if they all contribute at the same level (De Rochambeau et al, 2003).
II.1.B Phenotypes available
Phenotypes mostly used in genomic evaluation are DYD for males and YD for females. They are derived from classical genetic evaluation. Figure 4 is a scheme of methods used to obtain DYD and YD in this study. Genetic evaluations did not include only animals of popIA and popQTL populations. DYD and YD were more accurate than expected because animals have already progeny and relatives in the all population. Therefore two classical genetic evaluations were made to obtain two DYD or YD per animal.
II.1.B.a. YD and DYD
The two evaluations were: (i) an evaluation with all official females (2 885 244 individuals), DYDallfem were well known because all bucks daughters were included and, (ii) an evaluation on the 2 246 females from popQTL only, DYDfemg were not as accurate as in the first case. This second case was similar to a situation where only data from females were available to predict young males (not progeny tested) breeding values. In this case including females genotyped was expected to improve GEBV accuracies. For this case genetic evaluation model was simplified without heterogeneity of variance and permanent environment because of few data. Level of fixed effects like year, region and parity were pooling to allow estimation of effects (Annexe C). To underline the interest of female genotypes, a genomic evaluation using phenotypes obtained in the second case (DYDfemg and YD) and male and female genotypes was compare to another one using only male phenotypes (DYDfemg) and genotypes. YD of genotyped females and their deviations were calculated with preadj option of GENEKIT
software (Ducrocq, 1998). DYD were derived as
∑
∑
= = × = n i i n i i i w w dev DYD 11 where i is the number of
observations (lactations of all daughters) per male, devi deviation of the observation i and wi
is weight of observation
i
. Deviation of observation was performance corrected for non genetic effect and for half dam genetic merit. In this study traits considered were milk yield, fat yield (FY), protein yield (PY), fat percent (FP), protein percent (PP), somatic cell score (SCS) and the five type traits used in combined morphologic index (ICM): fore udder (FU), udder profile (UP), udder floor position (UFP), teat orientation (TO), and rear udder attachment (RUA) (Figure 5).Table 1. Phenotypes obtained with genetic evaluation on all official females (2 885 244
goats) YD for females (n=1 946) and DYD for males (n=705).
FY: Fat Yield, PY: Protein Yield, FP: Fat percent, PP: Protein percent
Table 2. Phenotypes obtained with genetic evaluation only on the first lactation of genotyped
females (2 246 goats) YD for females and DYD for males
SCS: Somatic Cell Score, FU: Fore Udder, UP: Udder Profile, UFP: Udder Floor Position, TO: Teat Orientation, RUA: Rear Udder Attachment
Table 3. Genetic parameters used to compute EBV in official evaluations in Alpine
10
- Table 1 shows statistical results on YD and DYD given for animals genotyped and
calculated with evaluation on all females. In this case YD of females genotyped were on average of 197.2 256 for milk yield and 0.74 5.8 for fat percent (FP). Average DYD was 76.7 80 for milk yield and 0.52 2.8 for FP. DYD of all males from popIA and popQTL were given for the 860 bucks with daughters in production in 2012. The average number of observations (lactations of daughters) for DYD was 801 2 388 (from 1 to 10 120) per buck.
- Table 2 presents statistical results on YD and DYD obtained with evaluation on the 2 246 females genotyped and given for the 2 266 animals from popQTL. Average YD was -2.89 362 on milk yield and - 3.04 5.8 on FP. DYD was on average - 0.56 102 on milk yield and 0.15 2.5 on FP. Table 2 also shows correlations between DYD (and YD) obtained with evaluation on all females and those obtained with evaluation on females genotyped. These correlations ranged from 0.75 to 0.94, because model of non official genetic evaluations were different and variance heterogeneity was not taking into account. YD and DYD values in official method were not comparable with the one obtained for evaluation on females genotyped. Nevertheless minimum and maximum of these YD and DYD ranged in the same order than those obtained on all official females.
EBVs for Alpine and Saanen females were calculated together for dairy traits. It was known that there were slight differences between their performances (Bélichon et al, 1999). In this study differences between Saanen YD and Alpine one in the whole population (2.8 millions) were noticed. YD for milk yield were in average of - 32.39 372 in Alpine and 30.35 380 in Saanen (results not shown). Phenotypes of Saanen goats were in average superior than the ones in Alpine for milk protein and fat yield but it was the contrary for fat and protein percent. These differences induced taking into account a fixed breed effect in genomic evaluation model. Standard errors of YD in Alpine and Saanen were similar. So heterogeneity of variance had not to be implemented in the genomic evaluation model. SCS: Somatic Cell Score, FU: Fore Udder, UP: Udder Profile, UFP: Udder Floor Position, TO: Teat Orientation, RUA: Rear Udder Attachment
Table 3- Table 3 presents genetic parameters for several traits, only type traits and
SCS are different between the two breeds. Higher heritability is 0.4 for FP and protein percent (Spangler et al, 2008), 0.3 for milk yield, FY and PY, 0.19 for SCS in Alpine and 0.21 in Saanen and from 0.26 to 0.36 for type traits. YD of Saanen and Alpine for those functional traits were calculated separately.
Table 4. YD (n=1 946) and DYD (n=705) calculated with all females (2.8 millions) for
Somatic cell Score and type traits considering Alpine and Saanen together.
Figure 6. Distribution of EDC values on SCS for the 685 males in the reference population
Figure 7. Graph of EDC values on milk yield function of the number of daughters in official
genetic evaluation for the 685 males in the reference population
Table 5. Correlations between EDC values and number of daughters in official genetic
evaluation
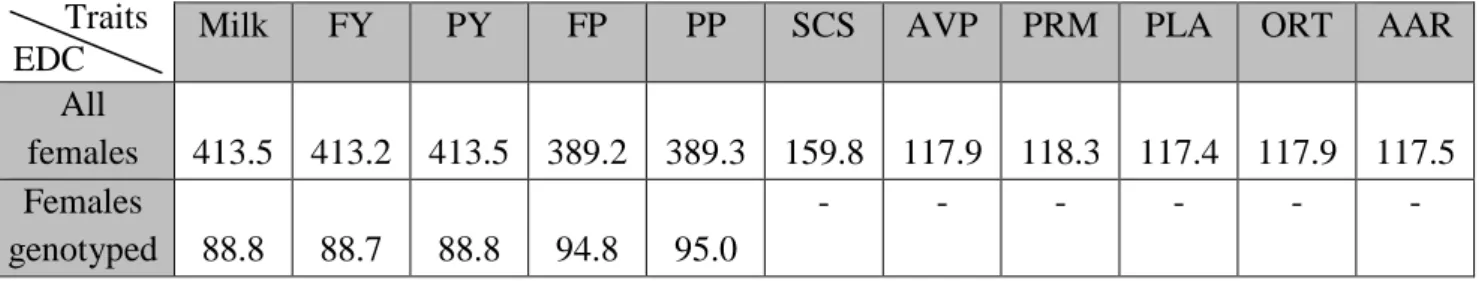
Table 6. Average weights of male phenotypes (EDC) for evaluation will all females (official)
and evaluation with only females genotyped (non official)
Milk FY PY FP PP SCS Type traits
ρ 0.990 0.989 0.990 0.984 0.986 0.996 0.999
Milk FY PY FP PP SCS AVP PRM PLA ORT AAR
All females 413.5 413.2 413.5 389.2 389.3 159.8 117.9 118.3 117.4 117.9 117.5 Females genotyped 88.8 88.7 88.8 94.8 95.0 - - - - Traits EDC
11 Table 4 shows statistical results on YD and DYD given for animals genotyped for SCS and type traits obtained with evaluation on all females. On all females genotyped only 2 233 had been registered for morphology. YD obtained for type traits were lower than those obtained for milk traits. In average all YD on type traits were around - 0.1 except for fore udder where average YD is close to 0.01. DYD were in average from - 0.007 to 0.027, the highest DYD was obtained for rear udder attachment and the smallest one for fore udder. For somatic cell score only 2 229 females had been recorded and 789 males had daughter with SCS records. Average YD in SCS were 0.117 2 and average DYD were 0.03 0.52 which was in the same order of magnitude than the ones for type traits.
II.1.B.b. Weight of phenotypes
Weight of female phenotypes taken here was weight of lactation in the official evaluation, 1 for fist lactation and 0.8 for second and third lactation in goats. As in dairy cattle weight of male performances considered here was the effective daughter contribution (EDC). It took into account almost all the above-mentioned factors and was calculated as:
(
)
∑
− + = k k dam k i R R R EDC 1 4λ
with r n h n R k k k ) 1 ( 1 ² − += where Rk is the reliability of daughter k‘s performance and Rdam reliability of her dam performance, =
∑
−l jkl k
n
n 1 1 where nk is number of lactations of daughter k corrected for contemporary group and njkl is contemporary group size in which daughter k made its lth lactation, and
² ² 4 h h − =
λ where h² is the heritability of the trait and r the repeatability of a record (Fikse and Banos, 2001). In this study EDC were calculated using crEDC software (Sullivan, 2010) and separately for the two breeds for SCS and type traits (Table 3). Figure 6 presents the distribution of EDC values for SCS identical to EDC distribution for other traits, almost following Gaussian distribution. Figure 7 is a representation of EDC values linearly proportional to number of daughters in official genetic evaluation. The bucks with less than 100 daughters were the young ones born after 2007. Table 5 shows high correlations (from 0.99 to 0.98) between EDC and number of daughters in official evaluation.
Table 6 presents average EDC calculated with evaluation on all females and on only females genotyped. EDC in official case (413 on FP) were larger than the one obtained only with female genotypes (89 on FP) and were ten times weight of female phenotypes.
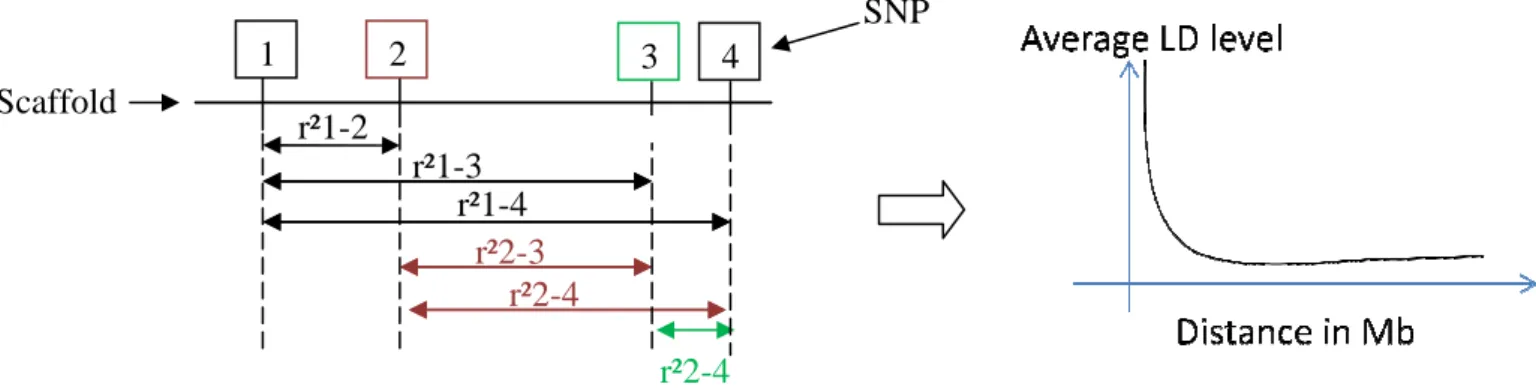
Figure 8. Scheme of calculation method of r² measure of LD within a population Scaffold r²1-2 1 2 r²1-3 r²1-4 r²2-r²2
Scheme of calculation method of r² measure of LD within a population SNP 3 4 4 -3 r²2-4 r²2-4
12
II.1.C Genotypes of the reference population
II.1.C.a. Genotypes available
In this study 49 674 SNP out of 53 347 synthetized on the Illumina 50K goat BeadChip were validated after quality control. Control consisted in a call freq (percent of animals with assigned genotype per SNP) superior to 0.99, a call rate (percent of SNP available per animal) superior to 0.98, a minor allele frequency of 1%, Hardy Weinberg equilibrium control and filiation. At the end, 2 039 genotypes were available on the 2 351 animals genotyped with 1 946 female and 9 male genotypes (on 2 255) from popQTL and all (84/85) from popIA were available including the 11 bucks in common to popQTL and popIA. This chip seemed to be sufficient to achieve accurate genomic selection according to (Hayes and Goddard, 2010). Indeed, they suggest that 10 NeL (where Ne is the effective population size and L the genome length in Morgans) i.e. 36 000 markers were necessarily to predict accurate GEBVs. At the start of the present study no genetic or physical map was available for the goat SNP markers. SNP were mapped on 2 316 scaffolds with length from 1 base pair (bp) to 9.93 Mega base (Mb) including from 1 to 243 markers for the largest scaffold.
II.1.C.a. Calculation of LD extent and persistence of LD between breeds Estimation with genomic data of LD persistence between breed and LD extent in the reference population was calculated with a Fortran software developed in SAGA lab and modified to consider largest scaffolds instead of chromosomes. r² were derived for haplotypes two by two even for non consecutive SNP for each scaffold (Figure 8) knowing distance between the two SNP considered. Average r² values considering as LD extent were calculated by regular distance interval of 0.02 Mb which allowed printing r² of LD in function of marker distance.
For the persistence of LD phases between Saanen and Alpine, average correlation of r values between Alpine and Saanen were derived by interval distance of 0.02 Mb.
II.1.C.b. Simulation of bucks genotyped
At the start of this study only 85 buck genotypes were available, but at the end of the year 768 additional bucks will be genotyped. To estimate the interest of genomic selection in our goat population, we had to simulate buck genotypes to be as close as possible to a real genomic evaluation. Ideally buck genotypes would be simulated considering phenotypes, pedigree and LD information. But such a simulation is highly time consuming. In this study, the 612 buck genotypes (born before 2002) from popIA were simulated using Memestra software (Guillaume, 2010). It allowed simulating genotypes conditionally to pedigree (on
13 three generations including animals already genotyped), allele frequency in the reference population, and to LD between markers using information from SNP position on genome. Because information of SNP position was only known on scaffolds all simulations were done by scaffold (2 316). Allele frequencies were calculated in the reference population (1 955 animals from popQTL and 84 from popIA).
II.2. Prediction of GEBV
II.2.A. Prediction of GEBV accuracy
To identify if the reference population used in this study will lead to good predictions, several equations predicting accuracy functions of heritability and reference population size were used. We have considered three expressions: (i)
− + + + × − = a a a a a N r 2 1 2 1 ln 2 1 ² λ with N a=1+2 λ , ² 2 h NeLk = λ and
( )
Ne k 2 log 1= where L is the genome length in Morgan. It assumes that accuracy of estimation of QTL effect is higher for QTL with intermediate allele frequency because they explain more the genetic variance (Goddard, 2009).
(ii) Daetwyler et al (2010) propose a function developing for case-control studies assuming that all estimations of QTL effects have the same accuracy:
) 2 ( ² ² ² NeL Nh Nh r + = .
(iii) Meuwissen (2009) proposes this equation:
NeLv Nh Nh r 4 ² ² ² +
= where 4NeLv is the number of QTL loci on genome. It can be approximate by
) 4 ln( 2 ² ² ² Ne NeL Nh Nh r + =
To analyse the r² parameters, we have considered an effective population size of 250 animals (III.1.B), and a length of genome of 30 Morgans. These equations were derived only using male genotypes. As we showed in the background part, including female genotypes had not the same weight than including male ones in terms of GEBV accuracy. Female genotypes were considered as equivalent to 30% (INRA internal communications) of male genotypes, so the 1 946 females in the reference population were assumed to be equivalent to almost 580 male genotypes.
Two reference population sizes were compared. The first one includes only 705 male genotypes (84 from popIA + 9 from popQTL+ 612 simulated) and the second one 1 300 (705 + 580) animals. Finally, a trait with h²=0.3 (like milk yield) was chosen to evaluate the r² parameters.
14
II.2.B. Estimation of GEBV
II.2.B.a. GBLUP
To estimate GEBV of both females and males the genomic linear unbiased predictor (GBLUP) using genomic BLUPF90 (Misztal et al, 2011) was used. The BLUPF90 is a software considering a mixed model: y= Xβ +Zm+e where y is a vector of phenotypes (YD and DYD), X is the incidence matrix relating fixed effects (β) to the individuals, Z is a design matrix allocating observations to breeding values (m) and e is a vector of random normal errors. In this model genotypes information is taking into account in genomic relationship matrix G which is defined as
k ZZ
G= ' where k is a standardization factor which connects marker effects variance to the additive genetic variance. This matrix G is derived from pedigree and genotypes information. In this study pedigree information was considered as 5% and genotypes information as 95% of the matrix. Concerning phenotypes, male observations was considering to be twice DYD because DYD is derived from ½ of sire genetic merit, not as animal genetic merit, and had to be multiplied by two to be comparable to female phenotypes.
II.2.B.a. Calculation of accuracy
Estimates of additive genetic values of all animals and standard deviations of this prediction errors were obtained from GBLUP model. An estimation of the accuracy of prediction was
σ
E2 =(1−CD)×σ
A2, where σE2is the variance of prediction error, σA2thegenetic variance of the trait and CD the prediction accuracy. So we could compute the prediction of accuracy by: 2
2 2 A E A CD
σ
σ
σ
− = .II.2.B.b. Cases studied
The aim of this study was to examine three situations:
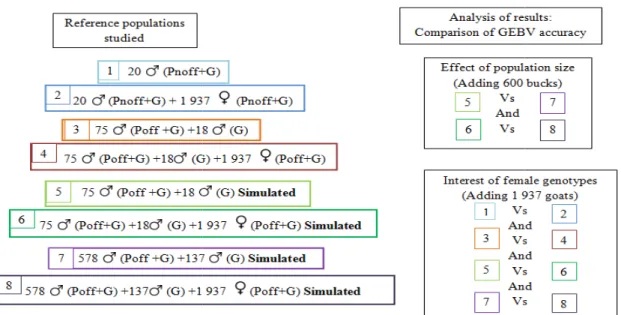
i) The first one was to point out the effect of reference population size on accuracy of GEBV. In this study only simulated genotypes were used. Average GEBV accuracies in a reference population with 93 (84 + 9) males (adding or not females) were compared to those in a reference population including 705 males (adding or not females). ii) Studying interest of female genotypes consisted in comparing GEBV accuracies in two situations: with or without female genotypes. Four cases of reference populations were studied:
- with 20 males phenotyped (with non official evaluation) and genotyped from popQTL (adding or not females),
- with 93 males from popIA and popQTL (with or without females)
Figure 9. Scheme of cases studied for analysis of goat genomic selection results wher
signify that animals are phenotyped (Poff with official evaluation on 2.8 millions of animals and Pnoff with 2 246 females) and G that animals are genotyped
young males which are only genotyped with no phenotypes
Figure 10. Pedigree of the 20 AI bucks (0) that sired the QTL families representing 5
generations in popQTL (Pedigree viewer©)
Table 7. Inbreeding coefficients for pedigree file of IA bucks genotyped animals (
of their daughters (females)
Scheme of cases studied for analysis of goat genomic selection results wher signify that animals are phenotyped (Poff with official evaluation on 2.8 millions of animals
246 females) and G that animals are genotyped. Animals with only G are nly genotyped with no phenotypes (no daughters).
Pedigree of the 20 AI bucks (0) that sired the QTL families representing 5 generations in popQTL (Pedigree viewer©)
Inbreeding coefficients for pedigree file of IA bucks genotyped animals (
Scheme of cases studied for analysis of goat genomic selection results where P signify that animals are phenotyped (Poff with official evaluation on 2.8 millions of animals . Animals with only G are
.
Pedigree of the 20 AI bucks (0) that sired the QTL families representing 5
Inbreeding coefficients for pedigree file of IA bucks genotyped animals (males) and Sire AI bucks
Grand sire Great grand sire
15 - with 705 (93 + 612) males genotypes simulated (with or without females)
iii) Feasibility of genomic selection consisted in comparing GEBV accuracy on these young males to ascendance accuracy (CDasc=0.25×CDdam+0.25×CDsire), it was the expected
accuracy of genetic value at birth excluding genomic information.
Several cases studied were summed up to Figure 9. Correlations between genomic solutions and classical BLUP solutions (with all females or with only females genotyped were calculated for each case).
III.
Results and discussion
III.1. Structures of the two populations genotyped III.1.A. PopQTL
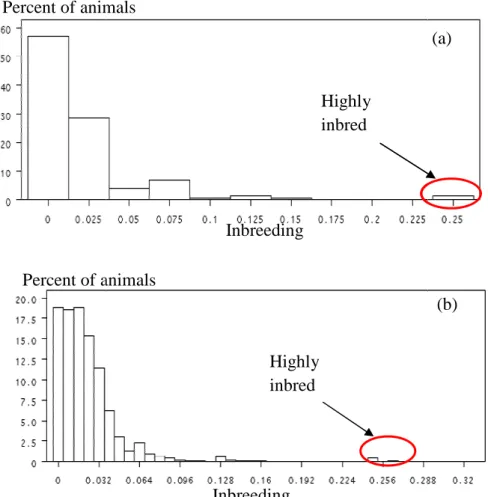
Figure 10 shows pedigree scheme for 5 generations of AI bucks sire line. Individuals circled in yellow are the AI bucks; their ancestors are represented in the top of the scheme. As expected, the 20 sires of the QTL design were not directly related. The first degree of relationship between the 20 bucks was first cousin. The number of equivalent generations known, quite high, was 7.89 in this pedigree, around 8 generations known. Average inbreeding coefficient was 2.11% (1.86% for Alpine and 2.40% for Saanen) with a maximum of 25% for AI bucks of popQTL population. A previous study found an average inbreeding coefficient of 2.06 % for Saanen and 1.05 % for Alpine AI bucks born between 1989 and 1998 (Palhière, 2001). The higher coefficients, found in the two breeds, could be explained by a general increase of inbreeding coefficient after 1999 and of relationship between grand-sire of some AI bucks genotyped and groups of half-sibs for females. The average parental coefficient was 2.1% (2.9% for Alpine and 3.6% for Saanen bucks, Table 8), it is close to those obtained between 1989 and 1998 (3.3% for Saanen males and 2.3% for Alpine ones (Palhière, 2001)). Nevertheless inbreeding and parental coefficients were smaller than those obtained for dairy cattle (0.6 for inbreeding coefficient in Holstein (Miglior, 2000)).
Females of popQTL population were all highly related: 35% of females genotyped have at least one full sib in the population. Average inbreeding coefficient was 2.34 % (2.11% for Alpine and 2.63% for Saanen goats) with 51.7% of inbred animals considering the whole pedigree. As for males, females with high inbreeding coefficient are scarce (Figure 11 a b). These result were close to inbreeding coefficients found in Saanen goats (2.1%) and in Alpine goats (2.35%) for all females born between 2006 and 2008 (Danchin-Burge, 2011).
Figure 11. Distribution of inbreeding coefficient for pedigree file of IA bucks genotyped (a)
and of their daughters (b)
Table 8. Parental coefficient and effective
(males) or of their daughters (females)
popQTL Males Females popIA Males
Percent of animals Percent of animals
Distribution of inbreeding coefficient for pedigree file of IA bucks genotyped (a)
ental coefficient and effective founders of pedigree file of IA bucks genotyped (males) or of their daughters (females)
Average parental coefficient Standard error of parental coefficient Number of Effective founders Males 0.021 0.042 Females 0.021 0.033 Males 0.018 0.024 Highly inbred Highly inbred Inbreeding Inbreeding Percent of animals Percent of animals
Distribution of inbreeding coefficient for pedigree file of IA bucks genotyped (a)
founders of pedigree file of IA bucks genotyped
Number of Effective founders 156 197 271 (a) (b)
16 Average parental coefficient of genotyped females was equal to 2.1%, similar to genotyped males (1.9% for Alpine and 2.5% for Saanen goats, Table 8). It was higher than the ones found in Saanen (1.4%) and in Alpine (1%) goats born between 1989 and 1999 (Palhière, 2001).
Number of effective founders (Table 8) computed for Alpine and Saanen males was 156: 54 effective founders for Saanen bucks and 117 for Alpine. These results were similar to the ones found for Saanen (50) and for Alpine (119) AI bucks born between 1989 and 1999 (Palhière, 2001).
III.1.B. PopIA
Pedigree of popIA was better known than pedigree of popQTL. The number of equivalent generation known was 9.3, one more generation known than in popQTL pedigrees. And the average number of ancestors known for an individual (3 836) was more than twice than the one in popQTL. AI bucks of popIA were more related than bucks of popQTL. 132 bucks from popIA had at least one son in the population genotyped with an average of 5 8 sons per buck. PopIA consisted in 885 bucks having a half sib by sire, 110 animals with half sib by dam and 14 bucks with full sib. PopIA and popQTL had a high level of relationship. Indeed popIA included the 20 bucks from popQTL, among which 14 have 79 sons (6 10 per buck in average) in the popIA. Except the 20 bucks including both in popIA and popQTL, their sons and their sires, 2 490 animals (932 males) were common in the two pedigrees: 33% were anterior to the 4th generation of pedigree of popIA. Twelve bucks genotyped (6 Saanen) and born between 1985 and 1999 in popIA were sires of bucks from popQTL. And 7 bucks from popQTL are grand sires of bucks from popIA. The last degree of relationship between the popIA and popQTL was second cousin.
The average inbreeding coefficient of popIA population was 2.17% (1.88% for Alpine and 2.52% for Saanen bucks) (Table 7). The average parental coefficient was equal to 1.8% (1.8% for Alpine and 2.4% for Saanen), lower than the one found in popQTL (2.1%).
The number of effective founders was 271: 214 from Alpine and 87 from Saanen breeds, higher to the one found in males popQTL pedigree because of a new management of inbreeding (selection with minimum relationship method) in goat species since 2002 (Colleau
et al, 2007). Selection on AI bucks was managed within family (same maternal grand sire) to
Figure 12. Evolution of effective founders’ number between 1970 and 2012. Effective
number of founders is calculated within 4 years of birth.
Figure 13. LD extent in the multi-breed reference population (Alpine and Saanen) function of
distance between two markers (Mb)
Figure 14. LD extent in Alpine breed (DLR13) and in Saanen breed (DLR11) function of ther
distance between two markers
0 100 200 300 400 70-74 74-78 78-82 82-86 86-90 90-94 94-98 98-02 02-06 06-10 10-12
Number of effective founder
year Selection with minimum
of relationship
17 The Figure 12 represents the evolution of effective number of founders by year: an increase has been noticed since 2002 with the new management of matings to avoid increasing of inbreeding rate.
Within the 84 bucks already genotyped, 11 (6 Alpines) were sires of the popQTL. Except these 11 bucks, 4 were sires of bucks from popIA born between 2007 and 2009. Six bucks from popIA had half sibs in popQTL and several parents of bucks from popQTL were grandparents of bucks from popIA. A reference population with a high number of effective founders like in this reference population is not ideal for genomic selection. Indeed GEBV accuracies were in inverse proportion to effective population size as shown Meuwissen’s (2009) prediction equation of GEBV accuracy.
III.2. LD extent in the population genotyped III.2.A. LD within the population
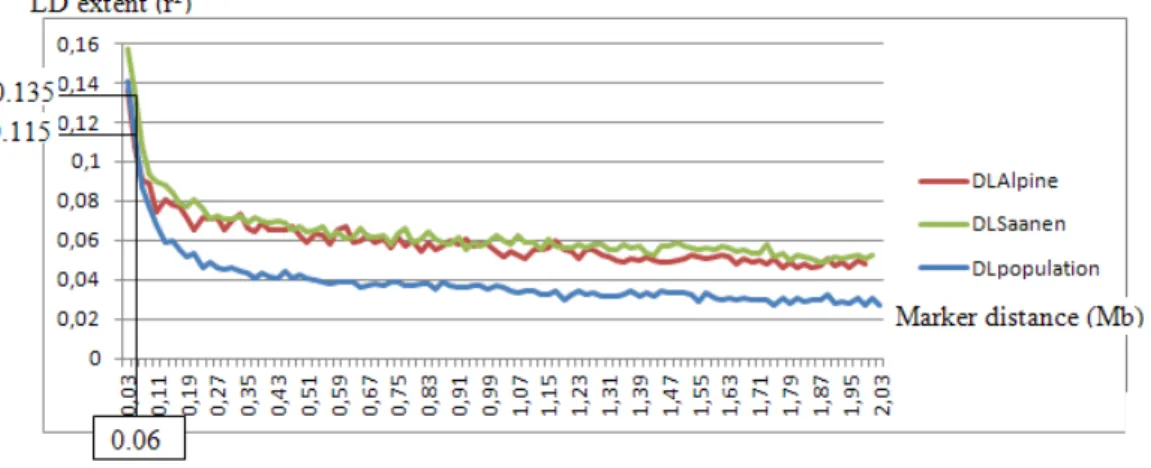
Figure 13 shows LD extent in the multi-breed reference population evaluated with 1 946 females and 93 males genotyped. For marker distances lower than 0.5 Mb, LD extent was close to the one obtained for a population with constant effective population size of 1 000. However for larger marker distances LD extent in the reference population was close to the one calculated for population with effective population size of 250. Indeed LD extent at short distance between SNP reflects former selection because it was a function of effective population size many generations ago. LD at long distance reflects more recent history of the population. Indeed number of recombinations increases with time so LD which is result from past is LD at short distance between markers (Hayes, 2011).
The level of LD extent between two consecutives SNP (i.e. 0.06 Mb for goat chip) was 0.115. It was close to the LD extent found in Lacaune sheep (0.12) but lower to LD extent found in Holstein dairy cattle (0.3) (INRA internal communications). For small distance between markers LD extent in the multi-breed population was close to LD extent calculated separately in Alpine and Saanen breeds (Figure 14). However LD extent was lower for largest distance. Indeed Alpine and Saanen both originate from the Swiss Alps and widely crossbred were managed as purebred in France for more than forty years. Moreover LD in Saanen was slightly higher than LD in Alpine (0.135 vs 0.115 for marker distance of 0.06 Mb) whatever the marker distance considered. Level of LD extent in the goat reference population was small. It was not optimal for genomic selection (Calus et al, 2008). Nevertheless this level of LD was comparable to LD extent in Lacaune sheep for which genomic selection improves GEBV accuracies.
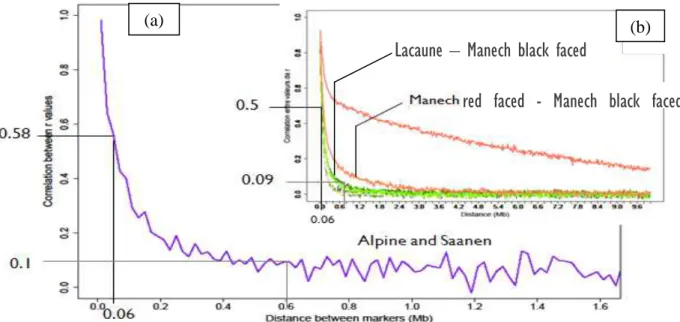
Figure 15. Persistence of LD extent between several breeds: Alpine and Saanen in the
reference population if this study (a) and between ovine breeds (b)
Figure 16. Accuracies of GEBV function of heritability using three predicting equations from
Goddard (2009), Deatwyler (2008) and Meuwissen (2009) with a reference population size of 705 or 1300 (705 males+ 1 946 females i.e. 580 male equivalent).
(a) (b)
Lacaune – Manech black faced
705 705 705
18
III.2.B. Persistence of LD between Alpine and Saanen goats
Persistence of LD phases between Alpine and Saanen in the reference population (Figure 15 (a) in purple) for small distance between markers, 0.58 for 0.06 Mb was comparable to persistence of LD between two ovine French breeds Manech red faced and Manech black faced (Figure 15 (b) in pale orange). The two goat breeds (Alpine and Saanen) were genetically close for generations ago as the two Manech breeds are. However for more recent selection correlations of r values in the reference population (0.1 for 0.6 Mb) was closer to the one found between Lacaune and Manech black faced (0.09 for 0.6 Mb). The high level of LD phases persistence for consecutive marker distances, might improve accuracy of prediction by combining Alpine and Saanen animals in the same reference population.
III.3. Simulation of bucks genotypes
None parental incompatibility was detected in the simulations using Veriftyp2 software (Boichard and Druet, 2008) and LD extent for the 612 simulated genotypes conformed to the one in the reference population. Genotypes of animals with real genotypes were also simulated which allows verifying simulations. Correlations between allelic frequencies calculated on 85 real genotypes from popIA and the one calculated on simulated genotypes of the same bucks was quite high (84.4%). Average correlation between real genotypes of the 85 bucks and simulated genotypes of the same bucks was small (10.9%). Using the 685 simulated genotypes with the 2 039 real genotypes of the reference population did not appear to be feasible. In deed parental incompatibility in the mixed population (612 simulated genotypes + 2 039 real ones) were too high (36.7%). So to study the largest reference population feasible in goat species, all genotypes considered were simulated.
III.4. Prediction of GEBV accuracy level
III.4.A. In functions of the heritability and population size
Figure 16 shows the accuracy of GEBV for different values of heritability. Daetwyler et al (2010) and Goddard (2009)‘s equations gave same results, and they agreed with Hayes et al ‘s study (Hayes et al, 2009b). Predictions of Meuwissen (2009) leaded to higher accuracies than the two others. They were close to real accuracies found in dairy cattle. Even with 1 300 genotypes available and a high heritability, GEBV accuracies for young males did not exceed 0.4. For milk yield (h²=0.3) accuracies of GEBV are expected to be 0.16 and 0.24 for fat percent (h²=0.4), it was really lower than those found in bovine. In the genotyped population (popIA and popQTL), and for milk yield, the CD for males was in average of 0.84 0.38 and 0.55 0.05 for females. For this trait, Meuwissen’s (2009) equation predicts GEBV accuracy
Figure 17. Accuracies of GEBV functions of reference population size (N) using three
predicting equations from Goddard (2009), Deatwyler (2008) and Meuwissen (2009) with effective population size of 250 and a heritability of 0.3.
Figure 18. Real and predicted (by Meuwissen’s equation (2009) ) GEBV accuracies for
Lacaune sheep breed : Ne=230, L=23 M, and N= 2 089 or 1 024 rams (Baloche, personal communication)
Figure 19. Real and predicted (by Meuwissen ’s equation (2009)) GEBV accuracies for
19 for young males, comparable to CD calculated at birth (CDasc). In the genotyped population (males and females), ascendance accuracy was on average of 0.39 0.02 (from 0.30 to 0.41) for milk yield. Predictions of GEBV accuracies were really lower than CD ascendance, genomic selection with such a reference population did not improve accuracy of genetic breeding values. Figure 17 shows GEBV accuracy predictions depending on the reference population size. To improve accuracy of genetic breeding value with genomic selection, a reference population of 4 500 buck genotypes will be necessary according to Meuwissen’s (2009) predictors. Nevertheless these predictions of GEBV accuracies do not take into account the high level of relationship within the reference population considered here. Therefore in this study accuracies were expected to be slightly higher than the ones predicted by those three equations. Besides Meuwissen’s equation (2009) seems to under predict GEBV accuracies. In Lacaune sheep breed (INRA internal communications), genomic evaluation was applied on two reference populations of 1 024 and of 2 089 rams. GEBV accuracies found for dairy traits were higher to those predicted by Meuwissen’s equation (2009) (Figure 18). For instance GEBV accuracy for milk yield was 0.37 (1 024 rams) whereas the equation predicted an accuracy of 0.16. Accuracies obtained in Holstein bulls were also higher than the
one predicted. Indeed, genomic selection applied to 4 000 Holstein bulls (Ne=56 (Moureaux
et al, 2000) and L=30 M) leads to GEBV accuracies between 0.60 and 0.70 for SCC
(Ducrocq, 2010) whereas Meuwissen’s formula (2009) predicted an accuracy of 0.45 (Figure 19). Considering that, the predictions under predict real GEBV accuracies of 25 to 57%, milk yield should give a real GEBV accuracy between 0.20 and 0.25. It is already under CD ascendance for young males. Results of genomic selection in this study are not expected to be good.
III.5.A. Function of LD extent
Calus et al (2008) study relationship between accuracy of genomic breeding value and measure of linkage disequilibrium. Simulation of a bovine population with an effective population size (Ne) of 100, a trait with heritability of 0.5 or 0.1 and a reference population size of 1 100 bulls, allows them to plot GEBV accuracy obtained by Bayesian model as function of r² (Figure 20). In this figure juveniles were young animals with genotypes and without phenotypes, senior animals with genotypes and phenotypes. For juvenile animals, a r² level above 0.12 is necessary to noticed a significant increase of GEBV accuracies. Accounting for level of LD extent in the Alpine and Saanen reference population of this study, GEBV accuracies were expected to be around 0.7 for traits like fat and protein percent