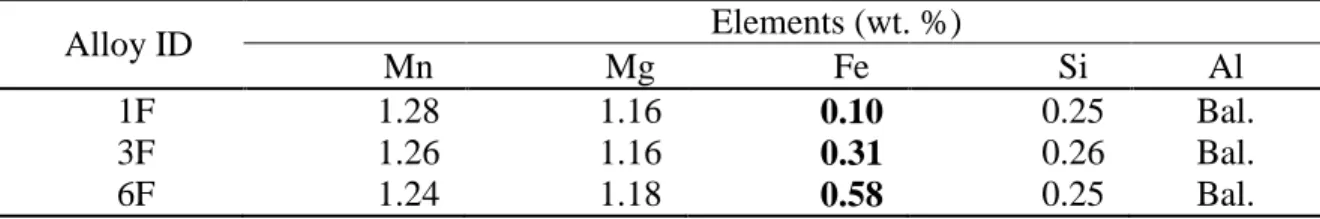
Table 1 - Chemical composition of 3004 alloys used in the present work Alloy ID Elements (wt. %) Mn Mg Fe Si Al 1F 1.28 1.16 0.10 0.25 Bal. 3F 1.26 1.16 0.31 0.26 Bal. 6F 1.24 1.18 0.58 0.25 Bal.
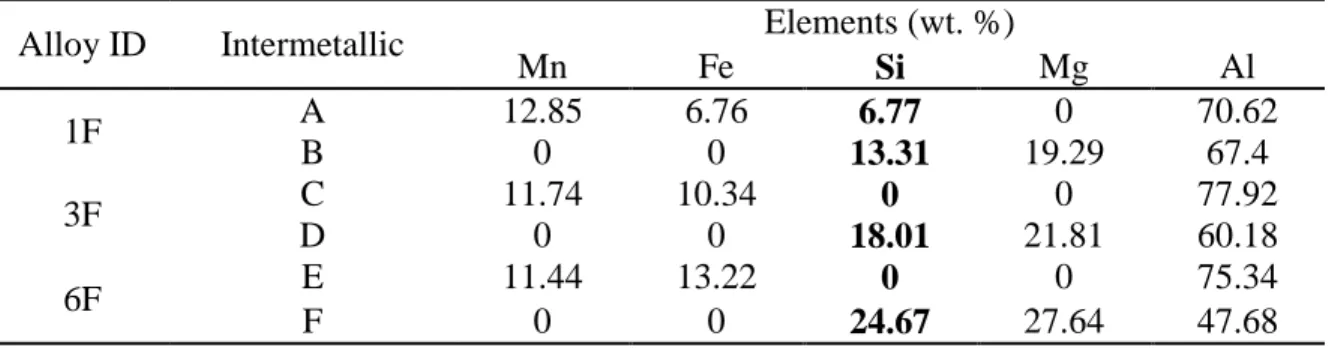
Table 2 - SEM-EDS results for the intermetallics shown in Figure 1
Alloy ID Intermetallic Elements (wt. %)
Mn Fe Si Mg Al 1F A 12.85 6.76 6.77 0 70.62 B 0 0 13.31 19.29 67.4 3F C 11.74 10.34 0 0 77.92 D 0 0 18.01 21.81 60.18 6F E 11.44 13.22 0 0 75.34 F 0 0 24.67 27.64 47.68
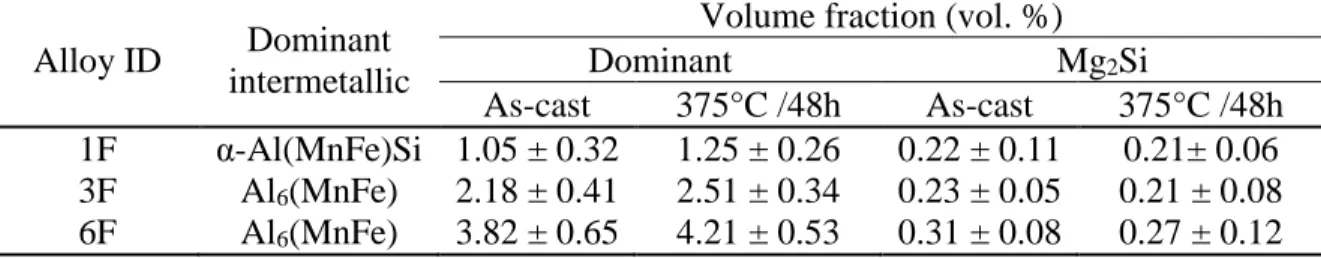
Table 3 - Evolution of intermetallic volume fraction in experimental alloys
Alloy ID Dominant intermetallic
Volume fraction (vol. %)
Dominant Mg2Si
As-cast 375°C /48h As-cast 375°C /48h 1F α-Al(MnFe)Si 1.05 ± 0.32 1.25 ± 0.26 0.22 ± 0.11 0.21± 0.06 3F Al6(MnFe) 2.18 ± 0.41 2.51 ± 0.34 0.23 ± 0.05 0.21 ± 0.08
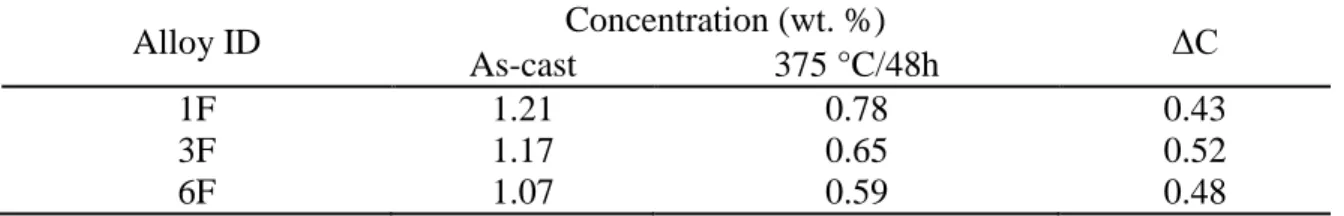
Table 4 Estimated concentration of Mn in solid solution (CMn)
at as-cast and 648K (375°C)/48h conditions
Alloy ID Concentration (wt. %) ΔC
As-cast 375 °C/48h
1F 1.21 0.78 0.43
3F 1.17 0.65 0.52
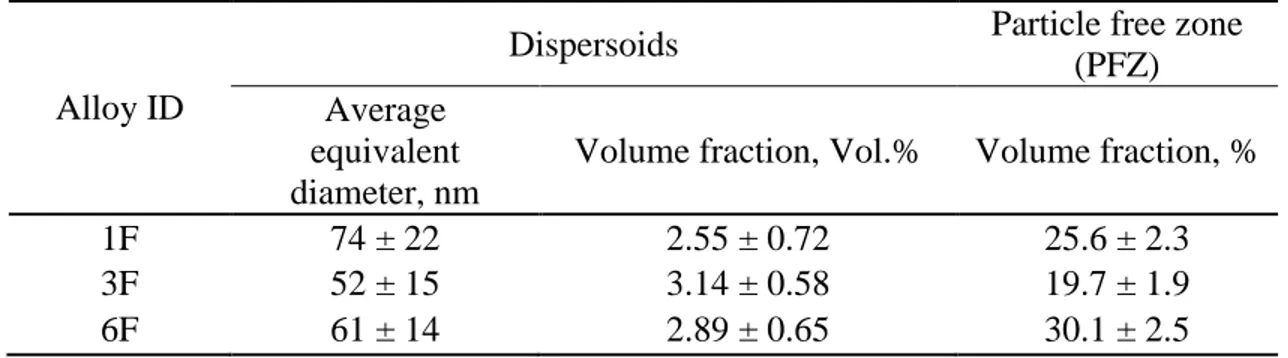
Table 5 - Characterisitic of dispersoids in experimental alloys after 648K (375°C)/48h
Alloy ID
Dispersoids Particle free zone
(PFZ) Average
equivalent diameter, nm
Volume fraction, Vol.% Volume fraction, %
1F 74 ± 22 2.55 ± 0.72 25.6 ± 2.3
3F 52 ± 15 3.14 ± 0.58 19.7 ± 1.9