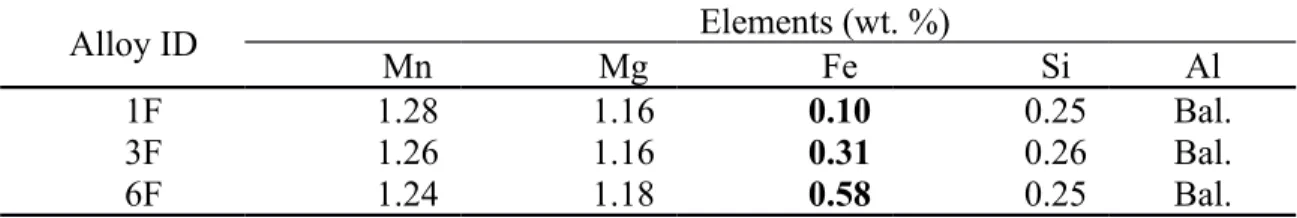
Table 1 - Chemical composition of 3004 alloys used in the present workAlloy IDElements (wt. %)MnMgFeSiAl1F1.281.16
1
0
0
Texte intégral
(2)
(3)
(4)
(5)
Figure


+2

Documents relatifs
In comparing our results with the predictions of the Shiba theory we find that, as in the case of Zn-Mn/5/ the classical theory seems to underestimate the ma- gnitude of the
- A coexistence of local moment and itinerant antiferromagnetism in a-Mn is proposed because two hyperfine fields were observed, which behave differently as function of
Conclusions.- Near TM, the large effective moment on Fe in the Pd(Co,Mn) alloys provides a high sensitivity ME magnetic field probe. These probes represent an order of magni-
Cyclic voltammety is used to the electrochemical analysis, the chemical composition and the morphology of the films obtained at different experimental conditions were examined
The study of the electrodeposition kinetics of Mn-Bi system as a function of the pH and the ammonium sulfate concentration by cyclic vollammetry was used to estimate the
- In the Mn-Pd system the long-period antiphase domain structure was found to exist up to 36 at % Mn- with increasing Mn concentrations the period increases while
In addition, the torque curves, when measured at the lower fields (less than 7 kOe), become somewhat degraded, losing the clear uniaxial character. Once the
The success of the model in predicting the observed hfs in other (random fcc) alloys with less Mn also suggests that the calculation described below does describe
