HAL Id: hal-01635920
https://hal.umontpellier.fr/hal-01635920
Submitted on 5 Feb 2018
HAL is a multi-disciplinary open access
archive for the deposit and dissemination of
sci-entific research documents, whether they are
pub-lished or not. The documents may come from
teaching and research institutions in France or
abroad, or from public or private research centers.
L’archive ouverte pluridisciplinaire HAL, est
destinée au dépôt et à la diffusion de documents
scientifiques de niveau recherche, publiés ou non,
émanant des établissements d’enseignement et de
recherche français ou étrangers, des laboratoires
publics ou privés.
REDD1 deletion prevents dexamethasone-induced
skeletal muscle atrophy
Florian Britto, Gwenaelle Begue, Bernadette Rossano, Aurélie Docquier,
Barbara Vernus, Chamroeun Sar, Arnaud Ferry, Anne Bonnieu, Vincent
Ollendorff, François Favier
To cite this version:
Florian Britto, Gwenaelle Begue, Bernadette Rossano, Aurélie Docquier, Barbara Vernus, et
al..
REDD1 deletion prevents dexamethasone-induced skeletal muscle atrophy.
AJP -
En-docrinology and Metabolism, American Physiological Society, 2014, 307 (11), pp.E983-E993.
�10.1152/ajpendo.00234.2014�. �hal-01635920�
REDD1 deletion prevents dexamethasone-induced skeletal muscle atrophy
Florian A. Britto,1,2,3Gwenaelle Begue,1,2,3Bernadette Rossano,1,2,3Aurélie Docquier,1,2,3
Barbara Vernus,1,2,3Chamroeun Sar,4Arnaud Ferry,5,6Anne Bonnieu,1,2,3Vincent Ollendorff,1,2,3
and François B. Favier1,2,3
1Institut National de la Recherche Agronomique, UMR 866 Dynamique Musculaire et Métabolisme, F-34000 Montpellier, France;2Université Montpellier 1, F-34000 Montpellier, France;3Université Montpellier 2, F-34000 Montpellier, France; 4Institut National de la Sante et de la Recherche Medicale (INSERM) U 583, Institut de Neuroscience de Montpellier, France;5Institut de Myologie, INSERM, U974, Centre National de la Recherche Scientifique UMR 7215, Université Pierre et Marie Curie, Paris, France; and6Université Paris Descartes, Sorbonne Paris Cité, Paris, France
Submitted 19 May 2014; accepted in final form 16 September 2014 Britto FA, Begue G, Rossano B, Docquier A, Vernus B, Sar C, Ferry A, Bonnieu A, Ollendorff V, Favier FB. REDD1 deletion
prevents dexamethasone-induced skeletal muscle atrophy. Am J
Physiol Endocrinol Metab 307: E983–E993, 2014. First published October 14, 2014; doi:10.1152/ajpendo.00234.2014.—REDD1
(regu-lated in development and DNA damage response 1) has been pro-posed to inhibit the mechanistic target of rapamycin complex 1 (mTORC1) during in vitro hypoxia. REDD1 expression is low under basal conditions but is highly increased in response to several cata-bolic stresses, like hypoxia and glucocorticoids. However, REDD1 function seems to be tissue and stress dependent, and its role in skeletal muscle in vivo has been poorly characterized. Here, we investigated the effect of REDD1 deletion on skeletal muscle mass, protein synthesis, proteolysis, and mTORC1 signaling pathway under basal conditions and after glucocorticoid administration. Whereas skeletal muscle mass and typology were unchanged between wild-type (WT) and REDD1-null mice, oral gavage with dexamethasone (DEX) for 7 days reduced tibialis anterior and gastrocnemius muscle weights as well as tibialis anterior fiber size only in WT. Similarly, REDD1 deletion prevented the inhibition of protein synthesis and mTORC1 activity (assessed by S6, 4E-BP1, and ULK1 phosphoryla-tion) observed in gastrocnemius muscle of WT mice following single DEX administration for 5 h. However, our results suggest that REDD1-mediated inhibition of mTORC1 in skeletal muscle is not related to the modulation of the binding between TSC2 and 14-3-3. In contrast, our data highlight a new mechanism involved in mTORC1 inhibition linking REDD1, Akt, and PRAS40. Altogether, these re-sults demonstrated in vivo that REDD1 is required for glucocorticoid-induced inhibition of protein synthesis via mTORC1 downregulation. Inhibition of REDD1 may thus be a strategy to limit muscle loss in glucocorticoid-mediated atrophy.
regulated in development and DNA damage response 1; protein
synthesis; mechanistic target of rapamycin; autophagy; glucocortico-ids; proline-rich Akt substrate of 40 kDa
SKELETAL MUSCLE ATROPHY IS A COMMON FEATURE of several
chronic diseases and is directly correlated with patient quality of life and mortality (30, 31). Muscle atrophy results from an alteration of the balance between protein synthesis and degra-dation (19, 34). For instance, glucocorticoids (GCs), known for promoting muscle wasting, increase the expression of several genes that are involved in protein degradation, such as the transcription factor FOXO1 and the muscle-specific ubiquitin ligase muscle RING finger 1 (MuRF1) (47). Furthermore,
endogenous as well as exogenous GCs have been shown to strongly induce regulated in development and DNA damage 1 (REDD1) expression in skeletal muscle (24, 39, 48). REDD1 is a recently identified protein (15, 40) with a low level of expression under basal conditions. In addition to elevated GC conditions, REDD1 expression is greatly enhanced in several catabolic stresses, such as hypoxia (16), DNA damage (15), energetic stress (42), limb immobilization (22), and unfolding protein response (49). REDD1 has been showed to contribute to apoptosis, oxidative stress, and mechanistic target of rapa-mycin complex 1 (mTORC1) regulation (14). mTORC1 is a multiproteic complex controlling mRNA translation through formation of the translation initiation complex eIF4F (3) and activation of the ribosomal protein S6 (7). mTORC1 activation is regulated by Akt via phosphorylation of the mTORC1 inhibitors tuberous sclerosis complex 2 (TSC2) and proline-rich Akt substrate of 40 kDa (PRAS40), leading to their sequestration by 14-3-3 proteins (9, 23, 37). Akt needs itself to be phosphorylated on two residues (Ser473 and Thr308) to
become fully activated (1). Importantly, REDD1 has been proposed to induce mTORC1 inhibition during hypoxia by releasing TSC2 from 14-3-3 in cell culture (14). In contrast, a recent study showed that REDD1-mediated inhibition of mTORC1 is not related to TSC2/14-3-3 dissociation but is associated with Akt Thr308dephosphorylation in human
em-bryonic kidney (HEK)-293 cells (13). In addition to protein synthesis, mTORC1 also triggers proteolysis via autophagy (ATG) inhibition through phosphorylation of the ATG-initiat-ing protein ULK1 (17, 21). It has been shown that ULK1 promotes autophagic induction via beclin-1 phosphorylation (36) and activation of the autophagosomal elongation factor LC3. Indeed, ULK1 complex inhibition partially represses the activation of LC3 following carbonyl cyanide m-chlorophenyl-hydrazione treatment (11). Interestingly, Molitoris et al. (29) showed that REDD1 promoted LC3 activation and autophago-some formation in lymphocytes following administration of the synthetic GC dexamethasone (DEX). However, this mecha-nism needs to be confirmed in skeletal muscle since REDD1 function seems to be tissue dependent (40).
Although several studies have reported mTORC1 inhibition concomitantly with an increase in REDD1 expression (8, 16, 42, 48), the in vivo mechanism of REDD1-dependent mTORC1 inhibition is poorly described. In addition, it remains to be tested whether REDD1 is responsible for an alteration of the protein synthesis/degradation balance and a reduction in skeletal muscle mass in stress conditions. Moreover, it is not known whether REDD1 deletion affects muscle function and
Address for reprint requests and other correspondence: F. B. Favier, INRA UMR 866, 2 place Pierre Viala, 34060 Montpellier, France (e-mail: favier @supagro.inra.fr).
typology, although it does not seem to affect gastrocnemius muscle weight (50).
We showed here for the first time that REDD1 deficiency does not affect skeletal muscle mass and function in basal conditions. In contrast, REDD1 deletion prevents DEX-in-duced skeletal muscle atrophy by suppressing mTORC1 and protein synthesis inhibition by a mechanism involving Akt and PRAS40.
MATERIALS AND METHODS
Animals
Whole body REDD1-null mice were generated by Lexicon Genet-ics (The Woodlands, TX) specifically for Quark Pharmaceuticals (Fremont, CA), as described previously (5), and are the property of Quark Pharmaceuticals. Wild-type (WT) and knockout (KO) mice were generated from C57Bl6 heterozygous-heterozygous crosses. Genotyping was performed from tail-derived genomic DNA, as de-scribed previously (5). Mice were housed in standard cages with free access to food and water under a 12:12-h dark-light cycle. All animals were euthanized by cervical dislocation and the tissues removed in the morning at the same time frame of the day. These experiments were performed according to European directives (86/609/CEE) and ap-proved by the Languedoc-Roussillon Regional Committee (Comité Régional Languedoc-Roussillon).
DEX Administration
Twenty-week-old female mice were used for all experiments in-volving DEX administration.
Study 1: DEX-induced skeletal muscle atrophy. WT and KO mice
were given 200 g·kg 1·day 1water-soluble DEX (D2915; Sigma-Aldrich, St. Louis, MO) or tap water (CTRL) by gavage for 7 days. At the end of the treatment period, the tibialis anterior (TA) and gastroc-nemius (GAS) muscles were excised bilaterally, weighed, frozen in liquid nitrogen, and stored at 80°C for further analysis. The spleen was also removed and weighed.
Study 2: DEX-induced molecular mechanisms. WT and KO mice
were treated with 1 mg/kg DEX or tap water (CTRL) by oral gavage. Animals were euthanized 5 h after gavage, and both TA and left GAS were quickly frozen in liquid nitrogen and stored at 80°C for further analysis. Right GAS was used immediately for determination of protein synthesis and proteolysis (see below).
Immunohistochemistry
Cross sections (10 m) were cut from TA using cryostat mi-crotome at 20°C. Sections were stained with azorubine (1%) and automatically analyzed for fiber cross-sectional area quantification, as described previously (32). Briefly, sections were scanned using a NanoZoomer (Hamamatsu Photonics, Hamamatsu City, Japan) with a
20 objective, and fiber cross-sectional area was measured with Definiens Developer 7.1 software (Definiens, Munich, Germany). At least 1,700 fibers per muscle were counted.
Muscle typology was determined by the Kaiser and Brooke (6) myosin-ATPase coloration method on sections of the triceps and surae, i.e., GAS and soleus (SOL) muscles. Myofibers from each muscle were identified as being type I, type IIA–IIX, or type IIB fibers.
Muscle Contractile Properties
Gastrocnemius and soleus muscles were evaluated by the measure-ment of in situ isometric muscle contraction in response to nerve stimulation, as described previously (4). Mice were anesthetized using a pentobarbital solution (60 mg/kg ip), and supplemental doses were given as required to maintain deep anesthesia during experiments.
Feet were fixed with clamps to a platform, and knees were immobi-lized using stainless-steel pins. The distal tendons of muscles were attached to an isometric transducer (Harvard Bioscience) using a silk ligature. The sciatic nerves were proximally crushed and distally stimulated by bipolar silver electrode using supramaximal square-wave pulses of 0.1-ms duration. All isometric measurements were made at an initial length of L0 (length at which maximal tension was obtained during the tetanus). Responses to tetanic stimulation (pulse frequency from 50, 100, and 143 Hz) were successively recorded. Maximal tetanic force was determined. Finally, the fatigue resistance was assessed. The fatigue protocol consisted of repeated contractions (100 Hz for 500 ms, evoked once every 2 s) until the muscle lost 30% of its initial force. The fatigability was defined by the time necessary to lose 30% of the initial force. After contractile measurements, mice were euthanized by cervical dislocation.
Protein Synthesis and Proteolysis Measurements
GAS was removed for measurement of protein metabolism, as described previously (41). Briefly, muscles were preincubated for 15 min in Krebs-Henseleit buffer and then transferred to fresh medium of the same composition containing 0.1% bovine serum albumin (99% fatty acid free) and 0.5 mmol/l L-U[14
C]phenylalanine (5.55 KBq/l) for 1 h. We verified that these experimental conditions were not associated with major signs of muscle hypoxia (assessed by VEGFa
and REDD1 mRNA expression; data not shown). At the end of the
incubation period, muscles were weighed and homogenized in 10% trichloroacetic acid (TCA). Homogenates were centrifuged at 10,000
g for 10 min at 4°C, and TCA-insoluble material (which represented
the protein fraction) was washed three times with 10% TCA to eliminate free radioactivity. The resultant pellet was solubilized in 1 mol/l NaOH at 37°C for determination of radioactivity incorporated into muscle protein fraction. Protein-bound radioactivity was mea-sured using liquid scintillation counting. Protein synthesis was calcu-lated by dividing the protein-bound radioactivity by the specific
activity of the phenylalanine in the incubation medium; it was
ex-pressed as nanomoles of phenylalanine incorporated per gram of muscle per hour.
Proteolysis was measured by tyrosine release in the same setup as above. Because tyrosine is neither synthesized nor degraded in mus-cle, the release of tyrosine into the incubation medium directly reflects net protein breakdown. Proteolysis was then estimated by the sum of net tyrosine release into the incubation medium and protein synthesis after conversion of the rate of phenylalanine incorporation into pro-teins into tyrosine equivalents (43). Protein degradation was expressed in nanomoles of tyrosine incorporation per gram of muscle per hour.
Western Blotting
Frozen GAS muscles were powdered, homogenized in lysis buffer (50 mM Tris·HCl, 100 mM NaCl, 5% glycerol, 1 mM EDTA, 1 mM EGTA, 50 mM-glycerophosphate, 50 mM NaF, 1 mM Na3VO4, 1% Triton X-100, and protease inhibitor cocktail) with Fastprep-24 (MP Biomedical, Santa Ana, CA), and centrifuged at 10,000 g for 10 min (4°C). Protein concentrations were determined from the supernatant using the BCA assay (Interchim, Montluçon, France). Fifty micro-grams of protein were subjected to SDS-PAGE on acrylamide 4 –20% precast gels (Bio-Rad, Hercules, CA) and transferred to nitrocellulose membrane. Membranes were blocked in 5% nonfat dry milk in Tris-buffered saline for 1 h and then probed with primary antibody overnight at 4°C. Akt, phospho-Akt Ser 473, phospho-Akt Thr308, S6, phospho-S6 Ser240/244, eIF4E-binding protein-1 (4E-BP1), phospho-4E-BP1 Thr37/46, PRAS40, phospho-PRAS40 Thr246p62 (all from Cell Signaling Technology, Danvers, MA), LC3 (Sigma-Aldrich, St. Louis, MO), and REDD1 (Proteintech, Chicago, IL) were used at a concentration of 1:1,000, ␣-tubulin (Sigma-Aldrich) and 14-3-3 
(SC-1657; Santa Cruz Biotechnology, Dallas, TX) were used at
phospho-TSC2 Ser939, ULK1, and phospho-ULK1 Ser757(Cell Sig -naling Technology) were used at 1:500. The next day, membranes were washed and incubated with horseradish peroxidase-conjugated secondary antibody at 1:3,000 for 1 h at room temperature. Chemi-luminescent horseradish peroxidase substrate (Pierce, Rockford, IL) was then added to the membranes and exposed in a photograph developer.
Immunoprecipitation
Frozen GAS muscles were homogenized in CHAPS lysis buffer (0.3% CHAPS, 40 mM HEPES, pH 7.5, 120 mM NaCl, 1 mM EDTA, 50 mM NaF, 1.5m M Na 3VO4, 10 mM -glycerophosphate, and protease inhibitor cocktail) and centrifuged at 10,000 g (4°C) for 10 min. Five-hundred micrograms of protein from supernatant was di-luted in a final volume of 500 l with the CHAPS buffer. Precleared lysates were incubated with either 5 g of anti-pan-14-3-3 (MA5–
12242; Pierce/Thermo Scientific, Rockford, IL) or 5 g of anti-mouse IgG (IgG1 Isotype control; Cell Signaling Technology) overnight at
4°C. Samples were then incubated for 1 h at 4°C with 100 l of 20% protein G sepharose beads (GE Healthcare, Waukesha, WI) and washed four times with CHAPS buffer before analysis by Western blot.
mRNA Expression Analysis
Total RNA was extracted from the TA muscle using the RNeasy fibrous tissue kit (Qiagen, Venlo, The Netherlands). cDNA was then synthesized using a high-capacity cDNA reverse transcription kit (Applied Biosystem) from 1 g of total mRNA. Purification of cDNA was performed using a PCR cleanup kit (Promega, Madison, WI). Quantitative PCR was performed using KAPA 2 SYBR Green Master Mix on an Miniopticon thermocycler (Bio-Rad). Cycling conditions were one cycle at 98°C for 30 s followed by 40 cycles at 95°C for 1 s and 60°C for 15 s (64°C for BNIP3). Fusion index was measured by increments of 0.5°C every 5 s (starting at 65°C, finishing at 95°C). Each sample was run in duplicate. Sequences of the mouse forward and reverse primers are listed in Table 1. Results were expressed using the comparative cycle threshold (C T) with␣-tubulin as the control gene because its expression remained unchanged across groups. The calculation of the relative changes in the expression level of one specific gene was performed by the ⌬⌬ CTformula. We also took into account the PCR efficiency of primers in the following formula:
Subject’s gene expression
共
1 gene ef ficiency兲
共mean WT CTRL C T subject CT兲共
1 ␣ -tubulin efficiency兲
共mean␣-tubulin WT CTRL CT␣ -tubulin subject CT兲Fecal Corticosterone Metabolites
Corticosterone levels were assayed at base level from feces accord-ing to Touma et al. (44). Briefly, all feces produced duraccord-ing a period over 24 h were collected, dried for 1 h at 37°C, and homogenized in 80% ethanol (wt/vol 1:10). Supernatant was diluted 1:2 with kit assay buffer and stored at 20°C. Corticosterone concentration was deter-mined by using the Correlate EIA Kit (Assay Designs, Ann Arbor, MI) according to the manufacturer’s instructions. Values were ex-pressed based on the total feces collected over a time period and as nanograms of corticosterone per gram of feces. The assay kit has 28.6% cross-reactivity with deoxycorticosterone, a metabolite of cor-ticosterone. Therefore, the values measured represent largely cortico-sterone and these metabolites.
Statistical Analysis
Results are presented as means SE. Data were analyzed by Student’s t-test [absolute maximal force and fatigue resistance (Fig. 1E), glucocorticoid receptor (GR) expression and corticosterone lev-els (Fig. 2C), and muscle weight (Fig. 3A)] and one- (REDD1 mRNA levels within the different muscles; Fig. 1A) or two-way ANOVA
(with genotype and DEX treatment as the 2 factors). Fisher’s least significant difference post hoc analysis was used to determine differ-ences between groups when ANOVA was significant. Statistical analysis of fiber cross-sectional area distribution was performed using the 2
test (Fig. 3C). Statistical significance was set at P 0.05. RESULTS
REDD1-KO Mice Have No Distinct Muscle Phenotype Under Basal Conditions
Like others (5), we did not observe any difference in the body weights of 6- to 25-wk-old males and females between WT and REDD1-KO mice (data not shown). In addition, tibia length (WT: 18.62 0.15 mm; KO: 18.39 0.14 mm) and heart weight (WT: 137.3 4 mg; KO: 142.6 3.2 mg) were similar in 25-wk-old WT and REDD1-KO males. We deter-mined the mRNA level of REDD1 in several muscles of WT
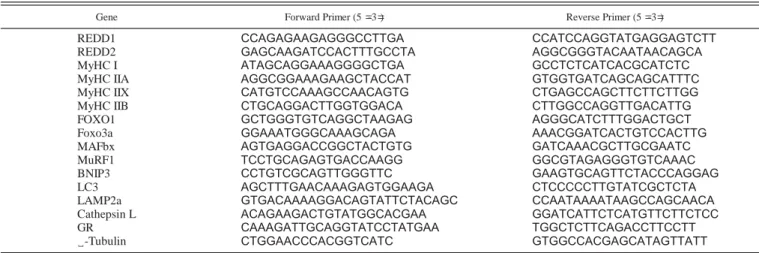
Table 1. Primers used for real-time quantitative PCR
Gene Forward Primer (5=-3=) Reverse Primer (5=-3=)
REDD1 CCAGAGAAGAGGGCCTTGA CCATCCAGGTATGAGGAGTCTT
REDD2 GAGCAAGATCCACTTTGCCTA AGGCGGGTACAATAACAGCA
MyHC I ATAGCAGGAAAGGGGCTGA GCCTCTCATCACGCATCTC
MyHC IIA AGGCGGAAAGAAGCTACCAT GTGGTGATCAGCAGCATTTC
MyHC IIX CATGTCCAAAGCCAACAGTG CTGAGCCAGCTTCTTCTTGG
MyHC IIB CTGCAGGACTTGGTGGACA CTTGGCCAGGTTGACATTG
FOXO1 GCTGGGTGTCAGGCTAAGAG AGGGCATCTTTGGACTGCT
Foxo3a GGAAATGGGCAAAGCAGA AAACGGATCACTGTCCACTTG
MAFbx AGTGAGGACCGGCTACTGTG GATCAAACGCTTGCGAATC
MuRF1 TCCTGCAGAGTGACCAAGG GGCGTAGAGGGTGTCAAAC
BNIP3 CCTGTCGCAGTTGGGTTC GAAGTGCAGTTCTACCCAGGAG
LC3 AGCTTTGAACAAAGAGTGGAAGA CTCCCCCTTGTATCGCTCTA
LAMP2a GTGACAAAAGGACAGTATTCTACAGC CCAATAAAATAAGCCAGCAACA
Cathepsin L ACAGAAGACTGTATGGCACGAA GGATCATTCTCATGTTCTTCTCC
GR CAAAGATTGCAGGTATCCTATGAA TGGCTCTTCAGACCTTCCTT
␣-Tubulin CTGGAACCCACGGTCATC GTGGCCACGAGCATAGTTATT
REDD, regulated in development and DNA damage response; MyHC, mysoin heavy chain; MAFbx, muscle atrophy F-box; MuRF1, muscle RING finger 1; GR, glucocorticoid receptor.
mice (Fig. 1A). We decided to focus on TA and GAS muscles notably because of their high amounts of REDD1 mRNA and the reproducibility in muscle weight determination. Impor-tantly, REDD1 deletion was not compensated by an increase in REDD2 expression, a functionally related protein (Fig. 1B). We next sought to determine whether REDD1 deficiency altered skeletal muscle mass under basal conditions. However, TA and GAS muscles weights were not affected in 2-, 6-, and 13-mo-old REDD1-KO vs. WT males (Fig. 1C). We then explored the contractile phenotype of REDD1-KO muscles. Neither myosin heavy-chain mRNA levels of TA muscle nor typology of SOL and GAS muscles determined by ATPase
0 0.5 1 1.5 2 WT KO 0 10 20 30 40 50 60 WT KO REDD2 0 0.4 0.8 1.2 1.6 DEX acute 1mg/kg 7 days 1mg/kg/d 5h 24h
A
B
7 days 200µg/kg/d**
REDD1***
GR WT KO m R N A ( re la ti v e t o W T C T R L ) m R N A ( re la ti v e t o W T ) 0 20 40 60 80 fe c a l c o rt ic o s te ro n e (n g /g ) WT KO CorticosteroneC
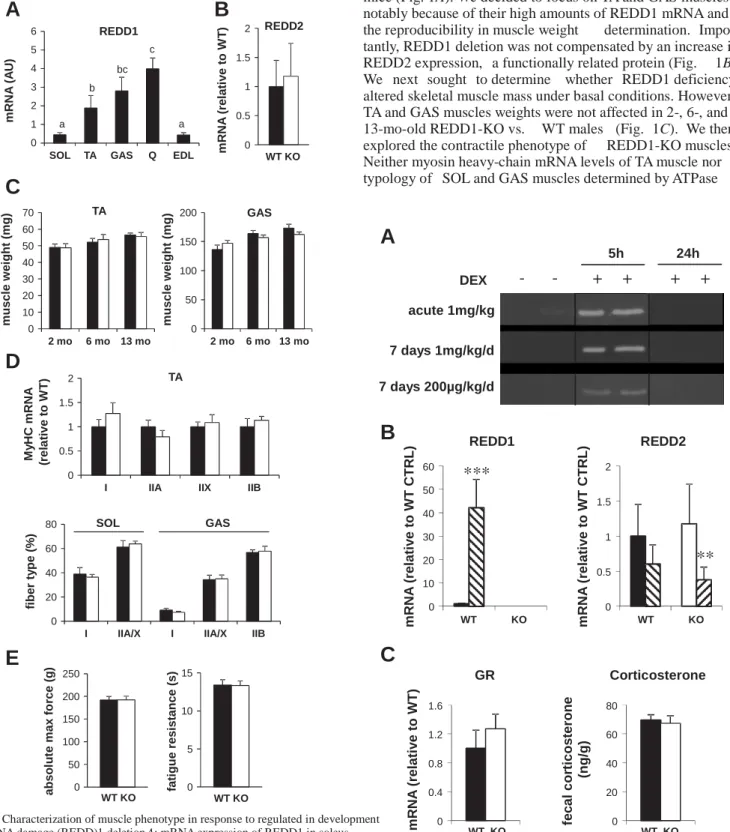
m R N A ( re la ti v e t o W T C T R L )Fig. 2. REDD1 and REDD2 expression in response to dexamethasone (DEX) treatment. A: representative blots of REDD1 in GAS muscle 5 and 24 h after a single (acute) DEX administration (1 mg/kg body wt) or after a 7 days of treatment with 1 mg·kg 1·day 1or 200 g·kg 1·day 1, with the last dose
being administrated 5 or 24 h before muscle sample. B: REDD1 and
REDD2 mRNA levels in TA muscle of CTRL (mice given tap water) or treated WT and REDD1-KO mice (1 mg/kg; n 7– 8/group; treated animals are represented by hatched bars). C: glucocorticoid receptor (GR)
mRNA levels in TA muscle and fecal corticosterone in CTRL WT and REDD1-KO mice (n 7– 8/group). **P 0.01 and ***P 0.01 vs. corresponding CTRL. Data are means SE.
0 50 100 150 200 2 mo 6 mo 13 mo m u s c le w e ig h t (m g ) GAS 0 0.5 1 1.5 2
I IIA IIX IIB
M y H C m R N A (r e la ti v e t o W T ) TA 0 20 40 60 80
I IIA/X I IIA/X IIB
fi b e r ty p e ( % ) SOL GAS 0 5 10 15 0 50 100 150 200 250 WT KO WT KO WT KO 0 1 2 3 4 5 6
SOL TA GAS Q EDL
m R N A ( A U ) REDD1 a a bc c b 0 0.5 1 1.5 2 REDD2
B
A
C
D
E
0 10 20 30 40 50 60 70 2 mo 6 mo 13 mo m u s c le w e ig h t (m g ) TA a b s o lu te m a x f o rc e ( g ) fa ti g u e r e s is ta n c e ( s ) m R N A ( re la ti v e t o W T )Fig. 1. Characterization of muscle phenotype in response to regulated in development and DNA damage (REDD)1 deletion.A: mRNA expression of REDD1 in soleus (SOL), tibialis anterior (TA),gastrocnemius (GAS),quadriceps (Q),and extensor digitorum longus (EDL) of wild-type (WT) mice. Bars with different letters are different from each other (P0.05), whereas values exhibiting the same letters are not significantly different (n 5/group). B: REDD2 mRNA in TA muscle of WT and REDD1-knockout (KO) mice (n7–8/group). C: TA and GAS muscle weights of 2-, 6-, and 13-mo-old WT and REDD1-KO males (n5–7/group). D, top: myosin heavy chain (MyHC) mRNA expression in TA muscle of WT and REDD1-KO males (n 6–7/group). D, bottom: fiber type distribution determined by the ATPase method in SOL and GAS muscles of WT and REDD1-KO females (n 4/group). E: in situ maximal force and resistance to fatigue of triceps surae (GASSOL muscles) in WT and REDD1-KO females (n 7/group). Data are means SE.
activity were different in REDD1-KO vs. WT (Fig. 1D). Finally, we measured the in situ contractility of the triceps surae (GAS SOL muscles) in REDD1-KO and WT female mice. Again, maximal force and resistance to fatigue were similar in both genotypes (Fig. 1E). Together, our results showed that REDD1-KO mice did not exhibit any evident muscle phenotype under basal conditions.
REDD1-KO Mice are Resistant to DEX-Induced Skeletal Muscle Atrophy
We next challenged the animals with DEX administration to induce skeletal muscle atrophy. We used only female mice for DEX experiments because females/women are more respon-sive to DEX-mediated muscle atrophy compared with males/ men (2, 25). We gave a single dose of DEX (1 mg/kg) to WT females. Whereas REDD1 protein content was significantly increased 5 h after the administration, it was undetectable 24 h after the treatment (Fig. 2A). Concerning the 7 days of treat-ment, we checked that REDD1 expression was still inducible
with a similar kinetic (i.e., 5 vs. 24 h; Fig. 2A). Importantly, the
rise in REDD1 protein content was dose dependent (200 g·kg 1·day 1vs. 1 mg·kg 1·day 1; Fig. 2A) and was related
to a strong increase in its mRNA (Fig. 2B). We also measured REDD2 mRNA after acute DEX administration to rule out a potential compensation by REDD2 in KO mice. On the con-trary, REDD2 expression was reduced in GAS muscle of treated REDD1-KO mice compared with CTRL, whereas the decrease failed to reach significance in WT treated animals (P 0.11; Fig. 2B). Since DEX effects are dependent on GR
expression, we checked to determine whether or not its mRNA level was different between WT and KO mice (Fig. 2C).
Moreover, there was no difference in basal corticosterone excretion between WT and REDD1-KO mice (Fig. 2C).
Finally, because 200 g/kg of DEX was sufficient to in-crease REDD1 protein content, and to get closer to the thera-peutic dose, we treated female WT and REDD1-KO mice with 200 g·kg 1·day 1DEX for 7 days. This treatment led to a
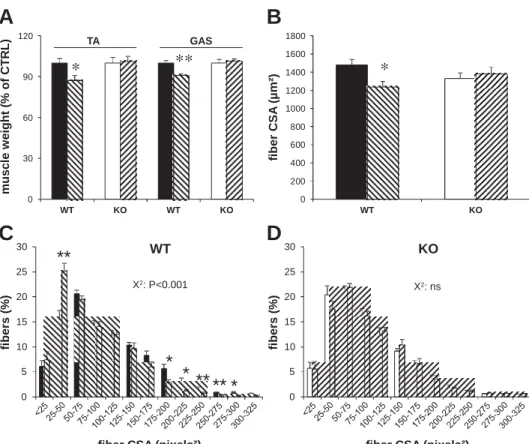
statistically similar loss of spleen mass (Table 2) in WT ( 18%) and KO mice ( 24%), suggesting that animals re-ceived equal amounts of DEX, as proposed by others (2). DEX administration induced a significant loss of body weight only in WT mice ( 8% vs. CTRL; Table 2). The reduction in body mass seen in the DEX-treated WT mice was accompanied by a significant decrease in the mass of both TA ( 12% vs. CTRL) and GAS muscles ( 10% vs. CTRL). In contrast, DEX had no effect on muscle weight of REDD1-KO mice (Fig. 3A). We also measured fiber cross-sectional area (CSA) in the TA of WT and REDD1-KO mice. Consistently with muscle weight, TA of DEX-treated WT mice showed a significant decrease in mean fiber CSA ( 17% vs. CTRL; Fig. 3B) together with a shift in fiber CSA distribution toward smaller
0 30 60 90 120 WT KO WT KO m u s c le w e ig h t (% o f C T R L )
**
*
0 200 400 600 800 1000 1200 1400 1600 1800 O K T W fi b e r C S A ( µ m ²)*
0 5 10 15 20 25 30 fi b e rs ( % ) WT X2: P<0.001fiber CSA (pixels²)
**
*
**
* **
*
0 5 10 15 20 25 30 fi b e rs ( % ) KO X2: nsfiber CSA (pixels²)
A
B
C
D
TA GAS
Fig. 3. Skeletal muscle weights and fiber size in WT and REDD1-KO mice after 7 days of DEX treatment (200 g·kg 1·day 1). A: GAS and
TA muscle weights in WT and REDD1-KO mice after 7 days of water or DEX treatment (n 8 –10/group).B–D: mean fiber cross-sec-tional area (CSA; B) and distributions of fiber CSA from the TA muscle of WT (C) and REDD1-KO mice (D) following water or DEX administration (n 5–7/group, 1,700 fibers/ muscle were counted). *P 0.05 and **P 0.01 vs. corresponding CTRL. Black and open bars, CTRL; hatched bars, DEX-treated mice. Data are means SE.
Table 2. Body and spleen weights of WT and REDD1-KO
mice after DEX or water administration for 7 days
WT WT DEX KO KO DEX
Final BW
(%starting BW) 95.8 0.8 88.4 0.8* 95.5 1.6 92.5 1.1 Spleen, mg 84.6 5.6 61.7 2** 89.1 6.6 66.1 2.3***
Values are means SE. BW, body weight; WT, wild type; KO, knockout; DEX, dexamethasone. *P 0.05, **P 0.01, and ***P 0.001 vs.
sizes (Fig. 3C). Again, no significant change in mean CSA (Fig. 3B) or CSA distribution (Fig. 3C) was found in treated vs. CTRL REDD1-KO mice.
DEX-Induced Decrease in Protein Synthesis and mTORC1 Activity is Impaired in REDD1-KO Muscles
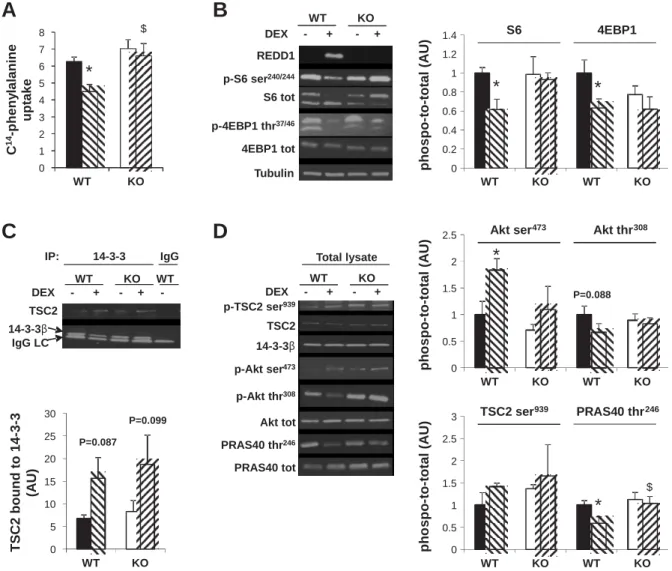
To further characterize the sparing of muscle in REDD1-KO mice, we looked at the mechanisms involved in the protein synthesis/breakdown balance. Because REDD1 protein content returned to basal level 24 h after treatment, all of the following results were obtained 5 h after a single DEX administration. We first measured protein synthesis (by phenylalanine incor-poration) in isolated GAS muscle. Whereas DEX treatment induced a significant decrease in protein synthesis in WT mice ( 28% vs. CTRL), no significant effect was found in REDD1-KO mice (Fig. 4A). The Akt/mTORC1 signaling is a crucial pathway for the regulation of protein synthesis in
skeletal muscle. We thus assessed mTORC1 activity by mon-itoring phosphorylation of some of its downstream targets. DEX treatment induced a significant decrease in the phosphor-ylation of S6 on Ser240/244( 36% vs. CTRL) and 4E-BP1 on
Thr37/46( 37% vs. CTRL) in WT mice (Fig. 4B). In contrast,
no difference in phosphorylation of these targets was found in REDD1-KO mice.
REDD1 has been proposed to negatively regulate mTORC1 activity via the release of TSC2 from 14-3-3 in mouse embry-onic fibroblasts (14). We measured the interaction between 14-3-3 and TSC2 by coimmunoprecipitation in CTRL or treated WT and REDD1-KO muscles. We observed a main positive effect (P 0.026) of DEX on TSC2 sequestration by 14-3-3 in WT ( 132%) and REDD1-KO mice ( 125%) 5 h after administration (Fig. 4C). This increase was accompanied by a significant rise in Akt phosphorylation on Ser 473in WT
treated mice ( 83%, P 0.033), whereas this rise failed to
0 0.5 1 1.5 2 2.5 WT KO WT KO p h o s p o -t o -t o ta l (A U ) Akt ser 473 Akt thr308
*
P=0.088 0 0.2 0.4 0.6 0.8 1 1.2 1.4 WT KO WT KO p h o s p o -t o -t o ta l (A U ) S6 4EBP1 Tubulin p-S6 ser240/244 S6 tot p-4EBP1 thr37/46 4EBP1 tot REDD1 WT KO DEX - + - +*
*
A
B
C
0 1 2 3 4 5 6 7 8 WT KO*
IgG 14-3-3β TSC2 IgG LC IP: WT KO WT DEX - + - + -14-3-3 p-Akt ser473 Akt tot p-TSC2 ser939 14-3-3β Total lysate TSC2 WT KO DEX - + - + p-Akt thr308 PRAS40 thr246 PRAS40 tot 0 5 10 15 20 25 30 WT KO T S C 2 b o u n d t o 1 4 -3 -3 (A U ) P=0.099 P=0.087D
C 1 4-p h e n y la la n in e u p ta k e 0 0.5 1 1.5 2 2.5 3 WT KO WT KO p h o s p o -t o -t o ta l (A U ) TSC2 ser 939 PRAS40 thr246 $*
$Fig. 4. Protein synthesis and Akt/mechanistic target of rapamycin (mTORC1) pathway activation 5 h after DEX administration (1 mg/kg) in GAS muscles of WT and REDD1-KO mice. A: phenylalanine incorporation was measured to assess protein synthesis on isolated muscles 5 h after animals received water or DEX (n 8/group). B: representative blots of S6 and eIF4E-binding protein-1 (4E-BP1) phosphorylation and corresponding quantification in WT and REDD1-KO mice after water or DEX administration (n 7– 8/group). Note that the top band for total S6 is likely a phosphorylated form resulting from the use of gradient gels and long migration. Total S6 quantification was thus performed on both bands. C: representative blots and quantification of tuberous sclerosis complex 2 (TSC2)/14-3-3 binding after immunoprecipitation with pan-14-3-3 antibody (n 3–5/group). D: representative blots and quantification of Akt Ser473and Thr308,
TSC2 Ser939, and PRAS40 Thr246phosphorylation in total GAS lysates (n 7– 8/group). *P 0.05 vs. corresponding CTRL; $P 0.05 vs. corresponding WT
reach statistical significance in REDD1-KO mice ( 54%, P
0.38; Fig. 4D). Akt-dependent TSC2 phosphorylation on Ser939
was correlated with Akt phosphorylation on Ser 473without
reaching significance ( 41%, P 0.32, and 21%, P 0.59, in WT and REDD1-KO treated mice, respectively; Fig. 4D).
However, a recent study showed that REDD1 promotes inhi-bition of Akt by Thr 308dephosphorylation. We observed here
that DEX treatment tended to decrease Akt Thr308( 37%, P
0.088) only in WT mice (Fig. 4D). Akt also activates mTORC1 through inhibitory phosphorylation of PRAS40 (23, 37). Con-sistently with Akt Thr308variations, Akt-dependent PRAS40
phosphorylation on Thr246 was significantly decreased in
DEX-treated WT mice only ( 40%, P 0.05; Fig. 4D).
Importantly, we observed the same results on the mTORC1 pathway in TA muscle (n 3; data not shown).
Proteolysis is Not Increased 5 h After DEX Administration in Either WT or REDD1-KO Mice
With muscle mass resulting from the balance between pro-tein synthesis and proteolysis, we next investigated the activa-tion of the proteolytic machinery. GCs are known to promote proteolysis by increasing the expression of specific genes involved in the ubiquitin/proteasome system (UPS) and the autophagy processes. Protein degradation, assessed by tyrosine release, was not affected in either WT or REDD1-KO mice 5 h after DEX administration in GAS muscle (Fig. 5A). We found the same result in extensor digitorum longus (EDL) muscle (data not shown). Consistently, the profile of ubiquiti-nated proteins remained unchanged (Fig. 5B). In contrast, mRNA content of the transcription factors forkhead box O1 (FOXO1) and FOXO3a showed a significant increase in both WT and REDD1-KO treated mice (Fig. 5C). Concerning the muscle-specific E3 ligases, DEX increased MuRF1 mRNA level in WT and REDD1-KO mice, although it had no signif-icant effect on MAFbx expression (Fig. 5D). Analysis of autophagy markers revealed a significant increase in the LC3-II/LC3-I ratio together with a decrease in ULK1 inhibitory Ser757phosphorylation in WT mice only (Fig. 5E). However,
we showed a significant and similar decrease in p62 expression in both WT and REDD1-KO mice after DEX treatment (Fig. 5E). In parallel, mRNA expression of four genes involved in autophagy/lysosome degradation, BNIP3, LAMP2A, LC3, and cathepsin L, displayed a significant increase in both WT and REDD1-KO treated mice (Fig. 5F), with the response to DEX being not different between genotypes.
DISCUSSION
The aim of this study was to investigate the effect of REDD1 deletion on skeletal muscle phenotype under basal conditions and during DEX-induced atrophy. Although REDD1 has been characterized as a negative regulator of mTORC1, its deletion does not promote skeletal muscle hypertrophy under basal conditions, which is in agreement with the recent report of Williamson et al. (50) on the gastrocnemius muscle. This result is consistent with the fact that REDD1 is expressed to a low level under basal conditions. However, we showed here for the first time that REDD1 inhibition prevents GC-mediated muscle atrophy in mice via the suppression of the inhibitory effect of DEX on protein synthesis and mTORC1 activity through a REDD1-Akt-PRAS40 axis (Fig. 6).
Experimental Model
Treatment with synthetic GCs is associated with skeletal muscle atrophy and/or a so-called steroid myopathy. This deleterious condition affects many patients suffering from respiratory diseases, autoimmune diseases, or cancers. Re-cently, several teams have shown that the mTORC1 inhibitor REDD1 was strongly induced by DEX administration in skel-etal muscle tissue (24, 39, 48). Thus, one objective of this study was to determine the role of REDD1 on DEX-induced skeletal muscle atrophy. We used relatively low doses of DEX and short treatment durations compared with those usually given in rodent studies [e.g., Baehr et al. (2), 3 mg/kg for 14 days; Gilson et al. (18), 5 mg/kg for 4 days; Proserpio et al. (33), 2
mg/kg for 14 days]. We found that 200 g·kg 1·day 1DEX
for 7 days was sufficient to cause skeletal muscle atrophy and to raise REDD1 protein content in GAS muscle of WT female mice. We decided to focus on TA and GAS muscles because they can be accurately removed and weighed and because REDD1 mRNA levels were greater than in SOL and EDL muscles. Moreover, these type II fiber-rich muscles express high amounts of GR (39) and are thus more sensitive to the GC-atrophying effect. Accordingly, we observed similar re-sults on muscle weight and the mTORC1 pathway between GAS and TA after DEX treatment. Because we did not observe any difference in the typology between KO and WT muscles, the resistance to DEX-induced atrophy is not related to a more oxidative phenotype in REDD1-KO animals. Females/women are more responsive to DEX-mediated muscle atrophy com-pared with males/men (2, 25). This greater sensitivity may be related to the anabolic effects of testosterone that prevent skeletal muscle atrophy when coadministered with DEX (51). Interestingly, the protective effect of testosterone has been associated with a lack of increase in REDD1 expression upon DEX treatment (51), underlining the importance of REDD1 in promoting muscle atrophy.
Role of REDD1 on mTORC1 Pathway
REDD1 gene expression is highly sensitive to many stresses in different tissues (15, 16, 22, 49). We used short-term DEX treatment to depict the molecular mechanisms underlying mus-cle mass protection in REDD1-KO mice. The strong increase in REDD1 mRNA and protein level 5 h after gavage with DEX in WT mice was correlated with reduced phosphorylation of downstream mTORC1 targets (S6 Ser240/244, 4E-BP1 Thr37/46,
and ULK1 Ser757) along with the reduction in protein synthe
-sis. In contrast, DEX-treated REDD1-KO mice did not exhibit any impairment either in the Akt/mTORC1 pathway or on protein synthesis, leading to muscle mass sparing. To investi-gate how REDD1 acts on the mTORC1 pathway, we measured the interaction between 14-3-3 and TSC2, a mechanism pro-moted by Akt that results in TSC2 inhibition (9). Indeed, DeYoung et al. (14) proposed that REDD1 could release TSC2 from 14-3-3 during in vitro hypoxia, leading to mTORC1 inhibition. Contrary to these expectations, we found a positive effect of DEX on TSC2/14-3-3 interaction in WT and REDD1-KO treated mice vs. CTRL. The binding of 14-3-3 on TSC2 is triggered by Akt-dependent TSC2 phosphorylation (9). In our conditions, the increase in TSC2 sequestration by 14-3-3 was associated with a significant increase in Akt Ser 473
0 0.2 0.4 0.6 0.8 1 1.2 1.4 WT KO u b iq u it in ( A U ) WT KO DEX - + - + Ubiquitin Tubulin p-ULK1 ser757 ULK1 tot p62 LC3-II LC3-I 0 1 2 3 4 5 WT KO L C 3 -I I/ I (A U )
*
$ 0 0.2 0.4 0.6 0.8 1 1.2 WT KO*
*
0 0.5 1 1.5 WT KO*
$A
C
B
D
0 10 20 30 40 50 60 70 WT KO ty ro s in e r e le a s e (n m o l/ h /g m u s c le ) 0 2 4 6 8 10 WT KO WT KO m R N A ( re la ti v e t o W T C T R L ) 0 2 4 6 8 10 12 WT KO WT KO m R N A ( re la ti v e t o W T C T R L )***
***
***
*
**
*
P=0.08FOXO1 FOXO3a MuRF1 MAFbx
U L K p h o s p h o -t o -t o ta l (A U ) p 6 2 ( A U ) 0 1 2 3 4 5 WT KO WT KO WT KO WT KO
**
*
**
***
***
*
**
*
BNIP3 LC3 LAMP2A CATHL
E
F
m R N A ( re la ti v e t o W T C T R L ) DEX - + - + WT KOFig. 5. Proteolysis and proteolytic markers 5 h after DEX administration (1 mg/kg) in WT and REDD1-KO mice. A: tyrosine release was measured to assess
degradation on isolated GAS muscles (n 8/group). B: representative blot and quantification of ubiquitinated proteins in GAS muscle of CTRL and DEX-treated animals (n 7– 8/group). C and D: mRNA levels of genes related to UPS activation in TA muscles of CTRL and DEX-treated WT and REDD1-KO mice. Expression of individual genes was normalized to ␣-tubulin and expressed as fold change from WT CTRL values (n 7– 8/group). E: representative blots and corresponding quantifications of ATG markers in GAS muscles of CTRL and DEX-treated WT and REDD1-KO mice (n 7– 8/group). F: mRNA levels of genes involved in ATG activation in TA muscles of CTRL and DEX-treated WT and REDD1-KO mice. Expression of individual genes was normalized to ␣-tubulin and expressed as fold change from WT CTRL values (n 7– 8/group). CATHL, cathepsin L. *P 0.05, **P 0.01, and ***P 0.001 vs. corresponding
Akt-dependent TSC2 Ser939phosphorylation. Akt phosphory
-lation has been shown to be inhibited by the negative feedback loop of mTORC1/S6K on insulin receptor substrate-1 (45). Here, the increase in Akt Ser473phosphorylation in WT treated
mice was likely caused by the decrease in this feedback since mTORC1 was inhibited, leading to the observed increase in TSC2/14-3-3 association. In REDD1-KO mice, DEX failed to reduce the S6K negative feedback on Akt since S6 Ser 240/244
and Akt Ser473phosphorylations were unchanged. However,
TSC2/14-3-3 binding increased to a similar extent in REDD1-KO and WT muscles, suggesting a more complex regulation of TSC2 sequestration. Recently, Dennis et al. (13) showed that REDD1 was responsible for Akt Thr308
dephos-phorylation in cultured cells, leading to mTORC1 inhibition.
Accordingly, we observed that DEX induced a decrease in Akt Thr308phosphorylation in WT mice only. Importantly, it has
been demonstrated that this phosphorylation is required for full activation of Akt (1). Consistently, the observed decrease in Akt Thr308phosphorylation was associated with a reduction in
its inhibitory action on the mTORC1 inhibitor PRAS40. Inter-estingly, it has been proposed that PRAS40 could be seques-trated by 14-3-3 following its phosphorylation by Akt in cell culture (23, 46). Although we also observed a coimmunopre-cipitation (IP) between PRAS40 and 14-3-3 in HEK-293 cells, we did not detect this complex in mouse skeletal muscle using the same lysis buffer, antibodies, or IP condition (data not shown). Altogether, our results suggest a complex regulation of Akt substrates depending on Akt residue phosphorylation (Ser473or Thr308; Fig. 6).
In summary, our data support an inverse correlation between REDD1 expression and mTORC1 activity, and this regulation seems to be Akt/PRAS40 dependent.
Proteolytic Systems Activation
GCs have been shown to promote muscle proteolysis after repeated daily administration (2, 12). However, 5 h after DEX treatment, we did not observe any change in tyrosine release or ubiquitin profile in either WT or REDD1-KO GAS muscle, suggesting that proteolysis was not activated at this early time. Moreover, tyrosine release was not affected by acute DEX administration on EDL muscle (data not shown). In contrast, p62 protein content was significantly decreased in both WT and REDD1-KO muscles after DEX treatment, suggesting enhancement of autophagy flux. It is likely that tyrosine release and ubiquitin profile, two global markers of protein degrada-tion, require more time to present signification variations. We further investigated the mechanisms regulating UPS and au-tophagy/lysosomal activity, as these two systems contribute to GC-mediated proteolysis. DEX induced a similar increase in mRNA level of MuRF1 (UPS), BNIP3, LC3, LAMP2A, and cathepsin L (ATG/lysosomal system) as well as FOXO1 and -3 (UPS and ATG/lysosomal system) in both WT and KO mice. This shows that REDD1 does not play a role in the transcrip-tional response of atrogenes consecutive to DEX treatment. In addition, ATG can be activated by the release of mTORC1 inhibition on ULK1 (52). Once activated, ULK1 partially promotes LC3 lipidation (11), i.e., the conversion from LC3-I to LC3-II, a common marker of autophagosome maturation. We observed a decrease in the mTORC1-dependent ULK1 phosphorylation together with an increase in LC3 activation after DEX treatment only in WT mice. In accord with our data, Molitoris et al. (29) reported that DEX-induced REDD1 ex-pression promotes LC3 lipidation and autophagosome forma-tion in lymphocytes. Taken together, these results suggest that REDD1 is required to induce the ULK1-dependent LC3 acti-vation following DEX administration. However, because pro-teolysis, ubiquitin profile, and p62 degradation were un-changed between treated WT and KO mice, this means that REDD1-mediated LC3 activation is not sufficient to strongly modulate protein breakdown 5 h after DEX administration. Finally, the major event at early time points after GC stimu-lation is a reduction in protein synthesis rather than an increase in proteolysis.
A
B
Fig. 6. Proposed mechanism of REDD1-mediated inhibition on mTORC1 after DEX administration. A: in the basal state, Akt is phosphorylated on both Ser473
and Thr308. In this configuration, Akt inhibits PRAS40 and TSC2 by phos
-phorylating them on Thr 246and Ser939, respectively. PRAS40 and TSC2
inhibition leads to mTORC1 activation, which is responsible for protein synthesis and a negative feedback loop on Akt. B: DEX induces REDD1
protein expression, which decreases Akt Thr308phosphorylation. The resulting
activation of PRAS40 results in mTORC1 inhibition, leading to a decrease in the negative feedback loop on Akt (Ser 473) translating in TSC2 phosphoryla
-tion (Ser939). Dashed lines correspond to multistep regulations.
In summary, we provide in vivo evidence that REDD1 deficiency prevents skeletal muscle loss after 7 days of treat-ment with low doses of GC. In this context, the absence of REDD1 prevents the GC-induced decrease in mTORC1 activ-ity and in protein synthesis. GCs are widely used for treatment of autoimmune and inflammatory diseases, and high levels of endogenous GC have also been reported in several diseases or catabolic states such as diabetes mellitus (20), sepsis (38), metabolic acidosis (27), or fasting (28). Given that 1) REDD1 basal expression is very low but strongly increased in catabolic states and 2) basal REDD1 inhibition does not lead to an obvious phenotype, this makes it a potential target for the prevention of muscle wasting.
ACKNOWLEDGMENTS
We are grateful to Quark Pharmaceuticals for providing the REDD1-knockout mice. We thank François Casas, Elena Feinstein, and Barbara Diamant for critical reading of the manuscript.
Present address of G. Begue: Human Performance Laboratory, Ball State University, 2000 W. University Ave., Muncie, IN 47306.
GRANTS
F. A. Britto was supported by an Allocation Doctorale de Recherche from the Ministère de l’Enseignement Supérieur et de la Recherche.
DISCLOSURES
No conflicts of interest, financial or otherwise, are declared by the authors.
AUTHOR CONTRIBUTIONS
F.A.B., V.O., and F.B.F. conception and design of research; F.A.B., G.B., B.R., A.D., B.V., C.S., A.F., V.O., and F.B.F. performed experiments; F.A.B. and F.B.F. analyzed data; F.A.B., A.B., V.O., and F.B.F. interpreted results of experiments; F.A.B. and F.B.F. prepared figures; F.A.B., V.O., and F.B.F. drafted manuscript; F.A.B., G.B., A.D., A.F., A.B., V.O., and F.B.F. edited and revised manuscript; F.A.B., G.B., B.R., A.D., B.V., C.S., A.F., A.B., V.O., and F.B.F. approved final version of manuscript.
REFERENCES
1. Alessi DR, Andjelkovic M, Caudwell B, Cron P, Morrice N, Cohen P,
Hemmings BA. Mechanism of activation of protein kinase B by insulin
and IGF-1. EMBO J 15: 6541–6551, 1996.
2. Baehr LM, Furlow JD, Bodine SC. Muscle sparing in muscle RING finger 1 null mice: response to synthetic glucocorticoids. J Physiol 589: 4759 –4776, 2011.
3. Beretta L, Gingras AC, Svitkin YV, Hall MN, Sonenberg N. Rapamy-cin blocks the phosphorylation of 4E-BP1 and inhibits cap-dependent initiation of translation. EMBO J 15: 658 –664, 1996.
4. Blondet B, Carpentier G, Ferry A, Courty J. Exogenous pleiotrophin applied to lesioned nerve impairs muscle reinnervation. Neurochem Res
31: 907–913, 2006.
5. Brafman A, Mett I, Shafir M, Gottlieb H, Damari G, Gozlan-Kelner
S, Vishnevskia-Dai V, Skaliter R, Einat P, Faerman A, Feinstein E, Shoshani T. Inhibition of oxygen-induced retinopathy in
RTP801-defi-cient mice. Invest Ophthalmol Vis Sci 45: 3796 –3805, 2004.
6. Brooke MH, Kaiser KK. Three “myosin adenosine triphosphatase” systems: the nature of their pH lability and sulfhydryl dependence. J
Histochem Cytochem 18: 670 –672, 1970.
7. Brown EJ, Beal PA, Keith CT, Chen J, Shin TB, Schreiber SL. Control of p70 s6 kinase by kinase activity of FRAP in vivo. Nature 377: 441–446, 1995.
8. Brugarolas J, Lei K, Hurley RL, Manning BD, Reiling JH, Hafen E,
Witters LA, Ellisen LW, Kaelin WG, Jr. Regulation of mTOR function
in response to hypoxia by REDD1 and the TSC1/TSC2 tumor suppressor complex. Genes Dev 18: 2893–2904, 2004.
9. Cai SL, Tee AR, Short JD, Bergeron JM, Kim J, Shen J, Guo R,
Johnson CL, Kiguchi K, Walker CL. Activity of TSC2 is inhibited by
AKT-mediated phosphorylation and membrane partitioning. J Cell Biol
173: 279 –289, 2006.
10. Chaillou T, Koulmann N, Simler N, Meunier A, Serrurier B, Chapot
R, Peinnequin A, Beaudry M, Bigard X. Hypoxia transiently affects
skeletal muscle hypertrophy in a functional overload model. Am J Physiol
Regul Integr Comp Physiol 302: R643–R654, 2012.
11. Chen D, Chen X, Li M, Zhang H, Ding WX, Yin XM. CCCP-Induced LC3 lipidation depends on Atg9 whereas FIP200/Atg13 and Beclin 1/Atg14 are dispensable. Biochem Biophys Res Commun 432: 226 –230, 2013.
12. Combaret L, Taillandier D, Dardevet D, Bechet D, Ralliere C,
Claus-tre A, Grizard J, Attaix D. Glucocorticoids regulate mRNA levels for
subunits of the 19 S regulatory complex of the 26 S proteasome in fast-twitch skeletal muscles. Biochem J 378: 239 –246, 2004.
13. Dennis MD, Coleman CS, Berg A, Jefferson LS, Kimball SR. REDD1 enhances protein phosphatase 2A-mediated dephosphorylation of Akt to repress mTORC1 signaling. Sci Signal 7: ra68, 2014.
14. DeYoung MP, Horak P, Sofer A, Sgroi D, Ellisen LW. Hypoxia regulates TSC1/2-mTOR signaling and tumor suppression through REDD1-mediated 14-3-3 shuttling. Genes Dev 22: 239 –251, 2008. 15. Ellisen LW, Ramsayer KD, Johannessen CM, Yang A, Beppu H,
Minda K, Oliner JD, McKeon F, Haber DA. REDD1, a
developmen-tally regulated transcriptional target of p63 and p53, links p63 to regula-tion of reactive oxygen species. Mol Cell 10: 995–1005, 2002. 16. Favier FB, Costes F, Defour A, Bonnefoy R, Lefai E, Bauge S,
Peinnequin A, Benoit H, Freyssenet D. Downregulation of
Akt/mam-malian target of rapamycin pathway in skeletal muscle is associated with increased REDD1 expression in response to chronic hypoxia. Am J Physiol Regul Integr Comp Physiol 298: R1659 –R1666, 2010.
17. Ganley IG, Lam du H, Wang J, Ding X, Chen S, Jiang XULK1.
ATG13. ULK1.ATG13.FIP200 complex mediates mTOR signaling and is essential for autophagy. J Biol Chem 284: 12297–12305, 2009. 18. Gilson H, Schakman O, Combaret L, Lause P, Grobet L, Attaix D,
Ketelslegers JM, Thissen JP. Myostatin gene deletion prevents
gluco-corticoid-induced muscle atrophy. Endocrinology 148: 452–460, 2007. 19. Goldberg AL, Tischler M, DeMartino G, Griffin G. Hormonal
regula-tion of protein degradaregula-tion and synthesis in skeletal muscle. Fed Proc 39: 31–36, 1980.
20. Hu Z, Wang H, Lee IH, Du J, Mitch WE. Endogenous glucocorticoids and impaired insulin signaling are both required to stimulate muscle wasting under pathophysiological conditions in mice. J Clin Invest 119: 3059 –3069, 2009.
21. Jung CH, Jun CB, Ro SH, Kim YM, Otto NM, Cao J, Kundu M, Kim
DH. ULK-Atg13-FIP200 complexes mediate mTOR signaling to the autophagy machinery. Mol Biol Cell 20: 1992–2003, 2009.
22. Kelleher AR, Kimball SR, Dennis MD, Schilder RJ, Jefferson LS. The mTORC1 signaling repressors REDD1/2 are rapidly induced and activa-tion of p70S6K1 by leucine is defective in skeletal muscle of an immo-bilized rat hindlimb. Am J Physiol Endocrinol Metab 304: E229 –E236, 2013.
23. Kovacina KS, Park GY, Bae SS, Guzzetta AW, Schaefer E, Birnbaum
MJ, Roth RA. Identification of a proline-rich Akt substrate as a 14-3-3
binding partner. J Biol Chem 278: 10189 –10194, 2003.
24. Kumari R, Willing LB, Jefferson LS, Simpson IA, Kimball SR. REDD1 (regulated in development and DNA damage response 1) expres-sion in skeletal muscle as a surrogate biomarker of the efficiency of glucocorticoid receptor blockade. Biochem Biophys Res Commun 412: 644 –647, 2011.
25. Lew KH, Ludwig EA, Milad MA, Donovan K, Middleton E, Jr., Ferry
JJ, Jusko WJ. Gender-based effects on methylprednisolone
pharmacoki-netics and pharmacodynamics. Clin Pharmacol Ther 54: 402–414, 1993. 26. Masschelein E, Van Thienen R, D’Hulst G, Hespel P, Thomis M,
Deldicque L. Acute environmental hypoxia induces LC3 lipidation in a
genotype-dependent manner. FASEB J 28: 1022–1034, 2014.
27. May RC, Kelly RA, Mitch WE. Metabolic acidosis stimulates protein degradation in rat muscle by a glucocorticoid-dependent mechanism. J
Clin Invest 77: 614 –621, 1986.
28. McGhee NK, Jefferson LS, Kimball SR. Elevated corticosterone asso-ciated with food deprivation upregulates expression in rat skeletal muscle of the mTORC1 repressor, REDD1. J Nutr 139: 828 –834, 2009. 29. Molitoris JK, McColl KS, Swerdlow S, Matsuyama M, Lam M, Finkel
TH, Matsuyama S, Distelhorst CW. Glucocorticoid elevation of
dexa-methasone-induced gene 2 (Dig2/RTP801/REDD1) protein mediates au-tophagy in lymphocytes. J Biol Chem 286: 30181–30189, 2011.
30. Mostert R, Goris A, Weling-Scheepers C, Wouters EF, Schols AM. Tissue depletion and health related quality of life in patients with chronic obstructive pulmonary disease. Respir Med 94: 859 –867, 2000. 31. Painter PL, Topp KS, Krasnoff JB, Adey D, Strasner A, Tomlanovich
S, Stock P. Health-related fitness and quality of life following steroid withdrawal in renal transplant recipients. Kidney Int 63: 2309 –2316, 2003. 32. Pessemesse L, Schlernitzauer A, Sar C, Levin J, Grandemange S,
Seyer P, Favier FB, Kaminski S, Cabello G, Wrutniak-Cabello C, Casas F. Depletion of the p43 mitochondrial T3 receptor in mice affects
skeletal muscle development and activity. FASEB J 26: 748 –756, 2012. 33. Proserpio V, Fittipaldi R, Ryall JG, Sartorelli V, Caretti G. The methyltransferase SMYD3 mediates the recruitment of transcriptional cofactors at the myostatin and c-Met genes and regulates skeletal muscle atrophy. Genes Dev 27: 1299 –1312, 2013.
34. Rannels SR, Rannels DE, Pegg AE, Jefferson LS. Glucocorticoid
effects on peptide-chain initiation in skeletal muscle and heart. Am J Physiol Endocrinol Metab Gastrointest Physiol 235: E134 –E139, 1978.
35. Reiling JH, Hafen E. The hypoxia-induced paralogs Scylla and Charyb-dis inhibit growth by down-regulating S6K activity upstream of TSC in Drosophila. Genes Dev 18: 2879 –2892, 2004.
36. Russell RC, Tian Y, Yuan H, Park HW, Chang YY, Kim J, Kim H,
Neufeld TP, Dillin A, Guan KL. ULK1 induces autophagy by
phosphor-ylating Beclin-1 and activating VPS34 lipid kinase. Nat Cell Biol 15:
741–750, 2013.
37. Sancak Y, Thoreen CC, Peterson TR, Lindquist RA, Kang SA, Spooner E, Carr SA, Sabatini DM. PRAS40 is an insulin-regulated
inhibitor of the mTORC1 protein kinase. Mol Cell 25: 903–915, 2007. 38. Schein RM, Sprung CL, Marcial E, Napolitano L, Chernow B. Plasma
cortisol levels in patients with septic shock. Crit Care Med 18: 259 –263, 1990.
39. Shimizu N, Yoshikawa N, Ito N, Maruyama T, Suzuki Y, Takeda S,
Nakae J, Tagata Y, Nishitani S, Takehana K, Sano M, Fukuda K, Suematsu M, Morimoto C, Tanaka H. Crosstalk between glucocorticoid
receptor and nutritional sensor mTOR in skeletal muscle. Cell Metab 13: 170 –182, 2011.
40. Shoshani T, Faerman A, Mett I, Zelin E, Tenne T, Gorodin S, Moshel
Y, Elbaz S, Budanov A, Chajut A, Kalinski H, Kamer I, Rozen A, Mor O, Keshet E, Leshkowitz D, Einat P, Skaliter R, Feinstein E.
Identifi-cation of a novel hypoxia-inducible factor 1-responsive gene, RTP801, involved in apoptosis. Mol Cell Biol 22: 2283–2293, 2002.
41. Smith KL, Tisdale MJ. Mechanism of muscle protein degradation in cancer cachexia. Br J Cancer 68: 314 –318, 1993.
42. Sofer A, Lei K, Johannessen CM, Ellisen LW. Regulation of mTOR and cell growth in response to energy stress by REDD1. Mol Cell Biol 25:
5834 –5845, 2005.
43. Tischler ME, Desautels M, Goldberg AL. Does leucine, leucyl-tRNA, or some metabolite of leucine regulate protein synthesis and degradation in skeletal and cardiac muscle? J Biol Chem 257: 1613–1621, 1982. 44. Touma C, Palme R, Sachser N. Analyzing corticosterone metabolites in
fecal samples of mice: a noninvasive technique to monitor stress hor-mones. Horm Behav 45: 10 –22, 2004.
45. Tremblay F, Marette A. Amino acid and insulin signaling via the
mTOR/p70 S6 kinase pathway. A negative feedback mechanism leading to insulin resistance in skeletal muscle cells. J Biol Chem 276: 38052– 38060, 2001.
46. Vander Haar E, Lee SI, Bandhakavi S, Griffin TJ, Kim DH. Insulin signalling to mTOR mediated by the Akt/PKB substrate PRAS40. Nat Cell
Biol 9: 316 –323, 2007.
47. Waddell DS, Baehr LM, van den Brandt J, Johnsen SA, Reichardt
HM, Furlow JD, Bodine SC. The glucocorticoid receptor and FOXO1
synergistically activate the skeletal muscle atrophy-associated MuRF1 gene. Am J Physiol Endocrinol Metab 295: E785–E797, 2008. 48. Wang H, Kubica N, Ellisen LW, Jefferson LS, Kimball SR.
Dexameth-asone represses signaling through the mammalian target of rapamycin in muscle cells by enhancing expression of REDD1. J Biol Chem 281: 39128 –39134, 2006.
49. Whitney ML, Jefferson LS, Kimball SR. ATF4 is necessary and suffi-cient for ER stress-induced upregulation of REDD1 expression. Biochem
Biophys Res Commun 379: 451–455, 2009.
50. Williamson DL, Li Z, Tuder RM, Feinstein E, Kimball SR, Dungan
CM. Altered nutrient response of mTORC1 as a result of changes in REDD1 expression: effect of obesity vs. REDD1 deficiency. J Appl
Physiol (1985) 117: 246 –256, 2014.
51. Wu Y, Zhao W, Zhao J, Zhang Y, Qin W, Pan J, Bauman WA, Blitzer
RD, Cardozo C. REDD1 is a major target of testosterone action in
preventing dexamethasone-induced muscle loss. Endocrinology 151: 1050 –1059, 2010.
52. Zhou J, Tan SH, Codogno P, Shen HM. Dual suppressive effect of MTORC1 on autophagy: tame the dragon by shackling both the head and the tail. Autophagy 9: 803–805, 2013.


![[PDF] La méthode Merise concept de base | Cours PDF](data:image/gif;base64,R0lGODlhAQABAIAAAP///wAAACH5BAEAAAAALAAAAAABAAEAAAICRAEAOw==)