HAL Id: hal-01795395
https://hal-univ-rennes1.archives-ouvertes.fr/hal-01795395
Submitted on 19 Jun 2018HAL is a multi-disciplinary open access archive for the deposit and dissemination of sci-entific research documents, whether they are pub-lished or not. The documents may come from teaching and research institutions in France or abroad, or from public or private research centers.
L’archive ouverte pluridisciplinaire HAL, est destinée au dépôt et à la diffusion de documents scientifiques de niveau recherche, publiés ou non, émanant des établissements d’enseignement et de recherche français ou étrangers, des laboratoires publics ou privés.
Copyright
that becomes disorganized by in-frame deletions
Olivier Delalande, Anne-Elisabeth Molza, Raphael dos Santos Morais,
Angélique Chéron, Emeline Pollet, Céline Raguénès-Nicol, Christophe Tascon,
Emmanuel Giudice, Marine Guilbaud, Aurélie Nicolas, et al.
To cite this version:
Olivier Delalande, Anne-Elisabeth Molza, Raphael dos Santos Morais, Angélique Chéron, Emeline Pollet, et al.. Dystrophin’s central domain forms a complex filament that becomes disorganized by in-frame deletions. Journal of Biological Chemistry, American Society for Biochemistry and Molecular Biology, 2018, 293 (18), pp.6637-6646. �10.1074/jbc.M117.809798�. �hal-01795395�
Olivier Delalande1,2*, Anne-Elisabeth Molza1,2, Raphael Dos Santos Morais1,2,3,4, Angélique Chéron1,2, Émeline Pollet1,2, Céline Raguenes-Nicol1,2, Christophe Tascon1,2, Emmanuel
Giudice1,2, Marine Guilbaud5, Aurélie Nicolas1,2, Arnaud Bondon1,6, France Leturcq5,7 Nicolas
Férey8, Marc Baaden9, Javier Perez3, Pierre Roblin3,10, France Piétri-Rouxel5, Jean-François
Hubert1,2, Mirjam Czjzek11,12 and Elisabeth Le Rumeur1,2
Running title: Structural effects of in-frame deletion of the DMD gene
From the 1Université de Rennes 1, 35043 Rennes, France; 2CNRS UMR 6290, Institut de Génétique et
Développement de Rennes, 35043 Rennes, France ; 3Synchrotron SOLEIL, 91190 Saint Aubin, France
; 4Laboratoire Léon-Brillouin, UMR 12 CEA-CNRS, Université Paris-Saclay, CEA-Saclay,
Gif-sur-Yvette CEDEX F-91191, France ; 5Sorbonne Universités UPMC - INSERM - UMRS 974 - CNRS
FRE 3617, Institut de Myologie, 75013 Paris, France ; 6CNRS 6226, Institut des Sciences Chimiques
de Rennes, PRISM, 350043 Rennes, France ; 7AP-HP, Groupe Hospitalier Cochin-Broca-Hôtel Dieu,
Laboratoire de biochimie et génétique moléculaire, 75014 Paris, France ; 8CNRS UPR3251, Université Paris XI, 91403 Orsay Cedex, France ; 9CNRS UPR9080, Université Paris Diderot, Sorbonne Paris
Cité, 75005 Paris, France ; 10INRA-Biopolymères, Interaction et Assemblages, 44000 Nantes, France ; 11Sorbonne Universités, UPMC Université Paris 06, 75006 Paris, France ; 12CNRS UMR 8227,
Integrative Biology of Marine Models, 29688 Roscoff cedex, France
* To whom correspondance should be addressed: Dr Olivier Delalande, Institut de Génétique et Développement de Rennes, Faculté de Pharmacie, 2 avenue du Pr Léon Bernard 35043 Rennes Cedex, France; [email protected]; Tel (+33)(0)2 23 23 30 07
Keywords: Dystrophin central domain; Becker muscular dystrophy; neuronal Nitric Oxide Synthase; Small angle X-ray scattering; multi resolution modeling
ABSTRACT
Dystrophin, encoded by the DMD gene, is critical for maintaining plasma membrane integrity during muscle contraction events. Mutations in the DMD gene disrupting the reading frame prevent dystrophin production and result in the high severe Duchenne muscular dystrophy (DMD); in-frame internal deletions allow production of partly functional internally deleted dystrophin and result in the less severe Becker muscular dystrophy (BMD). Many known BMD deletions occur in dystrophin’s central domain, generally considered to be a monotonous rod-shaped domain based on the knowledge of spectrin-family proteins. However, effects caused by these deletions, ranging from asymptomatic to severe BMD, argue against the central domain serving only as a featureless scaffold. We undertook structural studies combining small-angle X-ray scattering and molecular modeling in an effort to uncover the structure of the central domain as dystrophin has
been refractory to characterization. We show that this domain appears to be a tortuous and complex filament that is profoundly disorganized by the most severe BMD deletion (loss of exon 45-47). Despite the preservation of large parts of the binding site for neuronal nitric oxide synthase (nNOS) in this deletion, computational approaches failed to recreate the association of dystrophin with nNOS. This observation is in agreement with a strong decrease of nNOS immunolocalization in muscle biopsies, a parameter related to the severity of BMD phenotypes. The structural description of the whole dystrophin central domain we present here is a first necessary step to improve the design of microdystrophin constructs in the goal of a successful gene therapy for DMD.
INTRODUCTION
Mutations of the dystrophin DMD gene are the cause of two progressive muscle diseases of variable severity, Duchenne and Becker muscular dystrophies (DMD and BMD)(1). Dystrophin consists of a N-terminal actin-binding domain (ABD1), a central domain with 24 spectrin-like repeats interspaced by four hinge regions (2) and a cysteine-rich domain interacting with β-dystroglycan constituting the basis of the dystrophin-glycoprotein complex (DGC)(3, 4) and a C-terminal domain. According to the Monaco rule (5), DMD is mostly due to out-of-frame mutations in the
DMD gene that result in a complete loss of the
protein and a severe phenotype, while in-frame mutations of the DMD gene are mainly associated with BMD where modified dystrophin is produced resulting in reputed less severe phenotypes. Most BMD mutations are in-frame genomic deletions that lead to proteins lacking part of the central domain repeats (6, 7) and constitute the pattern for therapeutic strategies aiming to transform DMD patients into BMD patients (8) either by exon skipping, by injection of micro-dystrophins (9-12) or by CRSIPR/cas9 gene edition (13, 14). Indeed, the central domain has been until now considered as a monotonous rod-shaped domain which could be internally truncated without dramatic functional effects (2, 15). However, the effects of in-frame mutations involving the central domain could be more severe than expected from the Monaco rule (16, 17). Therefore, it is crucial to understand the molecular causes of the severity of certain in-frame mutations to anticipate future therapies. This could be achieved by structural and functional studies of the dystrophin central domain and of its protein products related to n-frame mutations.
X-ray crystallization of dystrophin repeats has been largely unsuccessful, likely due to the monomeric state of dystrophin. Repeats of two other family members — spectrin and α-actinin — have been crystallized in their biologically relevant dimer form and the only known crystal structure of a single R1 dystrophin repeat was obtained by chemically inducing dimerization (18), revealing a triple-helical coiled-coil structure typical of spectrin-like repeats. However, this structure does not allow for extrapolation of filament organization between successive repeats. Therefore, detailed structural
data of larger domains are needed to acquire a precise understanding of dystrophin central domain organization and the effects of in-frame mutations on it. Due to its large size, dystrophin central domain is not amenable to current solution structural methods. Therefore, we report three-dimensional structural models of eight fragments covering the native dystrophin central domain and of the in-frame deletion of exons 45 to 47, the most frequent and severe BMD deletion, obtained by an integrative approach using small-angle X-ray scattering (SAXS) and molecular modeling. The central domain of dystrophin is far from a rod-like monotonous protein but presents numerous kinks that confer to dystrophin a tortuous and complex topology. This feature may explain how dystrophin interacts specifically with numerous partners to form a large dystrophin-associated protein complex. The BMD in-frame mutation we studied profoundly modified dystrophin filamentous structure. This BMD-induced structural disorganization of the dystrophin is associated to an alteraction of nNOS binding and to a strong decrease of nNOS labeling in muscle patient biopsies. These results show that the in-frame character of the deletion does not warrant a functional protein neither a stable protein structure and that our structural characterization of the dystrophin central domain should allow a better understanding of the dystrophin-associated molecular assembly and help for the design of future DMD gene therapies.
RESULTS
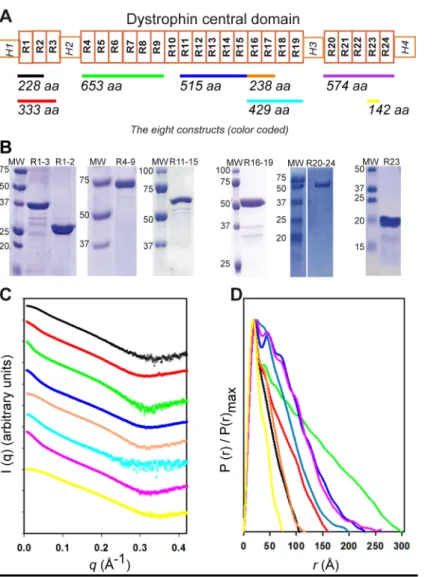
Native dystrophin fragments display SAXS profiles compatible with monomers in solution. We dissected dystrophin in eight native purified fragments of the central domain covering 23 over the 24 repeats of the whole central domain (Figure 1A, Table S1). Proteins were obtained as pure (Figure 1B) and α-helix folded molecules as previously observed (19, 20). The Guinier approximation analysis of the SAXS curves indicated that the fragments were non-aggregated (Figure S1). However, due to the rod-shaped objects, the Guinier plots were obtained for narrow ranges of q values (qRg <
0.8-1.0), especially for the longest dystrophin fragments such as R4-9, R11-15, R16-19 and R20-24 which cannot be considered globular, as previously shown (21). The radii of gyration Rg,
to 78.6 Å (Table S2). These Rg values as well as
Porod volumes, both correlate linearly with the expected molecular weights (MW) (Figure S1). Moreover, the MW obtained with the methods of Rambo and Tainer (22) and using Porod volumes are in good agreement with the MW of monomers (Table S2). These data are supported by SEC-MALS experiments performed for R1-3 and R11-15 fragments (Table S1). All these data confirm that the proteins are monomeric in solution.
The eight native fragments showed smooth SAXS scattering profiles with few structural features typical of elongated molecules (Figure 1C). The Kratky plots (Figure S2A) present a bi-modal shape with a well-defined maximum at q value of ∼0.1 Å-1 for all fragments, and a linear
increase at q > 0.3 Å-1. However, the
Porod-Debye plots show a large plateau assessing the compactness of the protein fragments, to the relative exception of the R16-19 fragment that could be slightly more dynamic given the calculated Porod-Debye exponent (Table S2 and Figure S2B). These features are consistent with dystrophin fragments being folded proteins, and in agreement with circular dichroism observations (19). At the same time these results are compatible with the putative inter-repeat regions variability as previously described (23). The maximum particle size (DMAX) values
obtained from the radial distribution function P(r) plots (Figure1D) increase with the molecular mass, confirming that the fragments are elongated in solution. All Rg values obtained
from P(r) functions are in line with first Guinier approximations (Table S2). Finally, we should notice that the P(r) functions tail off smoothly, especially for the largest constructs. All P(r) functions present a common peak at a short distance of ∼20 Å, similar to the width of 21 Å reported for the crystallized dystrophin single repeat R1 (18), likely representing the width of the fragments. This feature is in agreement with the fact that all the fragments were in a monomeric state in solution. In all cases, except for R23, the P(r) function plots presented additional peaks, notably one peak at around 40 - 50Å which represents the distance correlation between adjacent domains (i.e. repeat length). In summary the resulting data are characteristic of rather rigid but non-linear macromolecules. These features could be attributed to specific kinks located at linker regions, and delimiting the coiled-coil structured repeats, that would
disrupt a purely rod-shaped filamentous molecule.
Three-dimensional analysis evidences a tortuous and complex structure of the dystrophin central domain. We used the SASFit program (24) to obtain values for radius, contour length and Kuhn length according to three different models: long cylinder model, worm-like chain model and Kholodenko worm model (Figure S3). This analysis suggests that the Kholodenko model is the most appropriate to describe the physical characteristics of the dystrophin fragments in solution. The radius of about 10.8 Å obtained for all fragments is in accordance with the R1 monomer radius (18). Contour length higher than DMAX values
calculated for the Kholodenko models indicate that the dystrophin fragments are shorter than a theoretical linear extended rod. This implies a dystrophin filament shape distinct from the rod-like structure previously assumed for the central domain of dystrophin(2, 15).
Twenty ab initio models, i.e. low-resolution molecular shapes, were simulated by the GASBOR method (25) for each protein fragment. All the models were superimposed using DAMSUP and analyzed by DAMAVER programs (ATSAS suite, 26). The molecular shapes converged remarkably for the R1-2, R1-3, R16-17 and R23 fragments, with normalized spatial discrepancy (NSD) values of 1.0 to 1.3 Å (Figure S4). For the two fragments R11-15 and R20-24, higher NSD were obtained. However, a look at the specific bulky volumes of the ab
initio models indicates that DAMSUP placed
some models head-to-tail regarding to the rest of the collection, resulting in a less efficient superimposition. Remarkably, the longest fragment R4- 9 showed a NSD of less than 2.0 Å, evidencing a regular molecular shape. Consistent with the SASFit analysis, the GASBOR models presented sharp kinks resulting in a highly tortuous topology.
Since most of the twenty calculated ab initio shapes converged to a globally homogeneous solution (Figure S4), we considered the best χ2
ab-initio models – one for each fragment – as
relevant guidelines to model dystrophin fragments at a higher resolution. These models were preferred to those generated by DAMAVER which do not fit the scattering curves. However, the presence of kinks
precludes the simple superimposition of straight homology models obtained from spectrin templates (see Supporting Information) onto the kinked molecular shapes. Therefore, we applied the interactive flexible fitting procedure that we previously developed (27)(Supplemental Video 1) to explore the possible deformations of the spectrin-based homology models. Structure quality check (Table S3) of the final structural models indicates that the initial biological structure composed of a coiled-coil filament is properly modulated to match the SAXS-derived molecular shape (Figure 2). In the final models, kinks placed at some inter-repeat linkers disrupt the straight rod-like structure of the dystrophin fragments. Finally, despite high χ2 values, a problem already described and related to low-error detectors we used (28), experimental SAXS scattering curves and the CRYSOL theoretical curves produced from these structural models are in a range of less than 8% discrepancy for high q values that fall below 2% in low q values (Figure 2A and Figure S5). Consequently, these structural models suggest with confidence that the observed kinks are relevant features of the dystrophin central domain in solution (Figure 2B). All models have been successfully deposited in the SASBDB database, an international curated repository for small angle scattering data and models (29) (http://www.sasbdb.org/, see Supporting Information).
Similar to the crystal structures of spectrin and α-actinin, the B helices are generally bent in their middle (30, 31). However, the largest bends of α-helices are located at the inter-repeat linkers (Figure S6)(Supplemental Video 1). These kinks appear to be structured by several redundant features. Similar to successive spectrin repeats (30), the A/B loop of one repeat and the B’/C’ loop of the following repeat interact strongly with each other and/or with the inter-repeat linker (Figure S7). In addition, the diversity in helix length in dystrophin compared to spectrin repeats (32) enables the modulation of kink amplitude and/or of the relative orientation of two successive repeats, mainly through the bending or partial unfolding of the inter-repeat linker. Among remarkable exceptions, we noticed the opposite behavior in the case of two of the largest observed kinks. First, the repeats R22 and R23 have respectively two particularly long A/B and B'/C' loops, which interact closely and induce a large kink at the linker (Figure
S7B). The loops interaction results in a bulky extruded volume that can be clearly identified in the molecular shape (Figure 2D). Secondly, helix A of R14 and helix B’ of R15 are the two shortest helices found in dystrophin repeats. De
facto, in R14-R15, an A/B and B’/C’ loop
contact is not possible in a linear organization but with a large inter-repeat kink stabilized by a contact between helices B and B’ (Figure S7C). Finally, kink angle values are modulated at the R1-2 and R16-17 inter-repeat linkers compared to the kinks observed in their longer overlapping fragments R1-3 and R16-19 (Table S4). This emphasizes potential dynamic behavior of the kink angles located at the inter-repeat linkers influenced by the succession of repeats.
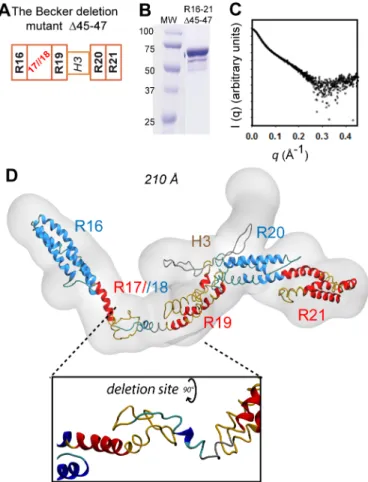
The in-frame deletion of exons 45-47 profoundly disorganizes the structure of dystrophin at the new junction site. Building on these results, we next investigated the structural impact of the in-frame deletion of exons 45-47 in a purified mutant fragment R16-21Δ45-47 (Figure 3A and B). This mutation is the most frequently found in BMD and involves the loss of a part of the nNOS binding site (16). Guinier approximation gives a Rg value of 62.4
Å (Figure S8A). The bi-modal Kratky and Porod-Debye plots (Figure S8B and S8C) are consistent with an elongated and folded protein fragment, even if the fragment seems less compact than the native dystrophin fragments (Table S2). P(r) function from SAXS scattering curve of the mutant is leading to Rg and DMAX
values of 60.1 Å and 210 Å, respectively (Figure 3C, Figure S8D). Then, as previously done for the native fragments, the experimental SAXS data were used to constrain the molecular modeling calculations. Finally, even if the R16-21Δ45-47 protein fragment corresponds – with R16-19 fragment – to the sample presenting the lowest signal to noise ratio, we yet could confirm a reasonable rigidity and compactness through advanced analysis and we could conclude that ab initio models, and the derived atomistic models, are plausible structural representations of these protein fragments in solution. The final high-resolution model fitted into the best χ2 ab-initio model showed a highly disordered topology by comparison to the filamentous structure of the corresponding native fragments (Figure 3D). A well maintained coiled-coil structure is observed for the four repeats R16, R19, R20 and R21 conserved from the native dystrophin form (Figure 3D). However, the R17//R18 non-native
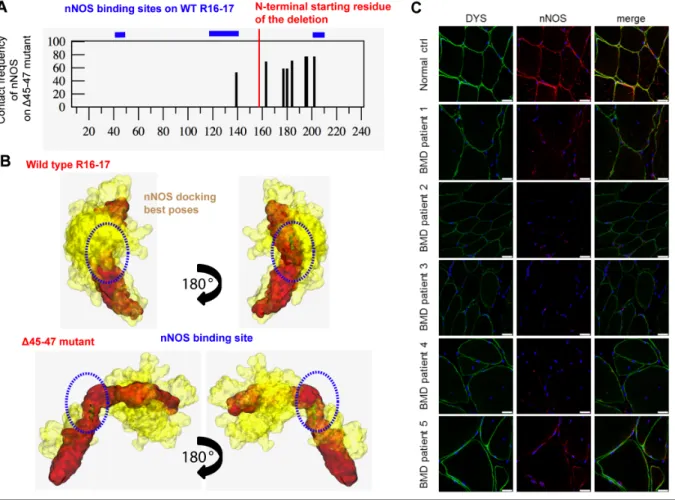
repeat shows a loss of coiled-coil organization that is replaced by loosely folded loops (Figure 3D inset). All this lead to a mutant model of less quality than those obtained for the native fragments (Table S3), probably due to the poorly structured regions, including the Hinge 3 (H3). This last H3 region is composed of 40 residues between the repeats R19 and R20 and could present a loosely tendency to fold into beta-hairpins (Figure S9). In our final mutant model, the A/B loop of R16 seems to lose its interaction with the B’/C’ loop of R17 as it does in the R16-17 native fragment. This feature induces a disorganization of both the R16-R17 and the R18-19 inter-repeat linkers on each side of the deletion, which drastically alters the filament organization. Interestingly, this disorganization is more dramatic than previously inferred from modeling not using any experimental data (16). Despite the preservation of a large part of the nNOS binding site in ∆45-47 mutant, exon deletion could impair the dystrophin – nNOS interaction. Two approaches were undertaken to investigate for the nNOS binding by the Δ45-47 dystrophin mutant. First, a docking strategy identical to the one used in our previous work (33) showed that the contact frequencies of nNOS-PDZ onto the SAXS-derived Δ45-47 model were significantly decreased by comparison to the wild type R16-17 fragment (Figure 4A). In particular, the two binding sites situated in the A/B helix of R16 and the linker R16-17 conserved in the Δ45-47 mutant did not show any contacts with nNOS-PDZ. Low frequency contacts on the deleted dystrophin C-terminal domain could be insufficient for its interaction with nNOS-PDZ (Figure 4B). Secondly, immunostaining experiments of dystrophin and nNOS localization were carried out on muscle sections of five Δ45-47 BMD patients and compared to normal muscle (Figure 4C). Dystrophin from normal muscle appears as an intense labeling surrounding the fibers. The nNOSµ positioning was validated by its sarcolemmal co-localization with dystrophin in normal muscle. In the muscles of the BMD patients, dystrophin was detected at a level comparable to that of muscle control and was properly localized at the inner face of the membrane fibers. Despite the presence of dystrophin, in none of the patients labeling of nNOS could be detected at a sufficient level (Figure S10). These results suggest that the nNOS binding would be altered in the in-frame
deletion mutant despite the preservation of two sequences of the wild type protein involved in the binding (33, 34). This observation could be mainly related to the disordered structure induced by the ∆45-47 deletion as shown from SAXS results.
DISCUSSION
The results presented here indicate that the classical concept of the central domain of dystrophin as a rod-shaped succession of 24 monotonous repeats (2, 15) should be revisited. Evidence that the structure of this domain is complex and tortuous was obtained using experimental SAXS methodology associated with molecular modeling. We suggest that the linker regions connecting rigid repeats confer kinked and non rod-shaped features to the central domain. Such large deviations from filament linearity have not yet been observed in crystal structures of the three-repeat spectrin fragments nor of the four-repeat α-actinin, but angle values in the range of 10 - 15° were reported for inter-repeat linkers in spectrin dimers by molecular simulation (35). The large kink angles observed here in dystrophin might be due to its monomeric nature, whereas spectrin and α-actinin filaments are tetramers or dimers. Notably, they could also be ‘coded’ by specific inter-region linker sequences. Indeed, the dimeric - tetrameric filaments of α-actinin and spectrin are structurally maintained by inter-repeat interactions enabled by similar lengths of all repeats, whereas, in the monomeric dystrophin filament, the repeats display highly heterogeneous lengths, thereby precluding dimerization (32). The presence of specific kinks within the dystrophin filament raises the question of their biological relevance and whether they represent hinge regions with adaptable angles. Indeed, the final structural models were obtained by interactively exploring the possible angles between successive repeats without unfolding of the repeats themselves, indicating that modifications of these kink angles could occur at low energy cost. It is interesting to note that the kink angle values between successive repeats are slightly modified when appearing in two different fragments such as the R1-2 kink angle in R1-2 and R1-3 and the R16-17 kink angle in R16-17 and R16-19. However, these modifications are restricted to specific spatial directions as imposed by the structural biology
restraints established for coiled-coils. Incidentally, the looseness of the linkers could preclude the crystallization of the central domain of dystrophin.
The tortuous filamentous organization of the central dystrophin domain raises important questions about the biological construction of the entire dystrophin scaffold. Large inter-repeat kink angles break the spatial alignment of the central domain by changing the direction of neighboring repeats. This feature suggests that dystrophin should no longer be considered as a succession of independent building blocks (repeats) but rather as a succession of highly interdependent multi-repeat blocks constituting structural and/or interaction modules. This view is in line with the cooperative behavior of dystrophin repeats observed under unfolding conditions when stretched by optical tweezers (36). This compartmentalization may allow dystrophin to recruit protein partners simultaneously while bound to the plasma membrane (37). In particular, the bulkiest molecules, intermediate filaments and F-actin, are recruited by the large R11-17 domain while microtubules are recruited by R20-23 (38) and due to steric hindrance, these interactions could not occur simultaneously with a straight central domain. Remarkably, these regions overlap with
DMD gene mutational hotspots (exons 44 to 55)
(6, 7). Other modules for binding smaller protein partners emerge from the kinked filament topology of dystrophin, including the PAR-1b by repeats 8 and 9 (39, 40) and nNOS by repeats 16 and 17 (33, 34).
The emergence of multi-repeat blocks as functional interaction modules is particularly evidenced here by the consequences of the BMD in-frame 45-47 deletion. Even though quite a large part of the nNOS-binding sequence of dystrophin is conserved at the N-terminal side of the non-native junction in the ∆45-47 mutant, docking simulations suggest the difficulty for nNOS to associate with the deleted dystrophin. Our main hypothesis is that the structural disorganization of the nNOS binding module on WT R16-17 induced by the ∆45-47 deletion could explain why we observed a strong decrease of nNOS protein expression in skeletal muscle and a loss of its localization to the sarcolemma in BMD patients. Nevertheless, it is still unclear if nNOS mislocalization to the sarcolemma is the source or the consequence of
low protein levels we observed. Absence of nNOS binding to the deleted dystrophin could be related to the severity of this ∆45-47 in-frame deletion (16) and could account at least partly for the heterogeneity of BMD phenotypes encountered with different deletions starting from exon 45 and which may impair the nNOS binding to various degrees (41). Among these deletions, we are currently studying the deletion of exons 45 to 55 which could rescue 65% of DMD patients (13, 42).
Therefore, the maintenance of the best native-like dystrophin functional modules appears to be crucial in the design of therapeutic
micro-dystrophins or exon-skipping/gene-editing products. Shortened micro-dystrophins have been designed based on BMD phenotypes by deleting some repeats that were assumed to be more dispensable than others (10, 12). Most of them were designed according to the less severe BMD deletion of exon 17 to 48 (8) and to the repeat phasing proposed by Harper (43). However, these micro-dystrophins were designed by considering repeats as elemental building blocks, without a true knowledge about the structural impact of disruption of the interdependent multi-repeat blocks and this remains to be investigated. Exon-skipping is a transcriptional therapeutic strategy expected to change DMD patients into BMD patients by subtracting additional exon(s) to restore the reading frame (9, 11). BMD deletions thus serve as patterns for DMD cure and until now they were all considered as equivalent based on the hypothesis that parts of the central domain could be subtracted without severely affecting dystrophin structure and function. Our results indicate clearly that this is not the case and that the longest in-frame transcript produced by exon-skipping is not necessarily optimal. Therefore, BMD deletions should be studied more in detail from a protein structure to function point of view, in order to anticipate the results of therapy of DMD patients before inducing their therapeutic production.
EXPERIMENTAL PROCEDURES
Cloning, protein expression and purification and biochemical characterization. The cloning, expression and purification procedures for five of the eight fragments (R1-2, R1-3, R11-15, R23 and R20-24) have been described extensively in
our previous papers (19) (details about sequences of fragments are shown in Table S1). R16-17 was obtained from Nick Menhart's team (20). The fragments R4-9 and R16-19 were newly overexpressed in E. coli and purified by similar procedures. The deletion mutant R16-21Δ45-47 was cloned, expressed and purified as previously described in detail (16). Proteins were characterized by circular dichroism (for details, see Supporting Information). The Hinge 3 region of human dystrophin was produced by Proteogenix (http://www.proteogenix.fr/) as a peptide of 47 residues with a molecular weight of 4.9 kDa and a purity of > 95%, analyzed by circular dichroism and nuclear magnetic resonance.
Small-Angle X-ray Scattering (SAXS) experiments. SAXS measurements were conducted either at the European Synchrotron Radiation Facility (ESRF, Grenoble, France) on the ID14-eh3 beamline (sample R11-15) or at the French synchrotron SOLEIL (St. Aubin, France) on the SWING beamline (all other samples). All experiments were performed at 15°C. For both set-ups, the scattering vector is defined as q = 4
π/λ sinθ, where 2θ is the scattering angle. Data
were collected in a q-range of 0.005–0.5 Å−1.
ID14-eh3 set-up. The data were collected on a
2D Pilatus 1M detector at a distance of 2.43 m (λ= 0.933 Å). For R11-15 a series of 5 concentrations (1.1, 2.1, 4.6, 6.4 and 10.8 mg/ml) was prepared prior to injection into the SAXS capillary. Ten frames of 1.5 seconds each were collected with alternating TNE buffer (Tris 20 mM at pH 7.5, NaCl 150 mM and EDTA 0.1 mM) and R11-15 protein samples at increasing concentrations. All frames were then averaged for each data-set after visual inspection. SAXS data were directly evaluated using the Primus software, as implemented in the ATSAS 2.3 suite (26). The experimental SAXS data for all samples were linear in a Guinier plot of the low q region. These observations indicated that the sample did not aggregate. The radius of gyration Rg for R11-15 was derived from the Guinier
approximation I(q) = I(0) exp (-q2R
g2 /3) for
qRg< 0.8. Data collected at high q using high
protein concentrations and at low q using low protein concentrations were then merged, with the aim to minimize the particle interference occurring at low q and to maximize the signal/noise ratio at high q.
SWING set-up. All other samples data were
recorded using an AVIEX170170 CCD detector at the distance of 1.807 to 1.845 m (λ= 1.033 Å). For the constructs R1-2, R1-3, R4-9, R16-17, R16-19, R16-21Δ45-47, R23 and R20-24 a stock solution of each fragment was prepared at a final concentration between 8 and 15 mg/ml. A volume between 60 to 120 µl of protein samples was injected into a size exclusion column (Bio SEC-3 300 Ǻ, Agilent) and eluted directly into the SAXS flow-through capillary cell at a flow rate of 0.2 ml/min. The overall SEC-SAXS setup has already been described in previous work (44). The elution buffer consisted of TNE supplemented with 2% glycerol and 10 % acetonitrile for R16-19 and the BMD mutant. Two hundred fifty SAXS frames were collected continuously during the elution at a frame duration of 1.5 s and a dead time between frames of 0.5 s. One hundred frames accounting for buffer scattering were collected before the void volume. The averaged buffer scattering was then subtracted from the protein signal. SAXS curves displaying a constant Rg in a Rg versus frame
number plot were averaged (Figure S1A) and were used for further characterization. Data reduction to absolute units and frame averaging and subtraction were performed in FOXTROT (7).
SAXS data analysis. All subsequent data processing and analysis were conducted with the Scatter (http://www.bioisis.net/), SASFit (45) or PRIMUS software and other programs of the ATSAS suite. The SAXS data have been successfully deposited in the SASBDB database (29) and were validated following a expert
quality control procedure
(http://www.sasbdb.org/, see Supporting Information).
Guinier plots assess that all samples were not aggregated (Figure S1B and S7A). The distance-distribution function P(r) and the maximum particle diameter (DMAX) were calculated using
the GNOM program (46). This approach offers an alternative calculation of Rg, which is based
on the entire scattering spectrum (Table S2). Within a margin of error, these Rg values match
those deduced from the first Guinier approximation. Scattering patterns I(q) are also shown as Kratky plots (q2I(q) vs q, Figure S2A)
indicating that all proteins are properly folded in solution. Typically, a globular, structured protein exhibits a pronounced maximum (bell-shaped
curve), whereas a random chain (for example, an unfolded protein) will plateau (47, 48). Then, Porod-Debye plots (q4I(q) vs. q4) were generated
and confirmed the compactness of all proteins (Figure S2B and Table S2).
Molecular weights (MW) are generally derived from the SAXS data using the I0 or using a
standard protein, generally BSA. Both methods need an accurate determination of the protein concentration. In the SEC-SAXS experiments, the UV detector saturated and the protein concentration cannot be accurately determined. Therefore, we relied on alternative methods to control the MWs of dystrophin fragments in solution: i.e size-exclusion chromatography multi-angle light scattering (SEC-MALS) for two of our constructs (R1-3 and R11-15), the Porod volume-based method and that proposed by Rambo and Tainer (21). SEC-MALS experiments were performed with an HPLC system (Agilent) equipped with an UV detector coupled with light scattering (miniDAWN Treos, Wyatt) and refractive index (Viscotek, Malvern) detectors. The refractive index increment value (dn/dc) of the proteins used to determine their molecular weight was 0.185 mL/g. Data were collected using a customized Bio SEC3 column (Agilent) equilibrated with TN buffer (Tris 20 mM pH 7.4, NaCl 150 mM) with a flow rate of 0.3 mL.min-1. Data were processed with the ASTRA software v6.1. For the Porod volume-based method, we assume that the Porod volume in nm3 is about 1.6 times the MW in kDa (46). The method developed by Rambo and Tainer (21) was used to assess the monomeric state of all protein fragments employing the volume of correlation (Vc).
Structural models derived from the SAXS data. The overall ab initio models of the protein fragments were obtained from the SAXS experimental data using the GASBOR program (26). Following the standard procedure and using 50 harmonics, the scattering profiles were fitted to a qmax = 0.45 Å-1 for all samples – except for R16-19 and R16-21Δ45-47, qmax = 0.3 Å-1 (Figure S4A). Twenty independent GASBOR computations were performed for each scattering profile (each protein sample) and were superimposed using the SUPCOMB and DAMAVER programs (Figure S4B and S4C). This allowed to identify general structural features over the models of a given fragment, and thus, the result of the GASBOR computation
with the smallest χ2 was finally conserved as the unique ab initio model of each dystrophin fragment. This unique ab initio model was converted to a volume grid constraints (molecular shape) to guide the interactive flexible fitting simulations, as described in previous work (27). Dystrophin fragments homology models (with spectrin as structural pattern) were adjusted to the molecular shape by multiple interactive simulations exploring head-to-tail initial positions of the protein fragment (see Supplemental Movie and Supporting Information for details). All the final models were refined by a standard energy-minimization (27). Evaluation of the final structural models was performed using standard quality controls (Table S3, data provided by http://services.mbi.ucla.edu/SAVES). Alpha helices curvature in the structural models (Figure S5) was measured using the measure of kink amplitude between two consecutive dystrophin repeats by defining a main axis for each coiled-coil (Table S4). Validation of these models was done by calculating their theoretical SAXS curves with the CRYSOL program (26).
Analysis of dystrophin and nNOS interaction. First, a docking strategy already described (33) was used to search for contact frequencies between the SAXS-derived structural model of Δ45-47 dystrophin mutant and the nNOS PDZ subdomain. Secondly, the nNOS immunolocalization was performed on muscle biopsies obtained from five BMD patients presenting the deletion of exons 45-47 from the French population (7). All details are described in the Supplementary experimental procedures.
ACKNOWLEDGEMENTS
This research was supported by research grants from the Association Française Contre les Myopathies, AFM–Téléthon, the Conseil Régional de Bretagne, RTR Biologie-Santé of the Université Européenne de Bretagne and the Grand Equipement National de Calcul Intensif - GENCI program (DYSIM project). AEM was recipient of a fellowship from AFM-Téléthon. AN was recipient from a Centre National de la Recherche Scientifique (CNRS) fellowship. We thank Dr Nick Menhart for providing purified R16-17 protein. We also thank the synchrotron facilities SOLEIL (St. Aubin) and ESRF (Grenoble) for allocating regular beam time and their dedicated staffs for technical help with the
beamlines SWING and ID14-EH3, respectively. We thank UMS BioSit for access to the spectroscopy facility. We warmly thank Jean-Claude Kaplan for skillful discussions and critical review of the manuscript. We gratefully thank Gabriel David and Blandine Pineau from synchrotron SOLEIL (St Aubin) for support in MALS experiments.
CONFLICT OF INTEREST
The authors declare that they have no conflicts of interest with the contents of this article.
AUTHOR CONTRIBUTIONS
OD, JFH, MC and ELR conceived and coordinated the study and wrote the paper. OD, AEM, EP, EG and AN designed, performed and analyzed the molecular simulations. OD, NF and MB designed the interactive simulation tools. AC, CRN, CT, JFH and ELR designed, performed and analyzed the protein fragment samples for SAXS experiments. OD, RDSM, JP, PR, JFH, MC and ELR designed, performed and analyzed the SAXS experiments. AB designed, performed and analyzed the NMR experiments. MG, FL and FPR designed, performed and analyzed the BMD patients cell experiments. All authors reviewed the results and approved the final version of the manuscript.
REFERENCES
1. Hoffman, E. P., Brown, R. H., and Kunkel, L. M. (1987) Dystrophin: the protein product of the Duchenne muscular dystrophy locus. Cell 51, 919-928.
2. Koenig, M., Monaco, A. P., and Kunkel, L. M. (1988) The complete sequence of dystrophin predicts a rod-shaped cytoskeletal protein. Cell 53, 219-226. 3. Campbell, K. and Kahl, S. (1989)
Association of dystrophin and an integral membrane glycoprotein. Nature 338, 259-262.
4. Ervasti, J. and Campbell, K. (1991) Membrane organization of the dystrophin-glycoprotein complex. Cell 66, 1121-1131.
5. Monaco, A., et al. (1988) An explanation for the phenotypic
differences between patients bearing partial deletions of the DMD locus.
Genomics 2, 90-95.
6. Flanigan, K. M., et al. (2009) Mutational spectrum of DMD mutations in dystrophinopathy patients: application of modern diagnostic techniques to a large cohort. Hum Mutat 30, 1657-1666. 7. Tuffery-Giraud, S., et al. (2009)
Genotype-phenotype analysis in 2,405 patients with a dystrophinopathy using the UMD-DMD database: a model of nationwide knowledgebase. Hum Mutat 30, 934-945.
8. England, S., et al. (1990) Very mild muscular dystrophy associated with the deletion of 46% of the dystrophin.
Nature 343, 180-182.
9. Aartsma-Rus, A., et al. (2009) Theoretic applicability of antisense-mediated exon skipping for Duchenne muscular dystrophy mutations. Hum Mutat 30, 293-299.
10. Seto, J. T., Bengtsson, N. E., and Chamberlain, J. S. (2014) Therapy of Genetic Disorders-Novel Therapies for Duchenne Muscular Dystrophy. Curr
Pediatr Rep 2, 102-112.
11. Ricotti, V., Muntoni, F., and Voit, T. (2015) Challenges of clinical trial design for DMD. Neuromuscul Disord 25, 932-935.
12. Wilton, S. D., Veedu, R. N., and Fletcher, S. (2015) The emperor's new dystrophin: finding sense in the noise.
Trends Mol Med.
13. Young, C. S., et al. (2016) A Single CRISPR-Cas9 Deletion Strategy that Targets the Majority of DMD Patients Restores Dystrophin Function in hiPSC-Derived Muscle cells. Cell Stem Cell 18, 1-8.
14. Wojtal, D., et al. (2016) Spell Checking Nature: Versatility of CRISPR/Cas9 for Developing Treatments for Inherited Disorders. Am J Hum Genet 98, 90-101. 15. Rahimov, F. and Kunkel, L. M. (2013)
The cell biology of disease: cellular and molecular mechanisms underlying muscular dystrophy. J Cell Biol 201, 499-510.
16. Nicolas, A., et al. (2015) Becker muscular dystrophy severity is linked to the structure of dystrophin. Hum Mol
17. Findlay, A. R., et al. (2015) Clinical phenotypes as predictors of the outcome of skipping around DMD exon 45. Ann
Neurol 77, 668-674.
18. Muthu, M., Richardson, K. A., and Sutherland-Smith, A. J. (2012) The crystal structures of dystrophin and utrophin spectrin repeats: implications for domain boundaries. PLoS One 7, e40066.
19. Legardinier, S., et al. (2009) Mapping of the lipid-binding and stability properties of the central rod domain of human dystrophin. J Mol Biol 389, 546-558. 20. Mirza, A., Sagathevan, M., Sahni, N.,
Choi, L. and Menhart, N. (2010) A biophysical map of the dystrophin rod.
Biochim Biophys Acta 1804, 1796-1809.
21. Putnam, C. D., Hammel, M., Hura, G. L., and Tainer, J. A. (2007) X-ray solution scattering (SAXS) combined with crystallography and computation: defining accurate macromolecular structures, conformations and assemblies in solution. Q Rev Biophys 40, 191-285. 22. Rambo, R.P. and Tainer, J.A.(2013)
Accurate assessment of mass, models and resolution by small-angle scattering.
Nature 496 (7446), 477-481.
23. Bernado, P. (2010) Effect of interdomain dynamics on the structure determination of modular proteins by small-angle scattering. Eur Biophys J 39, 769-780. 24. Kohlbrecher, J. (2010), ed. Villigen, P.
S. I.
25. Koch, M. H. J. and Svergun, D. I. (2003) Small-angle scattering studies of biological macromolecules in solution.
Reports on Progress in Physics 66,
1735-1782.
26. Petoukhov, M. V., et al. (2012) New developments in the ATSAS program package for small-angle scattering data analysis. J Appl Cryst 45, 342-350. 27. Molza, A.-E., et al. (2014) Innovative
interactive flexible docking method for multi-scale reconstruction elucidates dystrophin molecular assembly. Faraday
Discussions 169, 45-62.
28. Dorival, J., et al. (2016) Characterization of intersubunit communication in the virginiamycin trans-acyl transferase polyketide synthase. J Am Chem Soc 138, 4155-4167.
29. Valentini, E., et al. (2015) SASBDB, a repository for biological small-angle scattering data. Nucleic Acids Res 43, D357-363.
30. Grum, V. L., Li, D., MacDonald, R. I., and Mondragon, A. (1999) Structures of two repeats of spectrin suggest models of flexibility. Cell 98, 523-535.
31. Ribeiro Ede, A., Jr., et al. (2014) The structure and regulation of human muscle alpha-actinin. Cell 159, 1447-1460.
32. Winder, S. J., Gibson, T. J., and Kendrick-Jones, J. (1995) Dystrophin and utrophin: the missing links! FEBS
Letters 369, 27-33.
33. Molza, A. E., et al. (2015) Structural Basis of Neuronal Nitric-Oxide Synthase Interaction with Dystrophin Repeats 16 and 17. J Biol Chem 290, 29531-29541. 34. Lai, Y., Zhao, J., Yue, Y., and Duan, D.
(2013) alpha2 and alpha3 helices of dystrophin R16 and R17 frame a microdomain in the alpha1 helix of dystrophin R17 for neuronal NOS binding. Proc Natl Acad Sci U S A 110, 525-530.
35. Mirijanian, D. T., Chu, J. W., Ayton, G. S., and Voth, G. A. (2007) Atomistic and coarse-grained analysis of double spectrin repeat units: the molecular origins of flexibility. J Mol Biol 365, 523-534.
36. Bhasin, N., et al. (2005) Molecular extensibility of mini-dystrophins and a dystrophin rod construct. J Mol Biol 352, 795-806.
37. Bajanca, F., et al. (2015) In vivo dynamics of skeletal muscle Dystrophin in zebrafish embryos revealed by improved FRAP analysis. Elife 4, 06541. 38. Belanto, J. J., et al. (2014) Microtubule binding distinguishes dystrophin from utrophin. Proc Natl Acad Sci U S A 111, 5723-5728.
39. Yamashita, K., et al. (2010) The 8th and 9th tandem spectrin-like repeats of utrophin cooperatively form a functional unit to interact with polarity-regulating kinase PAR-1b. Biochem Biophys Res
Commun 391, 812–817.
40. Dumont, N. A., et al. (2015) Dystrophin expression in muscle stem cells regulates their polarity and asymmetric division.
41. Gentil, C., et al. (2012) Variable phenotype of del45-55 Becker patients correlated with nNOSmu mislocalization and RYR1 hypernitrosylation. Hum Mol
Genet 21, 3449-3460.
42. Beroud, C., et al. (2007) Multiexon skipping leading to an artificial DMD protein lacking amino acids from exons 45 through 55 could rescue up to 63% of patients with Duchenne muscular dystrophy. Hum Mutat 28, 196-202. 43. Harper, S. Q., et al.(2002) Modular
flexibility of dystrophin: implications for gene therapy of Duchenne muscular dystrophy. Nature Med 8, 253-261. 44. Perez, J. and Nishino, Y. (2012)
Advances in X-ray scattering: from solution SAXS to achievements with coherent beams. Curr Opin Struct Biol 22, 670-678.
45. Bressier, I. Kohlbrecher, J. and Thünemann, A.F. (2015) J Appl
Crystallogr 20,1587-1598.
46. Svergun, D. I., Petoukhov, M. V., and Koch, M. H. (2001) Determination of domain structure of proteins from X-ray solution scattering. Biophys J 80, 2946-2953.
47. Koch, M. H. J., Vachette, P., andSvergun, D. I. (2003) Small angle scattering: a view on the properties, structures and structural changes of biological macromolecules in solution.
Q. Rev. Biophys 36, 147–227.
48. Skou, S., Gillilan, R. E., and Ando, N. (2014) Synchrotron-based small-angle X-ray scattering of proteins in solution.
FIGURE LEGENDS
Figure 1. Experimental SAXS data obtained for the eight distinct native dystrophin fragments (A) Schematic representation of the dystrophin central rod domain. It is comprised of 24 repeats (white boxes numbered R1 to R24) and four hinges (H1 to H4). The fragments studied here are highlighted by color-coded horizontal bars with indication of their length (number of amino acids). (B) SDS-PAGE of the fragments (R16-17 is not shown) indicates that they are reasonable pure and that they migrate at the expected molecular weight. (C) Experimental SAXS scattering profiles. The intensity values of each curve are shifted by applying a simple scale factor along the logarithmic axis to achieve clearer visualization. From top to bottom: curves R1-2, R1-3, R4-9, R11-15, 17, R16-19, R20-24 and R23 are displayed in the colors used in A. (D) The P(r) distribution functions obtained by GNOM analysis are shown for the eight fragments (color-coded as in A); the maximum r value (DMAX) of each fragment corresponds to its maximum dimension in abscissa.
Figure 2. SAXS-derived three-dimensional structural models for the eight native dystrophin fragments
(A) Theoretical scattering curves obtained from the final structural models by a CRYSOL program calculation performed for each fragment. All theoretical curves are shown for q < 0.25 Å in a plain line superimposed onto its corresponding experimental grey-dotted line (color code as in Figure 1). Note that χ2 values are quantitatively non-relevant due to the detectors providing low-error data. (B to I) The molecular shape obtained from GASBOR with the best χ2 is shown for each fragment as a grey volume. The SAXS-derived structural models of each dystrophin fragment are overlaid onto its corresponding molecular shape in a cartoon representation. The α-helices of a coiled-coil repeat are
colored in red or blue for successive repeats. From the longest to the shortest fragment are shown (B) R4-9, (C) R11-15, (D) R20-24, (E) R16-19, (F) R1-3, (G) R1-2, (H) R16-17 and (I) R23. The DMAX in
Å is indicated for each fragment. Arrows indicate the two more pronounced kinks observed at the linker regions on the R11-15 and R20-24 fragments. The inset shows the structural organization of a two-repeat coiled coil with the three helices A, B and C of the first repeat and the helices A’, B’ and C’ of the second repeat. The helices are connected by the A/B or A’/B’ and B/C or B’/C’ loops. The linker connecting the two repeats corresponds to a eight amino acids common helix bridging C and A’.
Figure 3. SAXS-based model of the R16-21Δ45-47 deletion mutant
(A) Schematic drawing of the Becker Δ45-47deletion in the R16-21 fragment of dystrophin. This mutation results in the deletion of the C-terminal part of R17 and the N-terminal part of R18, creating a non-native repeat termed R17//18. (B) SDS-PAGE of the fragment indicates that it is reasonable pure and migrates at the expected molecular weight. (C) The experimental SAXS scattering curve shows a lower signal-to-noise ratio for large q (>0.2 Å-1) than in native fragments due to a lower
sample concentration. (D) The structural model of the Becker Δ45-47 deletion mutant is shown overlaid on the SAXS-derived molecular shape in grey volume. The inset highlights filament disorganization at the newly created junction site caused by the deletion as obtained through flexible fitting simulation.
Figure 4: nNOS and dystrophin R16-17 binding in the BMD Δ45-47 deletion mutant.
(A) Contact frequency of nNOS on the deletion mutant Δ45-4 compared to the three binding sites of the wild type dystrophin repeats R16-17 (in blue lines above the graph). Abscissa represents the primary sequence of dystrophin fragment where the amino acids 1 to 158 are similar for the two proteins and the amino acids from 159 to 240 are specific for each of the proteins (the deletion starts at the residue 159). (B) Interaction sites with a high contact frequency (>60%) projected onto dystrophin wild type R16-17 (top) and Δ45-47 mutant (bottom). The dystrophin proteins are shown in red and the ensemble of best nNOS poses are shown in yellow. (C) nNOS localization in Becker Δ45-47 muscles. Fixed frozen muscle sections (8 µm) from normal control (Normal) and 5 Becker patients (BMD patient 1 to 5) were immune labelled with anti-C-terminal dystrophin (green) and anti-nNOSµ (red) antibodies, nuclei with DAPI (blue) and imaged by confocal microscopy. Scale bars are 25 µm.