Accepted Manuscript
Age-related decrease in cortical excitability circadian variations during sleep loss and its links with cognition
Giulia Gaggioni, Julien Q.M. Ly, Vincenzo Muto, Sarah L. Chellappa, Mathieu Jaspar, Christelle Meyer, Tillo Delfosse, Amaury Vanvinckenroye, Romain Dumont, Dorothée Coppieters ‘t Wallant, Christian Berthomier, Justinas Narbutas, Maxime Van Egroo, Andé Luxen, Eric Salmon, Fabienne Collette, Christophe Phillips, Christina Schmidt, Gilles Vandewalle
PII: S0197-4580(19)30044-2
DOI: https://doi.org/10.1016/j.neurobiolaging.2019.02.004 Reference: NBA 10502
To appear in: Neurobiology of Aging Received Date: 5 October 2018 Revised Date: 24 January 2019 Accepted Date: 2 February 2019
Please cite this article as: Gaggioni, G., Ly, J.Q.M., Muto, V., Chellappa, S.L., Jaspar, M., Meyer, C., Delfosse, T., Vanvinckenroye, A., Dumont, R., Coppieters ‘t Wallant, D., Berthomier, C., Narbutas, J., Van Egroo, M., Luxen, A., Salmon, E., Collette, F., Phillips, C., Schmidt, C., Vandewalle, G., Age-related decrease in cortical excitability circadian variations during sleep loss and its links with cognition,
Neurobiology of Aging (2019), doi: https://doi.org/10.1016/j.neurobiolaging.2019.02.004.
This is a PDF file of an unedited manuscript that has been accepted for publication. As a service to our customers we are providing this early version of the manuscript. The manuscript will undergo copyediting, typesetting, and review of the resulting proof before it is published in its final form. Please note that during the production process errors may be discovered which could affect the content, and all legal disclaimers that apply to the journal pertain.
M
AN
US
CR
IP
T
AC
CE
PT
ED
1/33
Age-related decrease in cortical excitability circadian variations during sleep loss and its links
1
with cognition
2
Giulia Gaggionia,b, Julien Q.M. Lya,b,c, Vincenzo Mutoa,b, Sarah L. Chellappaa,b,#, Mathieu Jaspara,b,d,
3
Christelle Meyera,b, Tillo Delfossea, Amaury Vanvinckenroyea, Romain Dumonta, Dorothée Coppieters
4
‘t Wallanta, Christian Berthomiere, Justinas Narbutasa, Maxime Van Egrooa, Andé Luxena, Eric
5
Salmona,c,d, Fabienne Collettea,d, Christophe Phillipsa,f, Christina Schmidta,d, Gilles Vandewallea,b,*
6
7
a
GIGA-Institute, Cyclotron Research Center/In Vivo Imaging, University of Liège, 4000 Liège, Belgium
8
bWalloon Excellence in Life sciences and Biotechnology (WELBIO), Belgium
9
cDepartment of Neurology, CHU Liège, 4000 Liège, Belgium
10
dPsychology and Neuroscience of Cognition Research Unit, Faculty of Psychology and Educational
11
Sciences, University of Liège, 4000 Liège, Belgium
12
ePhysip, 75011 Paris, France
13
fGIGA- Institute, In silico Medicine, University of Liège, 4000 Liège, Belgium
14
#Current address: Medical Chronobiology Program, Division of Sleep and Circadian Disorders,
15
Departments of Medicine and Neurology, Brigham and Women's Hospital, Boston, MA 02115, USA
16
*Correspondence to:Gilles Vandewalle, GIGA-Institute, Cyclotron Research Center/In Vivo Imaging,
17
Bâtiment B30, Allée du VI Août, 8, 4000 Liege, Belgium, +3243662316, [email protected]
18
19
20
M
AN
US
CR
IP
T
AC
CE
PT
ED
2/33
ABSTRACT21
Cortical excitability depends on sleep-wake regulation, is central to cognition and has been
22
implicated in age-related cognitive decline. The dynamics of cortical excitability during
23
prolonged wakefulness in aging are unknown, however. Here, we repeatedly probed cortical
24
excitability of the frontal cortex using transcranial magnetic stimulation and
25
electroencephalography in thirteen young and twelve older healthy participants during sleep
26
deprivation. While overall cortical excitability did not differ between age groups, the magnitude
27
of cortical excitability variations during prolonged wakefulness was dampened in older
28
individuals. This age-related dampening was associated with mitigated neurobehavioural
29
consequences of sleep loss on executive functions. Furthermore, higher cortical excitability
30
was potentially associated with better and lower executive performance, respectively in older
31
and younger adults. The dampening of cortical excitability dynamics found in older
32
participants likely arises from a reduced impact of sleep homeostasis and circadian processes.
33
It may reflect reduced brain adaptability underlying reduced cognitive flexibility in aging.
34
Future research should confirm preliminary associations between cortical excitability and
35
behaviour, and address whether maintaining cortical excitability dynamics can counteract
age-36
related cognitive decline.
37
38
Keywords: ageing, circadian, cognition, cortical excitability, sleep
39
40
41
42
M
AN
US
CR
IP
T
AC
CE
PT
ED
3/33
1. Introduction43
The intrinsic excitability, or reactivity, of cortical neuronal cells is a basic, yet essential, feature of brain
44
function (Rizzo et al., 2015). Cortical excitability reflects inherent cellular properties of neurons that
45
arise from the combined impacts of multiple parameters [e.g. ion concentration in the intra- and
46
extracellular milieus, neuromodulator actions, membrane potential, action potential threshold] (Bushey
47
et al., 2015; Frank and Cantera, 2014; Meisel et al., 2015; Rizzo et al., 2015; Tononi and Cirelli, 2014).
48
Cortical excitability is grounded in the responsiveness and response selectivity of cortical neurons
49
which determines, at least in part, how an input is processed by the brain and is therefore central to
50
cognition. In fact, a decrease in neuron excitability has been implicated in the cognitive decline found
51
in normal and pathological aging (Chang et al., 2005; Rizzo et al., 2015). Critically, cortical excitability
52
was recently demonstrated to vary substantially during wakefulness and following sleep (Huber et al.,
53
2013; Ly et al., 2016). Yet, the regulation of sleep and wakefulness profoundly change in aging
54
(Schmidt et al., 2012). Whether these age-related changes affect cortical excitability is unknown.
55
Two fundamental mechanisms regulate sleep and wakefulness and their associated cognitive
56
functions: sleep homeostasis and the circadian system (Dijk and Czeisler, 1995; Schmidt et al., 2012).
57
During the day, the circadian signal opposes the homeostatic build-up of sleep need to maintain
58
wakefulness and cognition, up to the evening, shortly before habitual sleep onset (Dijk and Czeisler,
59
1995). At night, the circadian system promotes sleep to favor sleep continuity, up to the end of the
60
biological night, shortly before habitual wake up time (Dijk and Czeisler, 1995). Any disturbance in this
61
fine-tuned interplay is detrimental for cognition (Lo et al., 2012; Schmidt et al., 2012). An extreme
62
disruption consists in prolonging wakefulness overnight: cognition is greatly compromised because the
63
circadian system promotes sleep at a time of high sleep need (Lo et al., 2012; Schmidt et al., 2012). If
64
wakefulness is further prolonged the next day, the wake-promoting signal of the circadian system
65
rescues in part cognition (Lo et al., 2012). Thus, because of the interplay between the homeostatic
66
and circadian processes, all periods of prolonged wakefulness are not equivalent or linearly related to
67
one another. Likewise all aspects of cognition are also not equally affected by sleep loss: the
68
magnitude of the detrimental impact of insufficient sleep and prolonged wakefulness during the
69
biological night has been most repeatedly observed and showed strongest effect sizes for
70
monotonous tasks with high attentional demands, at least in young adults (Lo et al., 2012). At the level
71
of cortical excitability, the interplay between sleep homeostasis and the circadian system is reflected in
M
AN
US
CR
IP
T
AC
CE
PT
ED
4/33
young individuals in an overall increase in excitability following 24 h of continuous wakefulness –
73
attributed to the build-up of sleep need (Huber et al., 2013; Ly et al., 2016) – and in more local
74
variations around the evening and early morning – attributed to the influence of the circadian system
75
(Ly et al., 2016).
76
Even in the absence of clinically significant sleep disorders, aging is characterized by
77
deterioration in sleep-wake regulation. In healthy older individuals, sleep intensity, duration and
78
continuity decrease (Dijk et al., 1999; Klerman and Dijk, 2008; Schmidt et al., 2012; Van Cauter,
79
2000), but these changes are not systematically accompanied by increased daytime sleepiness
80
(Klerman and Dijk, 2008). In fact, sleep need and its build-up during wakefulness decrease as one
81
gets older (Landolt et al., 2012; Schmidt et al., 2012). Concomitantly, the timing of the circadian
82
system is advanced and the strength of the circadian signal has been suggested to decrease (Dijk et
83
al., 1999; Kondratova and Kondratov, 2012; Münch et al., 2005). Overall, these combined changes
84
lead to changes in cognition. The acute detrimental cognitive effect of sleep loss is reduced in aging
85
(Landolt et al., 2012; Sagaspe et al., 2012; Schmidt et al., 2012): even though they may achieve
86
overall lower performance than young adults, older individuals suffer relatively less during a night
87
without sleep, at least over several cognitive domains, including vigilant attention, executive function
88
(inhibitory motor control) and mental arithmetics. Whether these changes in cognition regulation during
89
wakefulness may arise from alterations in the impact of sleep homeostasis and of the circadian system
90
on cortical excitability is unknown, however. This question is important because long-term age-related
91
sleep-wake changes lead to a fragmentation of the normal waking-rest cycle - e.g. more wakefulness
92
during night-time sleep – that is associated with an overall decline of cognitive abilities in older
93
individuals (Lim et al., 2013; Oosterman et al., 2009).
94
Here, we repeatedly probed cortical excitability in healthy older and younger individuals during
95
prolonged wakefulness. We used Transcranial Magnetic Stimulation (TMS) coupled to
96
Electroencephalogram (EEG) to record direct perturbations of cortical neuron activity - bypassing
97
sensory systems - using identical stimulations delivered over the exact same brain location. Since
98
frontal brain regions are particularly prone to both ageing (Reuter-Lorenz and Park, 2014) and the
99
interplay between circadian and homeostatic processes (Landolt et al., 2012; Schmidt et al., 2012),
100
cortical excitability was assessed over the frontal cortex. We hypothesized that fluctuations in cortical
101
excitability during prolonged wakefulness would be reduced in older participants, particularly at critical
M
AN
US
CR
IP
T
AC
CE
PT
ED
5/33
time-points for the interplay between the circadian alerting signal and the homeostatic sleep pressure,
103
i.e. in the evening and the end of the biological night – when the circadian signal maximally/minimally
104
opposes high sleep pressure, respectively. Our protocol also included repeated cognitive test
105
batteries, spanning executive and attentional domains. We therefore explored whether a lower but
106
stable cortical excitability profile in older individuals during wake extension would be associated with
107
reduced performance impairment during sleep loss.
108
109
2. Material and Methods
110
2.1 Participants. The study was approved by the Ethics Committee of the Medicine Faculty of the
111
University of Liège. Participants gave their written informed consent and received a financial
112
compensation. Twenty-six healthy participants were enrolled, 13 older adults (62.6 y ± 3.8; 7 women)
113
and 13 young (22.8 y ± 2.9; 5 women). Exclusion criteria included: 1) Body Mass Index (BMI) < 18 and
114
> 28; 2) recent psychiatric history, severe trauma, sleep disorders; 3) addiction, chronic medication; 4)
115
smokers, excessive alcohol (> 14 doses/week) or caffeine (> 3 cups/day) consumption; 5) night shift
116
workers during the last year; 6) transmeridian travel during the last two months; 7) anxiety or
117
depression; 8) poor sleep quality; 9) excessive self-reported daytime sleepiness; 10) early signs of
118
dementia (in older participants). Anxiety was measured by the 21 item Beck Anxiety Inventory (BAI ≤
119
14) (Beck et al., 1988); mood by the 21 items Beck Depression Inventory II (BDI‐II ≤ 14) (Steer et al.,
120
1997); sleep quality by the Pittsburgh Sleep Quality Index Questionnaire (PSQI ≤ 7) (Buysse et al.,
121
1989); daytime sleepiness by the Epworth Sleepiness Scale (ESS ≤ 11) (Johns, 1991); early signs of
122
dementia using Mattis scale (Mattis, 1988). Chronotype was also assessed using the Horne‐Östberg
123
Questionnaire (Horne and Östberg, 1976). One older participant was removed because his
124
performance was 3 interquartile ranges above or below the 25th and 75th percentile of the older
125
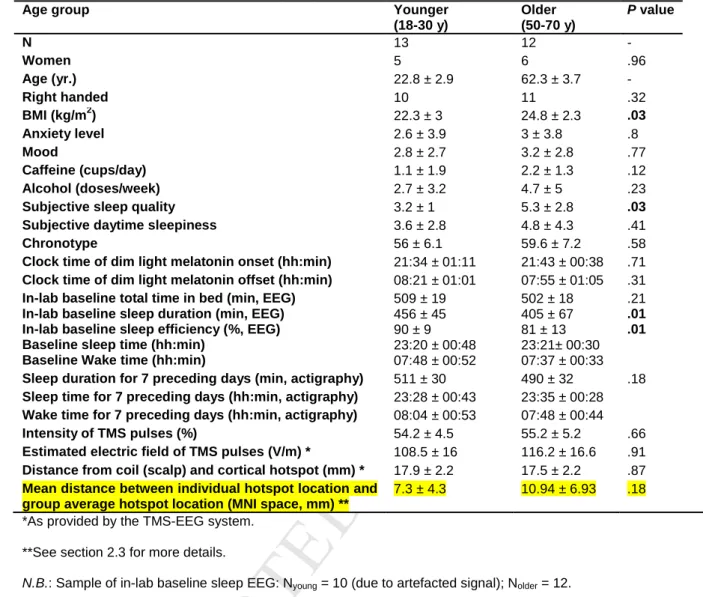
participant sample across all cognitive tasks. Table 1 summarizes the demographic characteristics of
126
the final study sample.
127
128
Insert Table 1
129
130
2.2 Experimental protocol. At least a week before the experiment, participants completed a
131
preparatory TMS-EEG session to determine optimal TMS parameters for artefact-free recodings. As in
M
AN
US
CR
IP
T
AC
CE
PT
ED
6/33
(Huber et al., 2013; Ly et al., 2016), the left or right superior frontal gyrus was set as stimulation target
133
for right or left-handed, respectively. Participants also completed a screening night of sleep to exclude
134
major sleep disorders (periodic leg movement; apnea-hypopnea index > 15/h). During the 7 days
135
preceding the study, they kept a regular sleep-wake schedule (± 15 min; verified using wrist actigraphy
136
- actiwatch, Cambridge Neurotechnology, UK - and sleep diaries). Schedule and duration were based
137
on at least 10 days of unconstrained actimetry recordings and/or self-reported sleep times and
138
duration. Participants were requested to abstain from all caffeine and alcohol-containing beverages for
139
3 days preceding the study.
140
The experiment consisted in a constant routine (i.e. light < 5 lux, temperature ~19°C, regular
141
isocaloric liquid meals and water, semi-recumbent position, no time-of-day information, sound proofed
142
rooms) sleep deprivation protocol, which has repeatedly been a successful mean to assess in-lab
143
inter-individual differences in sleep homeostatic and circadian interplay (Duffy and Dijk, 2002).
144
Participants were maintained in dim light for 5.5 h (< 5 lux), during which they were trained to the
145
cognitive test batteries, prior to sleeping at their habitual bedtime, for their habitual duration (in
146
complete darkness) (Fig. 1a). The TMS-compatible electrode cap was placed upon awaking prior to
147
sustained wakefulness period under 34 h of constant routine conditions. TMS-evoked EEG potentials
148
were recorded 9 times (1000, 1600, 2000, 2200, 0100, 0500, 0700, 1000, 1600 for a subject sleeping
149
from 2300 to 0700). Cognitive test batteries were carried out 13 times during the protocol in between
150
TMS-EEG sessions (1100, 1500, 1700, 1900, 2100, 2300, 0200, 0400, 0600, 0800, 1100, 1300,
151
1500). Overall, the study included 1,500 protocol hours with multiple measures including 225
TMS-152
EEG sessions derived from 13 young and 12 older participants.
153
Insert Fig.1
154
155
2.3 TMS-evoked EEG response acquisitions and processing. Stimulation target was located in the
156
superior frontal cortex on individual structural MRI by means of a neuronavigation system (Navigated
157
Brain Stimulation; Nexstim) (Fig. 1b). This device allows for reproducible evoked EEG responses and
158
precise target location (FDA approval for presurgery). TMS pulses were generated by a Focal Bipulse
159
8-coil (Nexstim, Helsinki, Finland). Each TMS-EEG session included 250-300 trials. Interstimulus
160
intervals were randomly jittered between 1900 and 2200 ms. TMS responses were recorded with a
60-161
channel TMS-compatible EEG amplifier (Eximia; Nexstim), equipped with a proprietary
M
AN
US
CR
IP
T
AC
CE
PT
ED
7/33
hold circuit that provides TMS artifact free data from ~5 ms post-TMS (Virtanen et al., 1999).
163
Electrooculogram (EOG) was recorded with two additional bipolar electrodes. Participants wore the
164
EEG cap during the entire constant routine protocol, and electrodes impedance was set below 5 kΩ
165
prior to each recording session. Signal was band-pass-filtered between 0.1 and 500 Hz and sampled
166
at 1450 Hz. Each TMS-EEG session ended with a neuronavigated digitization of the location of each
167
electrode. Auditory EEG potentials (AEP) evoked by TMS and bone conductance were minimized by
168
diffusing a continuous loud white masking noise through earplugs, and applying a thin foam layer
169
between the EEG cap and the TMS coil. Each session was followed by a sham session consisting in
170
30-40 TMS pulses delivered parallel to the scalp while white noise was diffused at the same level.
171
Absence of AEP was checked online on Cz between 0-500 ms post-TMS (all sessions were
AEP-172
free). Data of sham sessions were not considered any further.
173
EEG data were processed using SPM12 (Statistical Parametric Mapping 12,
174
http://www.fil.ion.ucl.ac.uk/spm/) implemented in Matlab 2015 (The Mathworks Inc, Natick, MA).
175
Processing included the following: visual rejection of artefact, re-referencing to average of good
176
channels, low-pass filtering at 80 Hz, resampling from 1450 to 1000 Hz, high-pass filtering at 1 Hz,
177
epoching between –100 and 300 ms around TMS pulses, baseline correcting (-100 to -1 ms pre-TMS),
178
robust averaging. Cortical excitability was inferred from the slope of the first EEG component (0-35
179
ms) of the TMS evoked potential (TEP; ~ 250 trials per session), measured at the artefact free
180
electrode closest from the frontal hotspot (i.e. the brain location with highest TMS-induced electrical
181
field estimated by the neuronavigation system) (Fig. 1b). This electrode was always located in the
182
stimulated brain hemisphere. It could vary across participants but remained constant at the individual
183
level.
184
The neuronavigation system ensured that hotspot location remained constant across sessions
185
within an individual (± 2 mm). Across individuals, hotspot location varied. The mean coordinates (x, y,
186
z ± SD; MNI space) of the hotspot across all subjects was [-6.6 ± 3.2, 10.1 ± 9.8,71 ± 4.3], while
187
across young or older individuals only, it was [-6.1 ± 3.6, 11.8 ± 7.5,70 ± 2.8] and [-7.1 ± 2.9, 8.3 ±
188
11.9,
72.1
± 5.5], respectively [nb: coordinates of the right hemisphere (case of 3 volunteers) were189
transpose to the homologue location in the left hemisphere, for average location computation].
190
Averages in each group are therefore < 1.8mm in either direction from the overall average, indicating
191
that the area of the superior frontal cortex stimulated was similar in each group. To further assess
M
AN
US
CR
IP
T
AC
CE
PT
ED
8/33
whether hotspot location could contribute to potential group differences, we computed the distance
193
between individual hotspot (median location across all TMS sessions) and average location within
194
each group. Statistical analyses (Wilcoxon rank-sum test) revealed no significant difference between
195
both groups (Table 1).
196
197
2.4 Cognitive test batteries, placed in between TME-EEG recordings, were administered in the same
198
following order to all participants:
199
2.4.1) GO/NO-GO task. This tasks probes motor inhibition (Sagaspe et al., 2012) and requires to
200
press a keypress as quickly as possible for the frequent letter “M”, and to refrain from responding for
201
the target “W” (320 trials; 20% of NO-GO targets; ~ 8.5 min). Letters were displayed for 200 ms and
202
stimulus onset asynchrony randomly varied between 1500 and 1900 ms. Our main performance
203
measure consisted in the number of false alarm (i.e. commission error rate of NO-GO trials, keyboard
204
response).
205
2.4.2) N-back tasks. These tasks require continuous updating of presented information (Lo et al.,
206
2012). Participants were instructed to state whether or not the current letter was identical to the
207
consonant presented 2 and 3 stimuli earlier, respectively for the 2-back and 3-back tasks, by pressing
208
one of two possible keys of the keyboard (75 trials per task; 30% of targets; 2.5 min). Stimulus onset
209
asynchrony was 2 s and letter was displayed for the entire 2 s. D-prime - a response discriminability
210
index (i.e. a measure of sensitivity, following the signal detection theory (Ingleby, 1967)) - was
211
computed for both versions of the task. The n-back task is sensitive to ageing (De Beni and Palladino,
212
2004) and is a difficult task for older individuals, particularly the 3-back version. Although
213
comprehension of the instructions and accuracy was verified during the training prior to baseline sleep,
214
three older subjects did not apply the instructions correctly (e.g. they only responded every 2 or 3
215
items or less), or did not do the task at all, as indicated by a D-prime value close to zero. These
216
subjects were removed from the analyses leaving, for this analyze, 13 young individuals and 9 older
217
individuals. Thus, associations between cortical excitability and behavior are to be considered as
218
preliminary results.
219
2.4.3) Psychomotor Vigilance Task (PVT). This task probes vigilant attention (Basner and Dinges,
220
2011) and requires participants to press a computer space bar as soon as a chronometer
pseudo-221
randomly starts on the screen (random interval of 2-10 s; 48 trials per task; 5 min). Performance was
M
AN
US
CR
IP
T
AC
CE
PT
ED
9/33
inferred from the mean reaction time following removal of anticipation (< 100 ms), and lapses (> 500
223
ms) [and error (> 3000 ms)].
224
2.4.4) Visuomotor vigilance continuous tracking task (CTT). This task also probes vigilant attention
225
and was performed during the TMS-EEG recordings (as in (Huber et al., 2013; Ly et al., 2016)). It
226
consists of keeping a constantly randomly moving cursor on a target located in the center of a
227
computer screen, using a trackball device. The task was preferred to PVT during TMS-EEG recordings
228
because it only requires continuous smooth and limited movement of a single finger and allows for
229
continuous vigilance monitoring. Performance was computed as the average distance (in pixels)
230
between the cursor and the target during TMS-EEG recordings, following removal of lapses. If signs of
231
drowsiness were detected while performing the task during TMS-EEG sessions, the experimenter
232
briefly touched the participant. Transitory lapses of vigilance resulted in temporary increases of the
233
target-cursor distance, and could be automatically detected offline. A lapse was identified when the
234
cursor was located outside a central 200 by 200 pixel box surrounding the target for > 500 ms from the
235
last trackball movement. The lapse period ranged from the last trackball movement until the lapse
236
detection. TMS evoked responses occurring during and < 1 s from a lapse period were discarded from
237
analyses.
238
239
2.5 Salivary melatonin and cortisol samples were first placed at 4°C, prior centrifugation and
240
congelation at -20°C within 12 h. Salivary melatonin and cortisol were measured by
241
radioimmunoassay (Stockgrand Ltd, Guildford, UK), as previously described (English et al., 1993).
242
Most samples were analyzed in duplicate. The limit of detection of the assay for melatonin was 0.8 ±
243
0.2 pg/ml using 500 µL volumes, while it was 0.37 ± 0.05 nmol/L using 500 µL volumes (Read et al.,
244
1977). Estimation of individual’s dim light melatonin onset (DLMO = phase 0°) was determined based
245
on raw values. The 4 first samples were disregarded and maximum secretion level was set as the
246
median of the 3 highest concentrations. Baseline level was set to be the median of the values
247
collected from “wake-up time + 5 h” to “wake-up time + 10 h”. DLMO was computed as the time at
248
which melatonin level reached 20% of the baseline to maximum level (linear interpolation).
249
250
2.6 Sleep EEG data were recorded using a M7000 amplifiers (EMBLA, NATUS, Planegg, Germany)
251
according to the 10/20 system. The habituation night montage consisted of a full polysomnograpy with
M
AN
US
CR
IP
T
AC
CE
PT
ED
10/33
5 EEG channels (Fz, Cz, Pz, Oz, C3) referenced to left and right mastoids (A1, A2), 2 bipolar EOG, 2
253
bipolar electrocardiogram (ECG) channels, 2 bipolar electrodes place on the chin (electromyogram –
254
EMG), 2 bipolar electrodes placed on a leg to check for periodic movements, thoracic and stomach
255
respiratory belts, nasal cannula and an oximeter for sleep related breathing disorder detection.
256
Baseline night montage consisted of 11 EEG channels (F3, Fz, F4, C3, Cz, C4, P3, Pz, P4, O1, O2)
257
referenced to left and right mastoids (A1, A2), 2 bipolar EOG and 2 bipolar EMG channels. EEG data
258
were digitized at a sampling rate of 200 Hz. Sleep EEG recordings were automatically scored using a
259
validated algorhythm (ASEEGA, PHYSIP, Paris, France), including artefact rejection (Berthomier et
260
al., 2007). Three recordings of young participants were rejected because of artefacted signal. Total
261
time spent in bed (TIB), total sleep time (TST), sleep efficiency (SE; the ratio between TST and TIB in
262
%) are reported in Table 1. The other aspects related to sleep will be reported elsewhere.
263
264
2.7 Statistics. The circadian phase of all data points was estimated relative to individual DLMO (i.e.
265
phase 0°, 15° = 1 h). All data points were resampled following linear interpolation at the theoretical
266
phases of the TMS-EEG sessions in the protocol (Fig. 1a): -150°, -60°, 0°, 30°, 75°, 135°, 165°, 210°
267
and 270°. Data were not extrapolated beyond 15° (i.e. 1 h), such that resampling at 300° could not be
268
carried out for the majority of the participants and was advanced at 270° instead. For analyses only
269
including cognitive test batteries, data were resampled every 30°, following linear interpolation, from
-270
135° to 255°. Data points situated 3 interquartile ranges above or below the 25th and 75th percentile
271
were defined as extreme outliers and removed (up to two data points were removed per analyses, i.e.
272
1-2% data points per analyze).
273
Statistical analyses were performed with SAS version 9.3 (SAS Institute, Cary, NC, USA).
T-274
test on independent samples compared group characteristics (Chi squared for proportion
275
comparisons; Table 1). Wilcoxon rank-sum test compared sleep, melatonin, cortisol and relative
276
distance mean values by group (non-normal distribution). Generalized linear mixed models (PROC
277
GLIMMIX) were applied to compute all statistics following determination of the dependent variable
278
distribution (using Allfitdist Matlab function). Subject (intercept) effect was included as random factor.
279
Circadian phase was included as the repeated measure together with an autoregressive estimation of
280
autocorrelation of order 1 [AR(1)], and the covariance structure specified both the subject and group
281
effect. In all GLMMs, degrees of freedom were estimated using Kenward-Roger’s correction (they are
M
AN
US
CR
IP
T
AC
CE
PT
ED
11/33
reported between brackets for each test). If an interaction term was significant, simple effects were
283
assed using post-hoc contrasts (difference of least square means) adjusted for multiple testing with
284
Tukey’s procedure. Betas (i.e. regression coefficient) were derived by applied the ESTIMATE
285
statement. Differences of beta between age groups were not corrected for multiple comparisons.
286
Regressions were used for visual display only, and not as a substitute of the full GLMM statistics.
287
When analyzing the time course of a given variable (i.e. cortical, behavioral and endocrine
288
measures), GLMM model included circadian phase, age group and their interaction. When seeking for
289
associations between cortical excitability (slope of the first TMS evoked EEG response) and
290
behaviour, GLMM model included cortical excitability, the four circadian periods of the protocol (1st
291
early waking day, evening, end of the biological night, 2nd early waking day after sleep loss), age
292
group and all double/triple interactions. Each circadian period gathered two circadian phases (phase
293
75° was excluded to provide a clear distinction as in (Shekleton et al., 2013)) to identify over what part
294
of the circadian cycle associations were detected - rather than specific phase – and to increase
295
statistical power. Circadian phase was included as the repeated measure (i.e. the smallest
296
experimental unit) and an interaction between subject x circadian period was included in the
297
covariance structure to specify that measures from the same subject should be correlated within the
298
same circadian period. Betas in each group are only reported for completeness as the age groups
299
difference in beta was considered for statistics. T-tests on beta coefficients were performed when
300
seeking for group differences in the link between cortical excitability and performance. The association
301
between cortical excitability and 2-back performance significantly diverged across age groups,
302
irrespective of circadian period, in a two-tailed t-test on beta coefficients; this finding was then used as
303
prior for subsequent tests of beta group difference (one-tailed t test).
304
Semi-partial R2 (Rsp 2
) was reported for each significant effect of interest as described in
305
(Jaeger et al., 2017). Generalization of the R2 statistic to GLMMs remains an unresolved problem, with
306
several method proposed (Jaeger et al., 2017; Nakagawa and Schielzeth, 2013). We opted for the
307
approach proposed and validated in (Jaeger et al., 2017), because it allows for a simple computation
308
of semi-partial R2 as [Sum of Squares/(1+Sum of Square)], with [Sum of Squares = NumDF * FValue /
309
DenDF] (NumDF: numerator degrees of freedom (DF); DenDF: denominator DF), provided that DF are
310
estimated using Kenward-Roger’s methods.
311
312
M
AN
US
CR
IP
T
AC
CE
PT
ED
12/33
3. Results313
3.1 Endocrine and sleepiness measures in older and young participants
314
The sleep deprivation protocol was performed under strictly controlled constant environmental
315
conditions to detect both the influence of sleep homeostasis and of the circadian system on our
316
measures of interest (Duffy and Dijk, 2002). Melatonin levels were assayed in hourly saliva samples,
317
and all data were subsequently realigned relative to the onset of melatonin secretion [dim-light
318
melatonin onset (DLMO) = circadian phase 0°], a gold standard marker of endogenous circadian
319
phase (Pevet and Challet, 2011). Thus, all data are reported with respect to individual’s internal
320
circadian clock (and expressed in degrees; 15° = 1h), instead of the external clock time. Statistical
321
analyses sought for effects of circadian phase, age group, and their interaction on the measures of
322
interest through general linear mixed models (GLMMs).
323
Prior to the wakefulness extension, participants slept in the laboratory under polysomnography
324
(Fig. 1a). Time in bed did not differ between age groups (Wilcoxon rank-sum test: Z = 0.79, P = .21;
325
Table 1) but, as expected
(Klerman and Dijk, 2008)
, sleep efficiency was significantly lower in older326
compared to young participants (Wilcoxon rank-sum test: Z = 2.47, P = .01; Table 1). Also as
327
expected
(Sagaspe et al., 2007)
, during the following 34 h of prolonged wakefulness, older participants328
did not feel sleepier that younger participants (main effect of age group, F(1, 21.51) = .46, P = .5; main
329
effect of circadian phase, F(30, 583.5) = 11.72, P < .0001; age group x circadian phase interaction,
330
F(30, 583.5) = 1.10, P = .33; Fig. 2c). In addition, melatonin showed its typical night time secretion
331
profile in both age groups (Fig. 2a), but levels tended to be lower in the older vs. younger group (area
332
under the curve, Wilcoxon rank-sum test: Z = -1.55, P = .06). This may reflect the previously reported
333
reduction in the strength of the circadian signal (Münch et al., 2005). Hourly saliva samples were also
334
assayed for cortisol, which is under strong circadian control as well (Fig. 2b). Cortisol level was
335
significantly higher in older compared with younger individuals (area under the curve, Wilcoxon
rank-336
sum test: Z = 3.4, P < .0007), in line with previous findings (Van Cauter, 2000). Our sample of younger
337
and older healthy individuals appears therefore in line with previous studies on the impact of
338
prolonged wakefulness in ageing.
339
340
Insert Fig. 2
341
342
M
AN
US
CR
IP
T
AC
CE
PT
ED
13/33
3.2 Age-related dampening of the dynamics in cortical excitability during prolonged
343
wakefulness
344
When focusing on cortical excitability measures (i.e. the slope of the earliest EEG response
345
evoked by the TMS pulses), GLMM analyses revealed that its modulation across circadian phases
346
differed between older and young participants (circadian phase x age group interaction, F(8,128.1) =
347
2.09, P = .04; Fig. 3). A significant simple effect of circadian phase was also detected (F(8,128.1) =
348
2.37, P = .02). Subsequent post-hoc comparisons indicated that cortical excitability was lower in the
349
evening and first part of the biological night when compared to the end of the biological night in young
350
individuals (0°, 30°, 75° < 135°, P < .015), while in older, cortical excitability was void of any robust
351
changes over the protocol (P > .05 for all comparisons). Furthermore, cortical excitability was higher in
352
younger vs. older individuals at the end of the biological night (young > older: 135°, P = .02; 165°, P =
353
.06), when the circadian signal does not counter high sleep pressure, suggesting that high sleep
354
homeostat and circadian misalignment do not impact equally cortical excitability of older and young
355
participants. No significant simple effect of age group was found (i.e. irrespective of circadian phase,
356
F(1,24) = 1.56, P = .22). Analyses of the amplitude of the earliest EEG response evoked by the TMS
357
pulses, as an alternative measure of cortical excitability (Ly et al., 2016), led to similar statistical
358
outcomes (Fig. S1). Importantly, these differences were detected while intensity of TMS pulses,
359
estimated electric field generated by TMS, and the distance between the TMS coil and cortical hotspot
360
did not differ between age groups (Table 1).
361
362
Insert Fig.3
363
364
3.3 No significant association between cortical excitability and performance to vigilant
365
attention tasks
366
We then switched to exploratory analyses including measures of cognitive performance to
367
gain insight in the potential impact of cortical excitability dynamics on the outputs of brain function. We
368
first considered the ‘simpler’ tasks of the protocol, which probed vigilant attention. The PVT (Basner
369
and Dinges, 2011) was administered 13 times during the protocol in between TMS-EEG recordings,
370
while the visuomotor constant tracking task [CTT; (Ly et al., 2016)] was administered 9 times during
371
TMS-EEG recordings (Fig. 1a). PVT performance significantly changed across circadian phases (main
M
AN
US
CR
IP
T
AC
CE
PT
ED
14/33
effect of circadian phase, F(13,240.7) = 6.97, P < .0001; Fig. 4a): it remained stable during a normal
373
waking day and then sharply deteriorated (i.e. reaction time increased) during the biological night and
374
early morning hours (75° to 210° > -135° to 0°, 270°, P < .05). Although qualitative inspection of data
375
may suggest that older individuals suffered less from night time prolonged wakefulness, no significant
376
age group difference nor any circadian phase by group interaction were detected [as in (Buysse et al.,
377
2005), but see (Sagaspe et al., 2012)]. CTT performance yielded a circadian phase x age-group
378
interaction (F(8,131.9) = 1.99, P =.05; Fig. 4b). Group differences were detected at all circadian
379
phases except the last three assessments (young < older; -150° to 135°, P < .05; 165° to 270°, P >
380
.05), indicating a differential response to sleep loss, leading to less pronounced differences in
381
performance between age groups towards the end of the protocol. An overall simple effect of circadian
382
phase was also found (F(8, 131.9) = 9.64, P < .0001), with worse performance at the end of the
383
biological night as compared to the first and second circadian day (-150° to 0°, 210°, 270° < 135°,
384
165°, P < .05). A trend for an age group difference was found (young < older, F(1, 23.92) = 3.74, P =
385
.07).
386
We asked whether variations in performance to each vigilant attention task were significantly
387
associated with cortical excitability changes during the protocol. Associations between cortical
388
excitability and vigilant attention measures were investigated over 4 broad circadian periods of the
389
protocol (instead of single circadian phase), known to be critical for the interplay between the sleep
390
homeostasis and the circadian timing system (Dijk and Czeisler, 1995), i.e. the first early waking day,
391
the evening period, the end of the biological night, and the second early waking day after sleep loss
392
(Fig. 1a; see 2.7 Statistics). GLMMs statistical outcomes are reported in Table 2. These analyzes did
393
not reveal any significant association (Supplementary Fig. S2). In our sample, cortical excitability is
394
therefore not significantly associated with performance to tasks relying primarily on vigilant attention.
395
396
3.4 Significant association between the dynamics of cortical excitability and executive
397
performance during prolonged wakefulness
398
Our focus then switched to the cognitive tasks with a higher executive load: the 2-back and
3-399
back versions of the n-back task and the GO/NO-GO task, which were administered during the
400
cognitive test batteries (Fig. 1a; right before the PVT). The 2- and 3-back tasks are more
resource-401
demanding than the GO/NO-GO, such that three older individuals were removed from the n-back
M
AN
US
CR
IP
T
AC
CE
PT
ED
15/33
analyses because task instructions were not applied correctly (De Beni and Palladino, 2004) (see
403
2.4.2) N-back tasks). The 2- and 3-back tasks showed overall similar performance profiles (Fig. 4c-d).
404
Performance to the 2-back task changed across circadian phases (F(13,191.7) = 2.30, P = .007), and
405
according to the age group (young > older, F(1,20.27) = 8.01, P = .01), but without a circadian phase x
406
age group interaction (F(13,191.7) = 1, P = .45). Performance to the 3-back task showed a significant
407
circadian phase x age group interaction (F(13,221.1) = 3.29, P = .0001), a simple effect of age
408
(F(1,19.96) = 11.96, P = .03), but no simple effect of circadian phase (F(13,221.1) = 1.43, P = .15). For
409
both tasks, post-hoc comparisons revealed that young individuals performed significantly better than
410
older adults from the beginning of the protocol to the middle of the night (2-back: young > older, -135°
411
to 105°, P ≤ .05; 3-back: young > older, -135° to 75°, P ≤ .05). In addition, in young individuals,
412
performance was significantly worse during the end of the biological night and early morning following
413
sleep loss compared to all prior measurements (2-back: young, -135° to 75° > 165°, -75° to -15° >
414
195°, -75° to -45° > 135°, P < .05; 3-back: young, -135° to 75° > 105° to 225°, P < .05), while no
415
differences between circadian phases were detected in older individuals (P > .05 for all comparisons).
416
GO/NO-GO performance (Fig. 4e) yielded a significant main effect of circadian phase (F(13,234.8) =
417
1.84, P = .04), a trend for a main effect of age group (F(1,23.21) = 3.99, P = .057), with higher
418
commission error rate in younger individuals, but no circadian phase x age group interaction
419
(F(13,234.8) = .79, P = .67). Post-hoc contrasts yielded significant differences between age groups,
420
with better performance in the older group from the end of the biological night until the end of the
421
protocol (older < younger: 135° to 195°, 255°, P < .05).
422
423
Insert Fig. 4
424
425
These results show that overall performance to an n-back task is lower in older individuals,
426
while it is higher for the GO/NO-GO, as in (Sagaspe et al., 2012). Better age-related performance to
427
the GO/NO-GO may arise from a speed-accuracy trade-off (Staub et al., 2015) (Supplementary Fig.
428
S3d). The results further confirm that, for both types of executive tasks, older individuals suffer
429
relatively less from sleep loss as compared with the younger group (Sagaspe et al., 2012), a pattern
430
that is reminiscent of the dynamics in the underlying cortical excitability. To formally test this similarity,
431
we computed GLMMs to address whether executive task performance was associated with cortical
M
AN
US
CR
IP
T
AC
CE
PT
ED
16/33
excitability over the four circadian periods of the protocol (1st early waking day, evening, end of the
433
biological night, 2nd early waking day after sleep loss). Statistical outcomes are reported in Table 2.
434
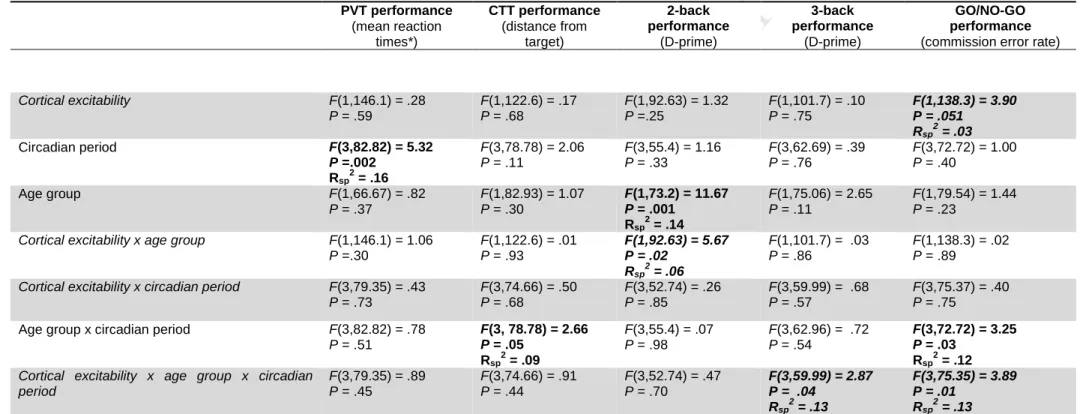
435
Insert Table 2
436
437
We found that the direction of the association between executive performance and cortical excitability
438
differed between age groups. For the 2-back, this association was irrespective of the circadian period
439
(significant cortical activity x age group interaction; Table 2). Higher cortical excitability was associated
440
with better performance in the older group, whereas the inverse was true for young adults (beta young
441
= -.41; beta older = 1.17; young vs. older, P = .02; Fig. 5a and Supplementary Fig. S3a). Analyses
442
yielded similar results when considering the 3-back and GO/NO-GO tasks, but at specific critical
443
circadian periods (significant cortical excitability x age group x circadian period interaction; Table 2).
444
For the 3-back, higher cortical excitability was associated with poorer and better performance,
445
respectively, in the young and older group at the end of the biological night, when the circadian signal
446
maximally promotes sleep at a time of very high sleep need (Dijk and Czeisler, 1995) (beta young =
-447
.36; beta older = .6; young vs. older, P = .07; Fig. 5b). Considering the GO/NO-GO task, higher
448
cortical excitability was associated with poorer and better performance, respectively, in the young and
449
older group during the evening, when the circadian alerting signal maximally counteracts the need for
450
sleep (Dijk and Czeisler, 1994) (beta young = .73; beta older = -.19; young vs. older, P = .02; Fig. 5c).
451
GO/NO-GO performance was also positively related to cortical excitability, irrespective of age group
452
and circadian period (main effect of cortical excitability, F(1,138.3) = 3.90, P = .05; Table 2).
453
454
Insert Fig. 5455
456
4. Discussion457
Elucidating the bases of age-related changes in brain function is a crucial scientific challenge. Here we
458
focused on cortical excitability, an essential aspect of basic brain function previously implicated in
age-459
related cognitive decline (Rizzo et al., 2015). The data reveal that cortical excitability dynamics during
460
prolonged wakefulness dampens in ageing, with only minor variations during the protocol. The
age-461
related decrease in the build-up of sleep pressure and in the amplitude of the circadian signal,
M
AN
US
CR
IP
T
AC
CE
PT
ED
17/33
previously detected in EEG synchrony, behavior and endocrine measures (Dijk et al., 1999; Landolt et
463
al., 2012; Münch et al., 2005; Schmidt et al., 2012), are therefore also reflected in the dynamics of a
464
basic aspect of brain function, making cortical excitability of older adults less susceptible to sleep loss
465
and circadian misalignment. This finding alone may have implications for neurostimulation and
466
neurorehabilitation, which are therapies commonly provided for age-related neurological disorder (Di
467
Pino et al., 2014).
468
There are several potential mechanisms underlying the progressive change in cortical
469
excitability dynamics in ageing, and we are not in a position to isolate them. Recent mouse data
470
indicate that the repertoire of single neuron activity during wakefulness and sleep in the motor cortex is
471
stable in aging, suggesting that single neuron functional characteristics change very little over the
472
lifespan (McKillop et al., 2018). Change in threshold and amplitude of action potentials, as well as in
473
their frequency have, however, been reported in aging (Rizzo et al., 2015). Similarly, ion channel
474
function and neuromodulator concentrations are progressively altered over the lifespan (Mather and
475
Harley, 2016; Raz and Rodrigue, 2006; Rizzo et al., 2015). In addition, age-related reduction in clock
476
gene expression (Chen et al., 2016; Kondratov et al., 2006) or alterations in homeostatic
sleep-477
dependent gliotansmission regulation (Meyer et al., 2007) were detected. Interestingly, neuronal
478
desynchrony in the aged suprachiasmatic nucleus (SCN), i.e. the circadian master clock in mammals,
479
was found in an animal model, resulting in an overall dampening of SCN activity fluctuation over the
480
circadian cycle (Farajnia et al., 2012). Our findings suggest that reduced circadian variation in
481
neuronal function also takes place within the frontal cortex, i.e. outside the master circadian clock.
482
Cortical excitability may ultimately be related to synaptic strength (Rossini and Rossi, 2007). If
483
true, we could infer that, in young individuals, extended wakefulness during the biological night
484
prevent sleep-dependent synaptic downscaling (Tononi and Cirelli, 2006) and increases overall
485
synaptic strength (de Vivo et al., 2017), concomitantly to a strong circadian modulation. In older
486
individuals, we barely detected any changes in cortical excitability when wakefulness was prolonged
487
from one day to the next day (cf. Fig.3, -150° vs. 210° or -60° and 270°). This could be due to
age-488
related synaptic changes (Morrison and Baxter, 2012), which would lead to overall reduced
489
experience-dependent synaptic modification so that sleep would be less required for maintaining
490
synaptic function in aging. This is in line with the age-related reduction in sleep need build-up
491
(Klerman and Dijk, 2008; Shiromani et al., 2000). In vitro research suggests that TMS triggers
M
AN
US
CR
IP
T
AC
CE
PT
ED
18/33
responses mainly arising from neuron somas (Pashut et al., 2014), such that age-related changes in
493
cortical excitability may also be driven, at least in part, by neuron cell-body.
494
Importantly, we do not find significant difference between age groups irrespective of circadian
495
phase. This is in line with another study (Casarotto et al., 2011), but is contradicting other previous
496
indications of a reduced cortical and neuronal excitability in ageing (Ferreri et al., 2017). Discrepancies
497
between studies may in fact reside, at least in part, in the differential impact of sleep need and
498
circadian phase on cortical excitability as one gets older (if prior sleep-wake history or time-of-day
499
were not properly controlled for). While we do not demonstrate that physiological ageing has no impact
500
on overall cortical excitability, our results strongly suggest that, in comparison, the age-related
501
changes in the dynamics of cortical excitability during prolonged wakefulness are more important.
502
Change in cortical excitability represents part of one’s capacity to adapt to daily challenges.
503
We confirm that, in young individuals, this adaptation takes the form of a non-linear circadian
504
modulation of cortical excitability (i.e. significant difference between the evening vs. early morning)
505
likely reflecting combined circadian and sleep homeostasis influences (Huber et al., 2013; Ly et al.,
506
2016). The dampening of cortical excitability dynamics during prolonged wakefulness in older
507
participants might therefore reflect less adaptable brain underlying reduced cognitive flexibility in
508
aging. In other words, the flexibility in cortical excitability and behaviour seen in young during
509
prolonged wakefulness might be a positive allostatic response to acute disruption of the sleep-wake
510
cycle, and ultimately an indicator of cognitive fitness.
511
Exploratory analyses show that cortical excitability may be differentially related to different
512
aspects of cognition as in our data set it was significantly related to performance to executive tasks,
513
but not to vigilant attention tasks. Using a larger sample of younger individuals, we did find, however,
514
an association between cortical excitability dynamics during sleep loss and vigilant attention (Ly et al.,
515
2016). Our data further suggest that the direction of the association between cortical excitability and
516
executive performance may change across the age groups: in our data set, older individuals’
517
increased cortical excitability is associated with better performance, whereas in young adults it is
518
associated with worse performance. This may again be related to specific and relatively subtle
519
synaptic alterations which are associated with impairments in cognitive function, rather than to a
520
merely loss of neurons in the neocortex (Morrison and Baxter, 2012). This preliminary finding may also
521
indicate that older participants displaying a margin ability in increasing cortical excitability (i.e. cortical
M
AN
US
CR
IP
T
AC
CE
PT
ED
19/33
resilience) perform better in task requiring a high degree of cognitive flexibility, such as executive
523
function (Gajewski and Falkenstein, 2018). It is important to stress, however, that no causal link can
524
be drawn for the present study. Our findings may point toward a role for the dynamics of cortical
525
excitability during prolonged wakefulness in driving age-related variations in cognitive performance, at
526
least for executive processes. We surmise that this link would follow two different trajectories
527
depending on age: an inverted U-shape for the young, with an optimal level of cortical excitability
528
beyond which performance would be negatively related to higher cortical excitability. In young
529
individuals, cortical excitability would be close to this optimal level during the circadian day while well
530
rested, as indicated by mostly high and stable performance, but the significant rise in cortical
531
excitability found during the biological night would be detrimental for cognition. In contrast, in older
532
individuals, the link between cortical excitability and performance would be linear. Modifications of
533
cortical excitability, through changes in the circadian system and in the build-up of the need for sleep,
534
are reduced or compromised in older individuals: the optimal level beyond which the association
535
becomes negative is not reached. Since the association between cortical excitability and executive
536
performance was positive in older adults, it may imply that cognition could be improved in ageing by
537
acting on neuron excitability, but this remains to be formally tested with a large sample size. Herein,
538
we observed an association between cortical excitability and executive performance at specific
539
circadian periods for two out of the three executive tasks. Future investigations, in larger sample size,
540
are required to confirm these preliminary findings and address notably whether the association
541
between cortical excitability and executive performance is specific to certain circadian periods or is
542
present at all circadian phases with variable strength.
543
The reason for the unequal association between cortical excitability and different cognitive
544
domains may resides in part on the distinct brain regions sustaining them: executive function rely
545
heavily (but not exclusively) on the frontal cortex, the region probed with TMS in the present study,
546
while the cortical substrates of attentional processes are more posterior and depend more
547
substantially on the parietal cortex and on subcortical areas (Fan et al., 2005; Schmidt et al., 2009).
548
Furthermore, evidence suggest that early age-specific and subtle neural changes are nested primarily
549
in the frontal cortex areas (Daigneault et al., 1992; Masliah et al., 1993) sustaining high order abilities
550
(Wang et al., 2011), so that executive functions are amongst those most vulnerable to the ageing
551
process. Our cortical measure may have caught these subtle age-related differences in measures of
M
AN
US
CR
IP
T
AC
CE
PT
ED
20/33
executive performance, especially when considering early stages of cognitive decline (our age sample
553
was ~ 60 y old).554
555
5. Conclusions556
Herein, we tested whether sleep-wake regulation of basic cortical function changed across
557
young adults (< 30 y) to late middle-aged individuals (50-70 y). We demonstrate that the dynamics of
558
cortical excitability during prolonged wakefulness dampens in older individuals, presumable because
559
of the age-related changes in the interplay between circadian rhythmicity and sleep homeostasis
560
(Schmidt et al., 2012). We further provide preliminary evidence that the lessened clockwork of the
561
circadian and sleep homeostasis processes in ageing may act upon cognition through a reduction of
562
cortical excitability during extended wakefulness. It is likely that this process does not suddenly
563
change at the age range of 60 years, but gradually abate from the middle year of life (Carrier et al.,
564
2001). The current results provide a framework for future studies that should address whether
565
preserved cortical excitability dynamics during sustained wakefulness may counteract cognitive
566
decline into advanced age, but also protect against neurodegenerative diseases, such as Alzheimer’s