Publisher’s version / Version de l'éditeur:
Canadian Journal of Chemical Engineering, 90, 6, pp. 1562-1569, 2011-12-07
READ THESE TERMS AND CONDITIONS CAREFULLY BEFORE USING THIS WEBSITE. https://nrc-publications.canada.ca/eng/copyright
Vous avez des questions? Nous pouvons vous aider. Pour communiquer directement avec un auteur, consultez la première page de la revue dans laquelle son article a été publié afin de trouver ses coordonnées. Si vous n’arrivez Questions? Contact the NRC Publications Archive team at
PublicationsArchive-ArchivesPublications@nrc-cnrc.gc.ca. If you wish to email the authors directly, please see the first page of the publication for their contact information.
NRC Publications Archive
Archives des publications du CNRC
This publication could be one of several versions: author’s original, accepted manuscript or the publisher’s version. / La version de cette publication peut être l’une des suivantes : la version prépublication de l’auteur, la version acceptée du manuscrit ou la version de l’éditeur.
For the publisher’s version, please access the DOI link below./ Pour consulter la version de l’éditeur, utilisez le lien DOI ci-dessous.
https://doi.org/10.1002/cjce.20698
Access and use of this website and the material on it are subject to the Terms and Conditions set forth at
Pervaporative enrichment of 2,3-butanediol from its mixture with
1-butanol using a polydimethylsiloxane and ZSM-5 mixed matrix
membrane : effects of ethanol as a by-product
Shao, Pinghai; Kumar, Ashwani
https://publications-cnrc.canada.ca/fra/droits
L’accès à ce site Web et l’utilisation de son contenu sont assujettis aux conditions présentées dans le site LISEZ CES CONDITIONS ATTENTIVEMENT AVANT D’UTILISER CE SITE WEB.
NRC Publications Record / Notice d'Archives des publications de CNRC: https://nrc-publications.canada.ca/eng/view/object/?id=4ca5fd20-a2eb-431e-9d77-825894075764 https://publications-cnrc.canada.ca/fra/voir/objet/?id=4ca5fd20-a2eb-431e-9d77-825894075764
Pervaporative Enrichment of 2,3-Butanediol from its Mixture with
11-butanol using a Polydimethylsiloxane and ZSM-5 Mixed Matrix
2Membrane: Effects of Ethanol as a By-product
§3 4
Pinghai Shao, Ashwani Kumar* 5
Institute for Chemical Process and Environmental Technology, National Research Council
6
Canada, M-12, 1200 Montreal Road, Ottawa, Ontario, Canada K1A 0R6
7 8
A ZSM-5 filled polydimethylsiloxane membrane with 44.4 wt. % zeolite loading was used in the 9
pervaporative removal of 1-butanol from its mixtures with 1-butanol. A small quantity of ethanol 10
was added to the feed as a by-product to test the response of the membrane. It was found that the 11
permeation behavior of other feed components was changed and membrane selectivity decreased. 12
This change was attributed to the frequently-observed inter-component coupled transport in 13
multi-component feed systems. The impact of ethanol on recovery of 2,3-butanediol was 14
evaluated using a simulated continuous operation, which enriched 2,3-butanediol to 99.5 wt. % 15
from a feed containing 5 wt. % 2,3-butanediol and less than 1.0 wt. % ethanol. It was observed 16
that membrane selectivity improves as ethanol concentration decreases in the stream due to its 17
preferential removal. The final recovery of 2,3-butanediol was not significantly reduced as the 18
concentration of ethanol was below 1.0 wt.%. 19
Keywords: Pervaporation, coupled transport, mixed matrix membrane, 2, 3-butandiol, ethanol 20
§ NRCC No.: 52895
21
* Author to whom correspondence may be addressed,
22
Tel: +1 613 998 0498; fax: +1 613 991 2384
23
Email address: ashwani.kumar@nrc-cnrc.gc.ca
24 25
INTRODUCTION 1
The importance of 2,3-butanediol as a versatile chemical feedstock has long been identified. It 2
can be easily converted into methyl ethyl ketone, an industrial solvent; into 1, 3-butadiene, a 3
monomer for rubber synthesis; and into various esters as effective plasticizers for thermoplastic 4
polymer processing (Lee, 1999; Syu, 2001; Jansen et al., 2010; Garg et al., 1995). 2,3-butanediol 5
can be produced by chemical synthesis or by biomass conversion through fermentation. Since 6
bioconversion is a green process, and more importantly, in this way many abundantly available 7
cheap resources (e.g., crop residue) and process wastes (e.g., wood waste) can be transformed 8
into valuable product without causing environmental concerns. It is generally believed that the 9
biomass conversion approach represents the future direction in manufacturing this much-needed 10
chemical feedstock. 11
Recovery of the dilute 2,3-butanediol from the fermentation broth is a challenging task (Garg et 12
al., 1995; Magee et al., 1987). The key factors responsible for this challenge are its high boiling 13
point (184 oC), and high affinity with water, which is the major components of the broth. It has
14
been found that no single method is energy-efficient for the recovery of 2,3-butanediol (Maddox, 15
1996). An integrated process (Shao and Kumar., 2009) based on solvent extraction and 16
membrane pervaporation has been proposed. In this process, 1-butanol was employed as the 17
extracting solvent, which demonstrated excellent capability in terms of its high partition 18
coefficient and good selectivity. The dehydrated extract stream containing mainly 2,3-butanediol 19
and 1-butanediol was further treated by pervaporation using polydmethylsiloxane (PDMS) 20
membrane, through which the solvent 1-butanol was removed for recycling, and 2,3-butanediol 21
was enriched in the retentate. Subsequent research effort (Shao and Kumar, 2009) was given to 22
the improvement on the selectivity of PDMS membrane using ZSM-5 zeolite. It was found that 1
with the incorporation of zeolite, the filled membrane showed reduced permeability and 2
increased selectivity. The advantage of the filled membrane over the pure PDMS membrane was 3
demonstrated by a simulation, revealing that recovery of 2,3-butanediol could be enhanced by 4
25.8 %. 5
One noteworthy fact on the study is that the feeds used in experiments are not the real broth but 6
simulated mixtures, which retain merely the key components of the fermentation broth, i.e. water, 7
and 2,3-butanediol. As a matter of fact, a small quantity of byproduct (e.g., ethanol) is usually 8
present in the fermentation stream (Larson, 1973; Mas, et al., 1988; Ui et al., 1986; 1998). It is 9
well known that in membrane separations the presence of small quantities of by-products in feed 10
may drastically change the membrane performance (Vu et al., 2003; Chern et al., 1983; Djoekita, 11
2000; Ratcliffe et al., 1999; Mazur and Chan, 1982; Funk et al., 1986; Shao and Huang, 2007). In 12
order to address this uncertainty, experiments were conducted with ethanol added as a by-13
product in the feed. The coupled transport (Baranowski, 1991; Kuhn, et al., 2009; Yu et al., 14
2007), which is frequently encountered in pervaporation, particularly in multi-component feed 15
separation, was observed in this work, and the resulting unusual transport properties of the 16
membrane were thus interpreted in this theory. The variation of ethanol concentration in the 17
retentate stream was studied by simulation, and its impacts on membrane selectivity and final 18
recovery of 2,3-butanediol are also reported in this work. 19
20 21 22
EXPERIMENTAL
1
Materials
2
Solvents 2,3-butanediol (98.0 wt.%, the balance is mainly isomers) and 1-butanol (99.7 wt.%) 3
were purchased from Sigma-Aldrich, Canada, anhydrous ethanol was purchased from Brampton, 4
Canada, and pentane (99.7 wt.%) from Fisher Scientific. Silicone elastomeric base (dimethyl 5
siloxane) and the corresponding curing agent (dimethyl, methylhydrogen siloxane) were 6
obtained from Dow Corning, USA. ZSM-5 zeolite powder (3m, Si/Al ratio 137) was obtained 7
from Zeolyst, USA. Pure water (18.1 MΩ.cm) used was generated with a Milli-Q® water 8
purification system. The pre-purified helium (99.999 %) carrier gas was supplied by BOC Gases, 9
Canada. 10
Preparation of ZSM-5 Filled PDMS Membranes
11
The silicone elastomeric base (ten parts) and curing agent (one part) into pentane for preparing 12
10 wt.% silicone rubber pre-polymer solution, the pre-dried ZSM-5 powder was then added into 13
the solution, with the zeolite loading controlled at 44.4 wt. % as this loading gives the best 14
membrane selectivity (Shao et al., 2009). The ZSM-5 particles were dispersed in the pre-polymer 15
solution using a sonicator (150D, VWR International) for 30 min. A portion of 27 ml of the 16
suspension was used for making each membrane sample in a horizontally set Teflon dish (85 mm 17
in diameter). After evaporation of pentane, the membrane was moved to an oven to perform 18
cross-linking at 90oC for 12 h. The thickness of the membrane was measured with a micrometer
19
at three different locations, and the mean thickness of the membrane was 367 5 microns. 20
Membrane Characterization by Scanning Electron Microscopy
1
A selected membrane sample was immersed in liquid nitrogen for 30 seconds and cut into strips. 2
The dried strips were then sputter coated with gold, and the cross-section of the membrane was 3
imaged using a JEOL 840A scanning electron microscope (SEM). The SEM image as shown in 4
Fig. 1 indicates that the uniform dispersion of the ZSM-5 filler, and the good adhesion between 5
the ZSM-5 filler and the surrounding PDMS were achieved. 6
Pervaporation Performance of the Filled Membrane
7
The feed used for evaluating membrane performance is the ternary mixtures of 1-butanol/2,3-8
butanediol/ethanol, which also contains small quantities of water for simulating the real 9
compositions of the dehydrated extract as done in our earlier work (Shao et al., 2009; 2009). The 10
downstream pressure in pervaporation was kept at 2 mmHg (267 Pa) using a vacuum pump. As 11
the membrane permeation reached a steady state, permeate was collected in a glass tube 12
submerged in liquid nitrogen. The mass of permeate was measured with a electronic balance, and 13
the composition of permeate was analyzed using a SRI 8610G gas chromatograph equipped with 14
a HAYESEP D column and a TCD detector. The temperatures of the oven, injector, and detector 15
were all kept at 270oC.
16
Membrane permeability ( P ) and selectivity () are defined as follows: 17 i i i C t A Y W P (1) 18
k k i i X X C (2) 19j i i j P P (3) 1
where W is the mass of the permeate collected in time interval t, A is the effective membrane 2
area for the separation, is the membrane thickness, C is the concentration of the component in 3
the feed, which acts as the driving force for mass transport as the concentration of permeate in 4
the downstream is ignored, is the density of a feed component, and X and Y represent the mass 5
fraction of a component in the feed and permeate phase, respectively. 6
RESULTS AND DISCUSSION
7
Permeation Behaviors of Feed Components
8
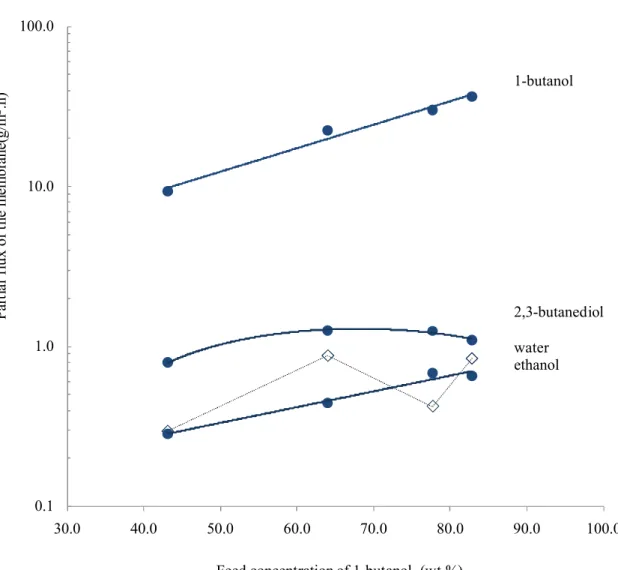
The partial fluxes of the ZSM-5 filled PDMS membrane for components 1-butanol, 2,3-9
butanediol, ethanol, and water at 50oC are illustrated in Fig. 2. 1-butanol and 2,3-butanediol are
10
the two key components of the feed, in which ethanol was kept essentially in the range of 0.80-11
0.92 wt.%, and the contents of water 0.38, 0.95, 0.35 and 0.63 wt.%. It was clear that the flux of 12
1-butanol increased exponentially as its content in the feed increased, suggesting that swelling 13
occurred to the filled PDMS membrane. The swelling of the membrane resulted largely from 1-14
butanol, which is the major feed component and for which the membrane shows higher affinity. 15
Similar behavior is with ethanol transport through the membrane. For the less permeable 2,3-16
butanediol, more complicated permeation was observed. As the concentration of 1-butanol 17
increased from 43 to about 65 wt. %, the mass transport driving force for 2, 3-butanediol was 18
actually reduced, the flux of 2,3-butanediol was, however, increased. According to the mass 19
transport equation shown in Eqn (4): 20
C D
Flux
(4) 1
where C and D are the concentration and diffusion coefficient of 2,3-butanediol, respectively. 2
Clearly the increased flux of 2,3-butanediol was mainly due to its enhanced mean diffusivity in 3
the highly swollen membrane because of the higher content of 1-butanol in the feed. This type of 4
transport characteristic of 2,3-butanediol was not observed in our earlier work, where the same 5
membrane was tested with the same feeds but without ethanol (Shao et al., 2009) Obviously, the 6
presence of ethanol at a low concentration contributed to this complex membrane transport. In 7
addition to 1-butanol, PDMS also shows a high affinity for ethanol, and PDMS is thus a typical 8
membrane material selected for removing ethanol from the fermentation broth (Vane et al., 2008; 9
Vane, 2005; Bowen et al., 2007). 10
Permeability and Selectivity
11
The permeability of 1-butanol, 2,3-butanediol, ethanol, and water is shown in Fig.3. As 12
discussed previously, the membrane was swollen by the feed, largely by the solvent 1-butanol, 13
the permeability of the component thus became dependent upon the feed concentration of 1-14
butanol. The exponential concentration-dependence of the permeability is summarized in Table 1. 15
In our previous work (Shao et al., 2009), the filled membrane displayed a higher permeability for 16
1-butanol than for water. However, a reversed permeability order was observed in this work as 17
shown in Fig. 3. The favored permeation of water in the filled hydrophobic membrane certainly 18
benefits from its small molecular size. Yet in this case, the coupled transport between water and 19
ethanol should be responsible for this reversed order. In multiple components membrane 20
separation, it is generally believed that the strength of component/component and 21
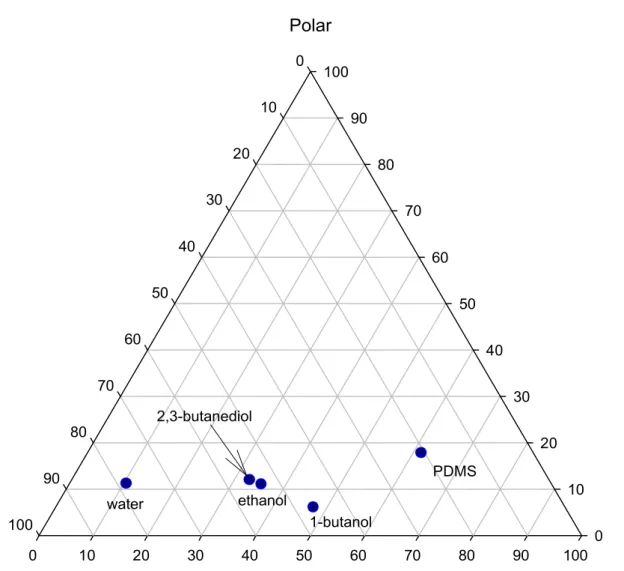
component/membrane interactions can be measured by the difference in their solubility 1
parameter (Shao et al., 2007). The three components (polarp, dispersiond , and hydrogen
2
bonding interactionh) of the solubility parameter as represented in Fig. 4 were normalized in
3
the following manner: 4
2 2 2 2 h d p i i f (5) 5where superscript i stands for p, d, and h, respectively. Obviously, 2,3-butanediol and ethanol are 6
the closest components to water. Since the concentration of 2,3-butanediol is very low in the 7
membrane phase (One of the indicators is the lower membrane flux for 2,3-butanediol), it can be 8
reasonably considered that coupled transport occurred primarily between water and ethanol, and 9
the coupled transport facilitated the mass transfer of water in filled membrane. 10
Since ZSM-5 is more hydrophobic than PDMS (Shao et al., 2009), the local position of the 11
solubility parameter of the filled membrane should be even farther from the hydrogen bonding 12
pole than that of PDMS as shown in Fig. 4. As a result, the filled PDMS membrane should have 13
shown higher permeability for 1-butanol than ethanol. This prediction is only found valid as the 14
PDMS membrane was used for removing the solute ethanol and 1-butanol from their aqueous 15
solutions (Shao et al., 2009). It is not the case in this multiple components separation, where 16
ethanol is the one of the minor components, and 1-butanol is, however, one of the major 17
components, which act as the solvent. This reversed order in permeability implies that coupled 18
transport had truly occurred to the minor component ethanol. And according to Fig. 4, the 19
dominant coupling component, responsible for this enhanced ethanol transport in the membrane 20
should be 1-butanol. 21
The selectivity of the membrane for the more permeable component over 2,3-butanediol was 1
depicted in Fig. 5. As mentioned previously, due to the favorable coupled transport, both water 2
and ethanol experienced increased permeation, the selectivity of the hydrophobic membrane for 3
water and ethanol exceeds that of 1-butanol. This permeation characteristic ensures that ethanol 4
can be preferentially removed by the membrane, it can thus be anticipated that no serious 5
challenge can be created as the membrane is used for processing the feed stream, in which 6
ethanol exists as a by-product. 7
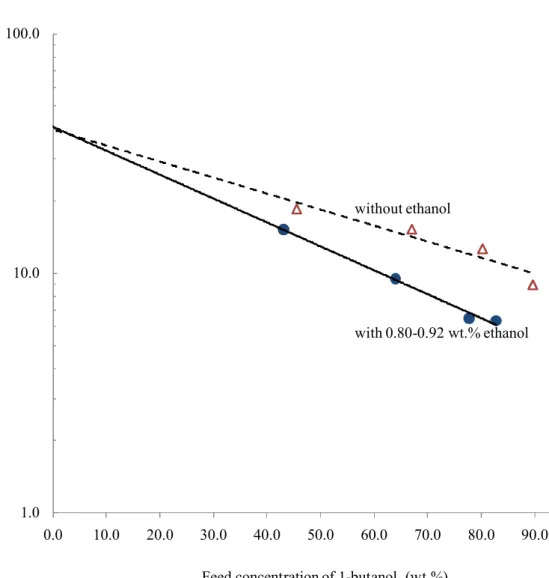
Fig. 6 shows the demonstrated selectivity of the filled membrane while processing feeds with 8
and without ethanol. Obviously the filled membrane lost some selectivity when dealing with feed 9
containing 0.80-0.92 wt.% ethanol. Fortunately, this loss is not significant. As the separation 10
continues, the ethanol content in the feed would keep decreasing, and the selectivity loss would 11
become even less significant. By extrapolating, it can also be seen in Fig. 6 that the two 12
selectivity lines intersect at a point very close to the zero concentration of 1-butanol (the pure 13
2,3-butanediol feed). Obviously, the membrane demonstrates the highest selectivity as the 14
contents of ethanol and 1-butanol approach zero. On the other hand, it also suggests that the 15
linear regression treated for the selectivity data as shown in Fig. 6 is reasonable. 16
Effects of Temperature
17
The temperature-dependence of the partial flux of 1-butanol, 2,3-butanediol, ethanol and water is 18
plotted in Fig. 7(a). The dependence can be characterized by the Arrhenius relationship except in 19
the case of 2,3-butanediol. Interestingly, for 2,3-butanediol, the Arrhenius relationship still holds 20
true if the temperature range is divided into two sections (30-50oC, and 50-80oC). The specific
21
reasons for this are not quite clear. It is likely that at lower temperatures, the dissolution of 2, 3-22
butanol in the membrane is dominated by its interactions with ethanol (according to Fig. 4, 2,3-1
butanediol shows the highest affinity for ethanol), and the solubility and thus permeation flux of 2
2,3-butanediol in the membrane could be well enhanced. With the rise of feed temperature, 3
thermodynamically, the concentration of ethanol in the membrane phase would reduce, also the 4
association between ethanol and 2,3-butanediol can no longer be as strong. It could be visualized 5
that “disintegration” would gradually occur to the coupling between 2,3-butanediol and ethanol, 6
and meanwhile the relatively weak interaction between 2,3-butanediol and 1-butanol would turn 7
back to be the dominant interaction, and eventually govern the dissolution of 2,3-butranediol in 8
the membrane phase. In support for this analysis, it is clear from data listed in Table 2, that the 9
permeation activation energy of 2,3-butanediol in the range of 30-50 oC is much smaller than that
10
in the range of 50-80oC. The permeation activation energy of the component was estimated by
11
Eqn. (6) (Shao et al., 2005; Huang et al., 2001; 2002): 12 ) / 1 ( ln ) ( T F Ea permeation i i (6) 13
where F is the partial flux, T is the temperature (K). The difference may primarily be due to the 14
change in the dissolution enthalpy of 2,3-butanediol in the altered membrane environment as the 15
feed temperature rises. The temperature-dependence of the selectivity was plotted in Fig. 7(b). 16
Due to this unique transport feature of 2,3-butanediol over the wide range of feed temperatures, 17
the selectivity of the membrane for all the more permeable component (water, ethanol and 1-18
butanol) at the lower temperature range increases with increasing temperature, and reaches a 19
peak value at a temperature around 50oC. Also in higher temperature range, that type of coupling
20
is significantly suppressed and the typical temperature-dependence of the selectivity is thus 21
restored. 22
Numerical Simulation of 2,3-Butanediol Enrichment in Continuous Operation
1
As demonstrated previously, the presence of ethanol in the feed diminishes membrane selectivity. 2
Since ethanol concentration keeps on decreasing during the course of pervaporation, the 3
membrane selectivity would increase as the separation proceeds. In order to evaluate the impact 4
of this reduced yet variable membrane selectivity on the enrichment of 2,3-butanediol, a 5
simulated continuous pervaporation operation was performed based on the laboratory 6
permeability data, for a targeted product purity of 99.5 wt.%. The details on the three feeds 7
considered were summarized in Table 3. The contents of ethanol considered in two of the feeds 8
are 0.5 and 1.0 wt.%, respectively. For calculating the permeation rates of a potential composite 9
membrane for the separation, the thickness of the filled PDMS thin film is assigned a typical 10
value of 5 microns (Shao et al., 2009). 11
Assuming PV is an isothermal process, and a plug-flow on the retentate side of the membrane. 12
By ignoring the possible diffusion layer resistance in the retentate flow, and neglecting the 13
permeate concentration/vapor pressure on the downstream side of the membrane, the permeation 14
of the feed component i across the membrane can thus be governed by: 15
3 1 ) / ( ) ( i i i i i i F F X P dA dF (7) 16where F is the mass flow rate of the feed component i. Rewriting Eqn. (7) into a difference 17
equation gives: 18
3 1 ) ( ) ( ) ( ) ( ) ( ) 1 ( ( ) i i n i n i n i n n i n i F F X P A F F (8) 1The mass fraction of 1-butanol in the feed coming into the divided membrane section (n+1) from 2
the previous section (n) is obtained by: 3
3 1 ) ( ) ( tan 1 ) ( i n i n ol bu n F F X (9) 4All the boundary conditions (F(0), X(0)
i ) of Eqn. (8) are known,
) (n
i
F and X(n)(n=1, 2, 3…, N)
5
can thus be obtained based on Eqns. (8) and (9) by performing iteration. The mass fraction of 6
component i in permeate of sector (n+1) can be calculated by: 7
3 1 ) ( ) ( ) ( ) ( ) 1 ( ) ( ) ( i n i n i n i n i n i F X P F X P Y (10) 8The percentage of membrane area (A(M)) and final recovery (R) of product is defined as follows: 9 % 100 . ) ( 1 ) ( 1 ) (
N n n M n n A A M A (11) 10 ) 0 ( tan 3 , 2 ) ( tan 3 , 2 ediol bu N ediol bu F F R (12) 11where 0M N . The final recovery of product equals the ratio of the flux rate of 2,3-12
butanediol at the membrane inlet and outlet as shown in Eqn. (12). 13
Ethanol Removal, Product Enrichment and Recovery
1
The change of mass flow rate of ethanol, 1-butanol and 2,3-butanediol along with the percentage 2
of the membrane area is illustrated in Fig. 8(a). It is known that ethanol is the most permeable 3
components in the feed, as expected, its flow rate drops most rapidly, and the rapidness is 4
indicated by the slope (K) of the curve: 5 p i i p i i A F F A F K ln 1 (13) 6
According to Eqn. (13), this rapidness refers to the relative flow rate drop with respect to the 7
membrane area. It is shown in Fig. 8(a) that about 80% of ethanol can be removed over the first 8
40% of membrane area, and at this stage 50% of 1-butanol is removed as well, indicating that 9
ethanol is preferentially removed from the feed. The selectivity of the filled membrane during 10
the separation process is shown in Fig. 8(b), it can be seen that due to the preferential permeation 11
of ethanol, the membrane selectivity increases very rapidly at the beginning of the separation, 12
and quickly approaches the “normal” selectivity as the separation goes further. It seems that 13
presence of ethanol in the feed will not cause significant concerns for the processing of 2,3-14
butanediol. 15
The mass fraction variation of the three feed components with respect to the percentage of 16
membrane area is depicted in Fig. 8(c), where the preferential removal of ethanol by the 17
membrane is more clearly demonstrated. It appears that over the first 50% of the membrane area, 18
the product gets enriched slowly because of the presence of bulky 1-butanol, and the product 19
enrichment accelerates over the second half of the membrane area. As the purity of the product 20
reaches the targeted level of 99.5 wt. %, the concentration of ethanol in the feed/product stream 1
can be reduced well below 100 ppm. Therefore ethanol does not pose a challenge for the 2
enrichment of 2,3-butanediol. 3
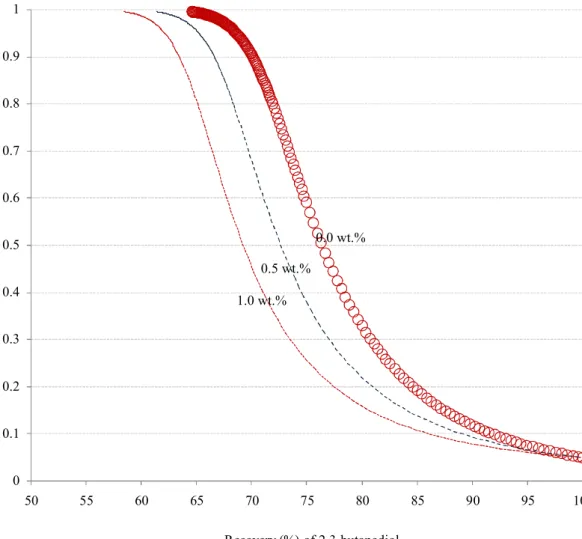
The mass fraction of 2,3-butanediol in the product stream versus its recovery is plotted in Fig. 9, 4
where the content of ethanol appears as the variable parameter (0.0, 0.5, and 1.0 wt.%). Since the 5
membrane is more selective when treating the feed containing a lower ethanol content. For 6
achieving the product at the same purity, the feed containing less ethanol gives a higher product 7
recovery. For the targeted product purity at 99.5 wt. %, the achieved product recovery is 58.4, 8
61.4, and 64.6% when the ethanol content in feed is 0.0, 0.5, and 1.0 wt.% respectively. 9
According to Fig. 9, it appears that the product recovery can be roughly treated as linearly 10
decreasing with the ethanol content. In practice, with proper control, the content of ethanol as a 11
by-product (Yu, et al., 1982) is no more than 1.0 wt. %, e.g., 0.2 wt. %. According to the linear 12
relationship, the loss in the final product recovery is about 1.2%. This is a small loss, and it is 13
clear that by controlling the ethanol concentration in the feed, the efficiency of the separation 14
process is not significantly reduced. 15
CONCLUSIONS 16
ZSM-5 filler was uniformly dispersed in the PDMS membrane matrix. The presence of ethanol 17
in the feed changed the permeation behaviors of all the feed components. This permeation 18
behavior could be interpreted with the coupled transport resulting from the 19
component/component interactions. It was shown that due to the presence of ethanol, membrane 20
selectivity was reduced. However, ethanol is preferentially removed from the feed stream, and 21
the selectivity of the membrane was restored. Numerical simulation of a continuous operation 22
showed that the presence (e.g., 0.2 wt. %) of ethanol reduces the recovery of the product by 1.2%, 1
which was insignificant. 2
ACKNOWLEDGEMENTS 3
The financial supports of AAFC’s Agriculture Bioproduct Innovation Program and NRC’s 4
National Bioproducts Program are gratefully acknowledged. Authors are thankful to Linda 5
Layton for help with some experimental work. 6
REFERENCES 7
Baranowski, B., “ Non-equilibrium thermodynamics as applied to membrane transport (review),” 8
J. Membr. Sci. 57(2-3), 119-159 (1991). 9
Bowen, T.C., R.G. Meier, L.M. Vane, “Stability of MFI zeolite-filled PDMS membranes during 10
pervaporative ethanol recovery from aqueous mixtures containing acetic acid,” J. Membr. Sci. 11
298, 117–125 (2007). 12
Chern, R.T., W. J. Koros, E. S. Sanders, R. Yui, ““Second species” effects in sorption and 13
permeation of gases in glassy polymers,” J. Membr. Sci. 15 , 157−69 (1983). 14
Djoekita, G., “Characterization and analysis of asymmetric hollow fiber membranes for aatural 15
gas purification in the presence of hydrocarbons,” M.S. Thesis, The University of Texas at 16
Austin, Austin, TX, (2000). 17
Funk, E.W., S.S. Kulkarni, A.X. Swamikannu, “Effect of impurities on cellulose acetate 18
membrane performance,” In AIChE Symposium Series; American Institute of Chemical 19
Engineers: Washington, DC, Vol. 250 Recent Advances in Separation Techniques, pp 27−33 1
(1986). 2
Garg, S. A., A. Jain, “Fermentative production of 2,3-butanediol: a review,” Bioresour. Technol. 3
51,103-109 (1995). 4
Huang, R.Y.M., P. Shao, X. Feng, and W. Anderson, “Separation of ethylene glycol aqueous 5
solutions using sulfonated poly(ether ether ketone) (SPEEK) pervaporation membranes: 6
membrane relaxation and separation performance analysis,” Ind. Eng. Chem. Res. 41, 2957-2965 7
(2002). 8
Jansen, N., and G. T. Tsao, “Bioconversion of pentoses to 2,3-butanediol by klebsiella 9
pneumonia laboratory of renewable resources engineering (online book chapter),” Purdue 10
University, West Lafayette, IN 47907, USA, P85-98 (2010). 11
Kuhn, J., R. Stemmer, F. Kapteijn, S. Kjelstrup, J.Gross, “A non-equilibrium thermodynamics 12
approach to model mass and heat transport for water pervaporation through a zeolite 13
membrane,” J. Membr. Sci. 330(1-2) , 388-398(2009). 14
Larson, S.H., F. C. Stormer, “Diacetyl (acetoin) reductase from Aerobacter aerogenes-kinetic 15
mechanism and regulation by acetate of the reversible reduction of acetoin to 2,3-butanediol,” 16
Eur. J. Biochem. 34, 100-106 (1973). 17
Lee, J., “The conversion of 2,3-butandiol to methyl ethyl ketone over zeolites,” PhD thesis, 18
Purdue University, USA, (1999). 19
Maddox, “Microbiol production of 2,3-butanediol,” in Biotechnol. Vol. 6, VCH, Weinhem, 269-20
291(1996). 21
Magee, R. J., N. Kosaric, “The microbial production of 2,3-butanediol,” Adv. Appl. Microbiol. 1
32 , 89-31 (1987). 2
Mas, des C., N.B. Jansen, G.T. Tsao, “Production of optically active 2,3-butanediol by Bacillus 3
Polymyxa, “ Biotechnol. Bioeng. 31, 366-377 (1988). 4
Mazur, W. H., M.C. Chan, “Membranes for natural gas sweetening and CO2enrichment,” Chem.
5
Eng. Prog. 78 , 37−42(1982). 6
Ratcliffe, C.T., A. Diaz, C. Nopasit, G. Munoz, “Application of membranes in CO2separation
7
from natural gas: Pilot plant tests on offshore platforms,” In Proceedings of the Laurance Reid 8
Gas Conditioning Conference, The University of Oklahoma, Norman, OK, pp 117−140 (1999). 9
Shao, P., A. Kumar, “Recovery of 2,3-butanediol from water by a solvent extraction and 10
pervaporation separation scheme,” J. Membr. Sci. 329 (1-2) , 160-168 (2009). 11
Shao, P., A. Kumar, “Separation of 1-butanol/2,3-butanediol using ZSM-5 zeolite-filled 12
polydimethylsiloxane membranes,” J. Membr. Sci. 13
Shao, P., R.Y.M. Huang, X. Feng, W. Anderson, R. Pal, and C.M. Burns, “Composite 14
membranes with an integrated skin layer: preparation, structural characteristics and 15
pervaporation performance,” J. Membr. Sci. 254(1-2), 1-11(2005). 16
Shao, P. R.Y.M. Huang, (Review) Polymeric membrane pervaporation, J. Membr. Sci. 287 , 17
169-172 (2007). 18
Syu, M. J., “ Biological production of 2,3-butanediol,” Appl. Microbiol. Biotechnol. 55, 10-18. 19
Huang, R.Y.M., P. Shao, X. Feng, and C. M. Burns, “Pervaporation separation of 20
water/isopropanol mixture using sulfonated poly(ether ether ketone) (SPEEK) membranes: 1
transport mechanism and separation performance,” J. Membr. Sci. 192(1-2),115-127 (2001). 2
Ui, S., T. Masuda, H. Masuda, H. Kanai, “Mechanism for the formation of 2,3-butanediol 3
stereoisomers in Bacillus polymyxa,” J. Ferm. Technol. 64, 481-486 (1986). 4
Ui, S., T. Hosaka, K. Watanabe, A. Mimura, “Discovery of a new mechanism of 2,3-butanediol 5
stereoisomer formation in Bacillus cereus YUF-4,” J. Ferm. Bioeng. 85, 79-83 (1998). 6
Vu, D.C., W.J. Koros, and S.J. Miller, “Effect of condensable impurity in CO2/CH4 gas feeds on 7
carbon molecular sieve hollow-fiber membrane,” Ind. Eng. Chem. Res. 42(5) , 1064-1075 (2003). 8
Vane, L. M., V. V. Namboodiri, T. C. Bowen, “Hydrophobic zeolite–silicone rubber mixed 9
matrix membranes for ethanol–water separation: Effect of zeolite and silicone component 10
selection on pervaporation performance,” J. Membr. Sci. 308, 230-241 (2008). 11
Vane, L. M., “A review of pervaporation for product recovery from biomass fermentation 12
process,” J. Chem. Technol. Biotechnol. 80, 603-629 (2005). 13
Yu, E. K. C., N. Levitin and J.N. Saddler, “Production of 2,3-butanediol by Klebsiella 14
pneumonia grown on acid hydrolyzed wood hemi-cellulose,” Biotechnol. Lett. 4, 741-746 (1982). 15
Yu, M., J. L. Falconer, R. D. Noble, R. Krishna, “Modeling transient permeation of polar 16
organic mixtures through a MFI zeolite membrane using the Maxwell–Stefan equations,” J. 17 Membr. Sci. 293 (1-2),167-173 (2007). 18 19 20 21
FIGURES CAPTIONS 1
Figure 1. SEM image of the cross-section of the ZSM-5 filled polydimethylsiloxane membrane, 2
the ZSM-5 loading is 44.4 wt. %. 3
Figure 2. Partial fluxes of the filled membrane for 1-butanol, 2, 3-butanediol, ethanol, and water 4
at 50oC.
5
Figure 3. Dependence of the membrane permeability (1-butanol, 2, 3-butanol, ethanol, and water) 6
upon the feed concentration of 1-butanol at 50oC.
7
Figure 4. Three-dimensional representation of the solubility parameters of 1-butanol, 2, 3-8
butanediol, ethanol, water, and PDMS membrane. 9
Figure 5. Selectivity of the filled membrane for water, ethanol, and 1-butanol over 2, 3-10
butanediol at 50oC.
11
Figure 6. Comparison of membrane selectivity evaluated in feeds with and without ethanol (0.92 12
wt. %), respectively, at 50oC.
13
Figure 7. Temperature-dependence of membrane flux (a) and selectivity (b) which were 14
characterized with a feed containing 1-butanol (40.88 wt. %), 2, 3-butanediol (57.80 wt. %), 15
ethanol (0.93 wt. %) and water (0.39 wt. %) from 30 to 80 oC.
16
Figure 8. Variation of mass flow rate (a), and mass fraction (c) of 1-butanol, 2, 3-butanediol and 17
ethanol with respect to the percentage of membrane area, and (b) the selectivity the membrane 18
demonstrated in the course of separation at 50oC.
19
Figure 9. Purity versus recovery of 2,3-butanediol in a continuous operation at 50oC.
20 21
Figure 1: The SEM cross -section view of the ZSM-5 filled polydimethylsiloxane membrane, the ZSM-5 loading is 44.4 wt. % .
0.1 1.0 10.0 100.0 30.0 40.0 50.0 60.0 70.0 80.0 90.0 100.0 1-butanol 2,3-butanediol water ethanol
Feed concentration of 1-butanol (wt.%)
P ar ti al fl ux o f th e m em br an e( g/ m 2.h )
Figure 2: The partial flux of the filled membrane for 1-butanol, 2, 3-butanediol, ethanol and water at 50oC.
1.0E-09 1.0E-08 1.0E-07 1.0E-06 30 40 50 60 70 80 90 100 M em br an e pe rm ea bi lit y (c m 2/s )
Feed concentration of 1-butanol (wt.%)
Species:
water
ethanol
1-butanol
2,3-butanediol
Figure 3: The dependence of the membrane permeability (1-butanol, 2, 3-butanol, ethanol, and water) upon the feed concentration of 1-butanol at 50oC.
Dispersion 0 10 20 30 40 50 60 70 80 90 100 Polar 0 10 20 30 40 50 60 70 80 90 100 Hydrogen bonding 0 10 20 30 40 50 60 70 80 90 100 water 2,3-butanediol 1-butanol ethanol PDMS
Figure 4: The three-dimensional representation of the solubility parameters of 1-butanol, 2, 3-butanediol, ethanol, water, and the PDMS membrane.
0.0 10.0 20.0 30.0 40.0 50.0 60.0 70.0 30.0 40.0 50.0 60.0 70.0 80.0 90.0
α
(water/diol)α
(ethanol/diol)α
(1-butanol/diol)Feed concentration of 1-butanol (wt.%)
M em br an e se le ct iv it y
Figure 5: The selectivity of the filled membrane for water, ethanol, and 1-butanol over 2, 3-butanediol at 50oC.
1.0 10.0 100.0 0.0 10.0 20.0 30.0 40.0 50.0 60.0 70.0 80.0 90.0 100.0 without ethanol with 0.80-0.92 wt.% ethanol
Feed concentration of 1-butanol (wt.%)
M em br an e se le ct iv it y fo r 1-bu ta no l o ve r 2, 3 -b ut an ed io l
Figure 6: The comparison of membrane selectivity evaluated respectively in feeds with and without ethanol (0.80-0.92 wt. %) at 50oC
0.1 1.0 10.0 100.0 2.8 2.9 3.0 3.1 3.2 3.3 3.4 1000/T (K-1) M em br an e fl ux ( g/ m 2.h ) 2,3-butanediol ethanol 1-butanol water
Figure 7(a): The temperature-dependence of membrane flux characterized with a feed of
1-butanol (40.88 wt. %), 2, 3-butanediol (57.80 wt. %), ethanol (0.93 wt. %) and water (0.39 wt. %) from 30 to 80 oC.
3.0 30.0 2.8 2.9 3.0 3.1 3.2 3.3 3.4 1000/T (K-1) M em br an e se le ct iv it y
α
(water/diol)α
(ethanol/diol)α
(1-butanol/diol)Figure 7(b): The temperature-dependence of membrane selectivity characterized with a feed of 1-butanol (40.88 wt. %), 2, 3-butanediol (57.80 wt. %), ethanol (0.93 wt. %) and water (0.39 wt. %) from 30 to 80 oC.
1.0E-04 1.0E-03 1.0E-02 1.0E-01 1.0E+00 1.0E+01 0 10 20 30 40 50 60 70 80 90 100
Percentage of membrane area the feed flows over (%)
F lo w ra te o f t he f ee d c om po ne nt s (g /s ) 1-butanol 2, 3-butanediol ethanol Figure 8(a): Variation of mass flow rate of 1-butanol, 2, 3-butanediol and ethanol with respect to the percentage of membrane area during the separation at 50oC.
1.0 10.0 100.0
0 10 20 30 40 50 60 70 80 90 100
Feed concentration of 1-butanol (wt.%)
M em br an e se le ct iv it y fo r 1-bu ta no l o ve r 2, 3-bu ta ne d io l normal selectivity 0.80-0.92 wt. % ethanol
Figure 8(b): Selectivity of the membrane in the course of separation at 50oC. 1
1.E-04 1.E-03 1.E-02 1.E-01 1.E+00 0 20 40 60 80 100 M as s fr ac ti on o f th e fe ed c om po ne nt s
Percentage of membrane area the feed flows over ethanol
2,3-butanediol
1-butanol
Figure 8(c): The variation of mass fraction of 1-butanol, 2, 3-butanediol and ethanol with respect to the percentage of membrane area during the separation at 50oC.
0 0.1 0.2 0.3 0.4 0.5 0.6 0.7 0.8 0.9 1 50 55 60 65 70 75 80 85 90 95 100 Recovery (%) of 2,3-butanediol M as s fr ac ti on o f 2, 3-bu ta ne di ol in f ee d 0.0 wt.% 0.5 wt.% 1.0 wt.%
Figure 9: The plot of 2, 3-butanediol purity in feed versus the recovery of 2,3-butanediol in a continuous operation at 50oC.
1 2
Table 3
The feed compositions and other parameters involved in the simulation Feeds Temp. (oC) Flowrate (kg/h) Ethanol (wt.%) 1-Butanol (wt.%) 2.3-Butanediol (wt.%) Product (wt.%) I 50 360 0.0 95.0 5.0 99.5 II 50 360 0.5 94.5 5.0 99.5 III 50 360 1.0 94.0 5.0 99.5 1
Tables
Table 1. 1-Butanol-concentration-dependence of the permeabilities of feed components Components Permeability (cm2/s)
1-Butanol P=1.10E-8*EXP(1.93X)a 2, 3-Butanediol P=2.68E-10*EXP(4.23X) Ethanol P=1.39E-8*EXP(2.35X)
Water P=4.29E-8*EXP(1.57X)
aX stands for the mass fraction of 1-butanol in the feed.
Table 2
The permeation activation energy of feed components. Feed component Temperature range
(OC)
Permeation activation energya(Ea)permeation (kJ/mol) Water 30-80 31.8 Ethanol 30-80 42.7 1-Butanol 30-80 33.3 2,3-Butanediol 30-50 36.8 50-80 67.4
a(Ea)permeation (Ea)diffusion (H)dissolution
1 2