Age Differentiation of Rat Smooth Muscle Cells:
Altered Proliferation Profile, Cellular Changes,
and Implications for Atherosclerotic Plaque Destabilization
By
Chen-Wen Huang
Submitted to the Department of Electrical Engineering and Computer Science in Partial Fulfillment of the Requirement for the Degrees of
Bachelor of Science in Electrical Science and Engineering and Master of Engineering in Electrical Engineering and Computer Science
at the Massachusetts Institute of Technology
May7,2004 Lve 20o4 Copyright 2004 Chen-Wen Huang. All rights reserved.
The author hereby grants to M.I.T. permission to reproduce and distribute publicly paper and electronic copies of this thesis
and to grant others the right to do so.
Signature of Author
Dejartment of Electrichl Engineering an omputer Science
Certified by _ Elazer R. Edelman AhesiV 'Supervi'sor Accepted by _ MASSACHUSETTS INSTITUTE OF TECHNOLOGY
JUL 2 0 2004
Arthur C. Smith Chairman, Department Committee on Graduate ThesesAge Differentiation of Rat Smooth Muscle Cells:
Altered Proliferation Profile, Cellular Changes,
and Implications for Atherosclerotic Plaque Destabilization
By
Chen-Wen Huang
Submitted to the Department of Electrical Engineering and Computer Science May 7, 2004
in Partial Fulfillment of the Requirement for the Degrees of Bachelor of Science in Electrical Science and Engineering
and Master of Engineering in Electrical Engineering and Computer Science at the Massachusetts Institute of Technology
ABSTRACT
Clinical evidence has shown that the elderly are at a higher risk for atherosclerotic plaque destabilization. The effect of aging on smooth muscle cells, a major cell type in the plaque, is central to the process of disease development yet is poorly understood. Therefore, we set out to study young and aged smooth muscle cells at the cellular level. Various aspects of differentiation were examined, including proliferation profile and stimulation/inhibition response, FGF receptor production and expression, and MAPK production and activation. We found that the overall cellular production of receptor and MAPK in smooth muscle cells remains unaffected by aging. However, the proliferation response of aged smooth muscle cells was muted in response to stimulation by FGF-2 and inhibition by heparin. This muted response occurred in the aged cells despite their having a higher percentage of receptor-expressing cells and experiencing elevated MAPK activation. We conclude that age-modulated decrease in smooth muscle cell proliferation is caused by downstream cell cycle deficiency. The higher percentage of receptor-expressing cells and the elevated MAPK activation level in aged smooth muscle cells are most likely resulting from a positive feedback mechanism feeding stronger mitogenic signals into the deficient sector of the system, in an attempt to compensate for an age-related decrease in proliferation in agd SMC. This change in proliferation potential, along with cellular damages and dysfunctions, leads to age-modulated differentiation of
Acknowledgement
I would like to thank Professor Elazer Edelman and Dr Frederick Welt for this amazing M.Eng. experience. I am eternally grateful for Elazer's giving me the chance to work on what my heart desires. His patience, guidance, mentorship, and himself as an individual have taught me so much about being a researcher and being an individual. I would also like to thank Fred for giving me the opportunity to work on this project, for the insightful group meetings, and for his endless supply of energy and excitement. If I had to start my M.Eng. over again, there is no doubt that I would do everything I can to be in the Edelman Lab.
I would like to thank Dr Dave Ettenson and Aaron Baker for their help and guidance. I would never make it this far if not for their mentorship and their dedication to what it means to be a scientist. Specifically, I would like to thank Dave for teaching
me everything I needed to know and wanted to know and always being there whenever I wanted to discuss. And I would like to thank Aaron Baker for his booming laughter, his
always asking the hard question to prod my thinking, and his help in Western blotting. I would like to thank Michele Miele and Celia Wolfson for making the Edelman Lab such a great place to conduct research and to be. Their patience and multi-tasking ability never cease to amaze me.
I would like to thank all the physicians who have taken care of me. Without them, my body would still be in a wreck.
I would like to thank my undergraduate friends for the good times and the bad times we share. Fear not, I will find some time to visit everyone. And those of you who are single and want a mate, add
oil-I would like to thank my graduate friends for being such awesome companions, drinking buddies, and positive individuals. Let us hope that we all find the happiness we are looking for and find our place in this world.
I would like to thank MIT for everything it's given me. Half of my time in the States has been spent here, and I know I will miss this place dearly.
I would like to thank the Schaffers for being simply amazing over the years and for staying up with me to finish this thesis. I could not have done this without your energy, support, and editing help.
I would like to thank my family. Those who are alive, we have been through so much together, and nothing I can say can ever convey how much I feel inside. Sisters, remember the peanut theory. I would like to see it in practice. Those who have left this world, I want you to know that this work is dedicated to you.
I would like to thank myself for making it this far. Try to relax more, try to smile more, and try to exercise regularly.
I would like to thank all that is beautiful in this world. Whenever I am down or troubled, please be there so that when I look, I can see that I am not alone.
May 7, 2004 Chen-Wen Huang
In Remembrance of My Father, Ta-Yuan Huang
CONTENT
ABSTRACT 2 CONTENT 6 FIGURES 8 TABLE 9 1.2 1.1 1.2 1.3 1.4 1.5 1.6 2. 2.1 2.2 2.2.1 2.2.2 2.2.3 2.2.4 2.2.5 2.3 2.3.1 2.3.2 2.3.3 2.4 INTRODUCTION 10BACKGROUND AND SIGNIFICANCE 10
CURRENT STATE AND THE PROBLEM WE ARE FACING 11
IMPORTANCE OF AGING 12
CURRENT SHORTFALL 12
THE ROLE OF SMOOTH MUSCLE CELLS 12
SPECIFIC AIMS 12
PROLIFERATION AGE DIFFERENTIATION 15
BACKGROUND
MATERIALS AND METHOD CELL CULTURE
SERUM-LEVEL PROLIFERATION ASSAY
INHIBITION STUDY: HEPARIN DOSAGE RESPONSE
STIMULATION STUDY: FGF-2 DOSAGE RESPONSE WITH PDGF STATISTICAL ANALYSIS
RESULTS
SERUM-LEVEL PROLIFERATION ASSAY
INHIBITION STUDY: HEPARIN DOSAGE RESPONSE
STIMULATION STUDY: FGF-2 DOSAGE RESPONSE WITH PDGF
DISCUSSION
3. RECEPTOR AGE DIFFERENTIATION
3.1 BACKGROUND 15 17 17 17 17 18 18 18 18 22 28 34 37 37
3.4 DiscussioN
4. SIGNAL TRANSDUCTION AGE DIFFERENTIATION
4.1 BACKGROUND
4.2 MATERIALS AND METHOD
4.2.1 WESTERN ON MAPK AND PHOSPHO-MAPK
4.3 RESULTS
4.3.1 WESTERN BLOT FOR P42/P44 MAPK
4.3.2 WESTERN BLOT FOR PHOSPHO-P42/P44 MAPK
4.4 DIscUSSION 5. CONCLUSION REFERENCES 47 47 48 48 48 48 50 53 55 58 45
FIGURES
FIGURE 1.1 ILLUSTRATION OF THE PLAQUE FORMATION PROCESS... 11 FIGURE 1.2 THREE PHASES OF THESIS RESEARCH. ... 13
FIGURE 2.1 YOUNG AND AGED SMC PROLIFERATION RESPONSE TO DIFFERENT SERUM L E V E L S ... 1 9
FIGURE 2.2 YOUNG VS AGED SMC PROLIFERATION DIFFERENTIATION AT 4 DIFFERENT
SERU M LEV EL S ... 2 1 FIGURE 2.3 RATIO OF YOUNG VS AGED SMC PROLIFERATION ... 22 FIGURE 2.4 HEPARIN DOSAGE RESPONSE IN YOUNG AND AGED SMC...23
FIGURE 2.5 HEPARIN DOSAGE RESPONSE IN YOUNG AND AGED SMC ON THE SAME GRAPH.
... 2 5
FIGURE 2.6 AGE-MODULATED DIFFERENTIATION IN RESPONSE TO IEPARIN INHIBITION ON D A Y 8 ... 2 6
FIGURE 2.7 PERCENT SUPPRESSION OF YOUNG AND AGED SMC AS A FUNCTION OF HEPARIN
CONCENTRATION ON DAY8... 27
FIGURE 2.8 FGF-2 DOSAGE RESPONSE IN YOUNG AND AGED SMC ... 29
FIGURE 2.9 FGF-2 DOSAGE RESPONSE IN YOUNG AND AGED SMC ON THE SAME GRAPH... 31 FIGURE 2.10 AGE-MODULATED DIFFERENTIATION IN RESPONSE TO FGF-2 STIMULATION ON
D A Y 8 ... 3 2
FIGURE 2.11 PERCENT STIMULATION OF YOUNG AND AGED SMC AS A FUNCTION OF FGF-2
CON CENTRATION ON DA Y 8...33
FIGURE 3.1 FGF-2 STIMULATION OF PROLIFERATION... 38
FIGURE 3.2 FGF RECEPTOR-I PROTEIN TRANSCRIPTION LEVEL IN YOUNG AND AGED SMC ... 4 1 FIGURE 3.3 FAC S ANALYSIS ON YOUNG AND AGED SMC FOR SURFACE FGF RECEPTOR-I
... 4 4
FIGURE 4.1 WESTERN BLOTS FOR P42/P44 EXPRESSION AS A FUNCTION OF AGE AND FGF-2
STIM ULATION DURATION ... 49 FIGURE 4.2 WESTERN BLOTS FOR PHOSPHO-P42/P44 EXPRESSION AS A FUNCTION OF AGE
AND FGF-2 STIMULATION DURATION... 50
FIGURE 4.3 RATIO OF P42/P44 MAPK ACTIVITY LEVELS BETWEEN YOUNG AND AGED SMC ... 5 1 FIGURE 4.4 FGF-2 STIMULATED FOLD INCREASE OF P42/P44 MAPK ACTIVATION
NORMALIZED TO CONSTITUTIVE ACTIVATION LEVEL PRIOR TO STIMULATION...52 FIGURE 4.5 FGF-2 STIMULATED FOLD INCREASE OF P42/P44 MAPK ACTIVATION
NORMALIZED TO THE 5-MINUTE DATA POINT POST FGF-2 STIMULATION...53 FIGURE 5.1 SYSTEM SCHEMATIC OF CELLULAR EVENTS ASSOCIATED WITH THE EFFECT OF
TABLE
1. Introduction
Vascular diseases affect the full range of arterial beds including the coronary, peripheral, and cerebral circulations. The common pathology of the different vascular beds is atherosclerosis of the affected blood vessels. Unfortunately, current understanding of the mechanism underlying the atherosclerotic process is inadequate for prevention and treatment of these diseases.
1.1 Background and Significance
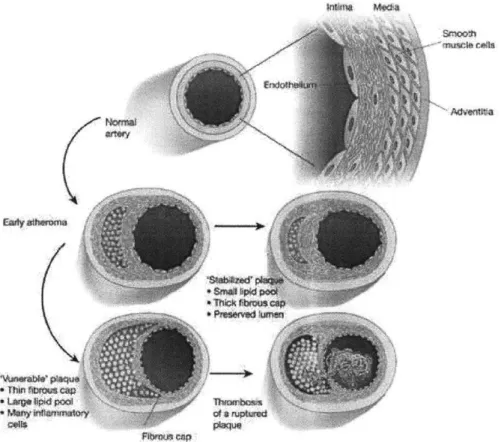
Taken as a whole, atherosclerosis associated diseases are the most common cause of death and can lead to debilitating conditions such as myocardial infarction, heart failure, strokes, and loss of limbs. Atherosclerosis, the root of vascular diseases, is a form of chronic inflammation which starts out with deposition of lipids along the vessel wall early in life, sometimes as early as childhood. Plaques are formed along the vessel wall as a result of the body's inflammatory response to the fatty streaks. This process of plaque formation usually continues as one ages, and the plaque builds up at a variable rate depending on the individual's lifestyle and other risk factors. For instance, individuals with high blood pressure, high cholesterol levels, diabetes, obesity, and frequent exposure to tobacco smoke are especially susceptible to this condition. By middle age, most individuals are usually well under way in the atherosclerotic process and already have raised, lumpy plaque in their blood vessels. By the later stage of the disease, the vessel integrity at the site of the plaque is disrupted and the lesions are fairly heterogeneous on the cellular level, containing endothelial cells, vascular smooth muscle cells, fibroblasts, and macrophages, as well as extracellular lipids and extracellular matrix components. This process of plaque formation, including the end-stage atheroma, is summarized in Figure 1.1. Once the atherosclerotic plaque reaches a critical threshold, it can obstruct blood flow in part or even completely if it ruptures. At this point, blood clots can form and break off, restricting or blocking the blood flow to vital parts of the body and thus placing patients in danger of stroke or myocardial infarction. Interventions must then be made to ensure the safety and well-being of the patients.
a ccapThin ribfbi
WoaJy ikft s~gtoq itrm
plaque
Figure 1.1 Illustration of the plaque formation process. The evolution of the lesion is a silent process.
Early during the atheroma, inflammatory cell recruitment and lipid accumulation lead to a lipid core capped
by layers of smooth muscle cells. Aging usually witnesses the growth of the lipid core and the thinning of
the fibrous cap, rendering it friable and susceptible to rupture. Copied from [1] with minor modification.
1.2 Current State and the Problem We Are Facing
Currently, percutaneous interventions such as angioplasty and the employment of metal stents are the most commonly prescribed form of treatment and have been met with great success. With advancement in disease understanding and medical treatment, the
death rate from cardiovascular disease has been declining over the past decade. However, statistics from the American Heart Association (AHA) show that morbidity falls heavily on the elderly: about 84 percent of cardiovascular disease deaths occur in people age 65 and older. This is due in part to the decades it takes for the clinical
manifestation to appear in a patient, even though the atherosclerotic process starts early in life. Additionally, the elderly are the fastest-growing sector of the population according to the Census. Combining the severity of the disease in the elderly with a growing
elderly population presents the society with the challenging long-term goal of decreasing overall vascular mortality in a sizeable aging population.
1.3 Importance of Aging
This challenge centers on the issue of aging, specifically its correlation to the observed frequency and severity of the disease. Multivariate analysis has demonstrated that aging is a risk factor for atherosclerosis, independent of cholesterol, blood pressure, diabetes, obesity, or smoking (AHA). For instance, studies have shown that older animals are more vulnerable and responsive toward vascular injuries [2-4]. And well-documented observations of physiological changes in the vascular system associated with aging have also been identified as potentially related to the accelerated atherosclerotic process in the aged [5].
1.4 Current Shortfall
We have witnessed encouraging advancement in therapies targeting prevention and early intervention of other non-aging risk factors such as elevated cholesterol level, high blood pressure, diabetes, obesity, and smoking. However, therapies targeting age-related mechanisms that accelerate the atherosclerotic process are lacking and ineffective in comparison, because the molecular and cellular events linking age to the process of atherosclerotic lesion formation are not as well understood.
1.5 The Role of Smooth Muscle Cells
Based on observation of the proliferation of increased smooth muscle cells (SMC) in reaction to mechanical injury mimicking percutaneous intervention, it was initially hypothesized that SMC proliferation, and thus the number of SMC in the lesion, is the primary determining factor in the progression of the disease [6, 7]. Although this
phenomenon of SMC proliferation is generally agreed to contribute to the early formation of atherosclerotic lesions, several independent sources have reported that the sites of plaque destabilization and rupture typically contain fewer SMC [8-10]. Consequently, it is now generally accepted that early in the lifetime of a lesion, SMC actually protect the
stability of the lesion by reinforcing the fibrous cap. (See Figure 1.1) Later on, a paucity of SMC in lesions leads to the detrimental stage of disease where thin and otherwise unstable fibrous caps increase the risk of rupture [11]. According to this theory, SMC proliferation caused by vascular injury is one of the key factors for early atherosclerotic plaque formation. Further, the decline in the ability of SMC to proliferation during later
stages of the disease is linked with the adverse process of plaque destabilization
commonly seen in the elderly [12]. Taken in aggregate, age-modulated change of SMC content in the plaques and age-related increase in the risk of atherosclerosis support examining the effect of aging on SMC proliferation and on reaction to environmental
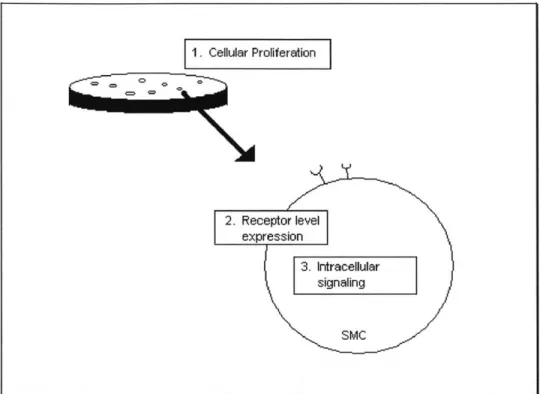
signal transduction. (See Figure 1.2). The rationale behind the order of studies consists of not only the natural order of events when SMC interact with environmental cues, but also a progressively focused scheme going from a macroscopic to a microscopic study on the issue of cellular aging in SMC.
Figure 1.2 Three phases of thesis research.
Ultimately, the issue centers on the phenomenon of the various forms of age differentiation in SMC on different levels. Specifically, this the sis tested the following hypotheses:
1) PROLIFERATION: Aged smooth muscle cells proliferate at a slower rate than young SMC, and have a muted response to environmental stimulatory and inhibitory cues.
2) RECEPTOR: Age- modulated FGF receptor-I down-regulation contributes to the age-modulated decrease in proliferation by affecting the ability of aged SMC to react to FGF-2 stimulation.
3) SIGNAL TRANSDUCTION: The difference in the level of activation of p42/p44 between young and aged SMC is responsible for the age-modulated decrease in proliferation.
To simplify the evaluation of a complex biological environment, this thesis sought to examine SMC in isolation. By looking at the very fundamental changes modulated by
aging in the setting of a tightly controlled environment, this research attempted to shed 1. Cellular Proliferation 2. Receptor level expression 3. Intracellular signaling SMC
light on the molecular and cellular events linking the effects of aging to SMC in particular and to the overall process of atherosclerosis at large.
2. Proliferation Age Differentiation
2.1 Background
Hypothesis: Aged smooth muscle cells (SMC) proliferate at a slower rate than young
SMC, and have a muted response to environmental stimulatory and inhibitory cues. Even though more recent publications and histological data have begun to show the lack of SMC proliferation in the progression and destabilization of advanced stage atherosclerotic lesions [8-10], there was a time when the opposite was suggested to be true. It was believed for many years that SMC proliferation was key to atherosclerotic lesion progression, and that this proliferation contributed to the increased instances of vascular events in the elderly. This association of increased vascular events in the elderly with increased SMC proliferation was supported by animal and tissue-culture
experiments.
Animal studies have shown SMC proliferation to increase after controlled vascular injury in aged animals relative to younger animals [6]. However, it was soon realized that even though the observations from these studies provide invaluable information about injury response, they couldn't be taken to be true for the entire life cycle of atherosclerotic lesions. And in fact, current histological data indicate that it is the lack of SMC proliferation, instead of increased proliferation, that characterizes the progression and destabilization of advanced stage atherosclerotic lesions which are clinically manifested predominantly in the elderly [8-11].
Even though some earlier tissue-culture studies suggested an age-related increase in SMC proliferation, a thorough examination of studies conducted thus far on comparing aged to young SMC actually yielded opposing opinions on the effect of aging on SMC in the context of proliferation and atherosclerotic implications. On one hand, SMC derived from aged Fischer 344 rats from the National Institute of Aging (NIA) seem to show a general elevated proliferation capability relative to the young counterpart [13, 14], although it should be noted that not all rats display this behavior [15, 16]. On the other hand, SMC derived from humans and histological data collected from humans generally concur on an age-related decrease in SMC proliferation capability [17]. Data collected from mice SMC also display behavior similar to human SMC [12].
Specifically, the data reported by Ruiz-Torres et al. give strong support for age-dependent decrease in SMC activity. From the tissue-culture study of vascular SMC isolated from human subjects, this group reported an age-related decline in the cells' proliferation and migration ability, measured in proliferation rate and migration assay. Regression on the data collected showed that the expected age when little or no proliferation would be expected in SMC actually coincides with the current limit of human lifespan. They concluded that the age-related decline in SMC activity might be part of the biological aging phenotype [17, 18]. Liu et al., using cavernous SMC isolated from 4-week, 1 1-week, and 28-month old rats, also observed the lowest proliferation and
migration rate in the 28-month old rats [15]. Moon et al., using SMC isolated from aged mice, reported decreased proliferation capacity as well [12]. The observations reported by these groups are fairly clear in their consensus, and it is especially reassuring to note that the age-related decrease in SMC proliferation and migration ability is reported across different species: humans, rats, and mice.
In opposition to the above is the set of observations supporting an age-related increase in SMC activity [13, 14]. McCaffrey et al. reported age-related increase in the proliferation of rat SMC, along with the interesting observation that, in the presence of heparin, the proliferation level of aged SMC is reduced to the level of young SMC [14]. Li et al.1 also reported increased proliferation and migration rate in aged rat SMC, along with changes in cell size and cytoskeletal proteins [13]. What is important to note at this point is that both of those groups used SMC isolated from male Fischer 344 rats from the NIA. As such the data supporting the argument for an age-related increase seem a little weak compared to the argument for an age-related decrease.
If one were to set aside the above contradiction for now, then taken in aggregate, previous studies would indicate the existence of age-related physiological changes in
SMC, something akin to an age phenotype with distinct proliferation profile. However, since SMC derived from humans generally concur on age-related decrease in SMC proliferation capability [17], since data collected from mice SMC also display behavior similar to human SMC, and since publications and histological data have shown the lack of SMC proliferation in the progression and destabilization of advanced stage atherosclerotic lesions, we decided to test the hypothesis that aged SMC proliferate at a slower rate than young SMC and have a muted response to environmental stimulatory and inhibitory cues.
Closely tied to this hypothesis is the clinical observation showing elderly as actually more susceptible to atheroma development and displaying reduced vascular repair. Together with age-related loss of proliferation capability, this actually suggests a puzzle linking the empirical observation of decreased proliferation ability and increased atheroma in the elderly, possibly involving a complex network of interaction involving age-dependent receptor trafficking, signal transduction, and cell cycle regulation. Chapter Two and Chapter Three will address the issue of age differentiation on the level of cell receptor and intracellular signal transduction. But first, the phenomenon of age-modulated cellular proliferation must be explored in detail.
Specifically, this chapter sought to first validate this age-related change in
proliferation. In addition, this chapter also sought to examine, side by side, the aged and young SMCs' ability to react to stimulatory and inhibitory cues.
2.2 Materials and Method
2.2.1 Cell CultureTo investigate the potential age differentiation of the proliferation potential, SMC derived from the aorta of young (2 month) and aged (30 month) Brown Norway Rats from the National Institute of Aging were used for this thesis research. All cells were confirmed for smooth muscle identity by indirect immunofluorescence staining with anti-alpha SMC actin antibody.
Cells were maintained in Dulbecco's Modified Engle Media (DMEM) containing 100 units per milliliter of penicillin, 100 ug/ml of streptomycin (Invitrogen, Carlsbad, CA), and 10% fetal bovine serum (FBS) (Hyclone, Logan, Utah), here after referred to as growth media. Cell cultures were maintained undisturbed in a humidified environment of an incubator at 37'C with 10% CO2. The cell line was continued with change of medium
every two to three days and passaged periodically. All cells used in experiments were from passage 3 to passage 7.
2.2.2 Serum-level Proliferation Assay
Serum-level proliferation assays were conducted in 12-well tissue culture plates (BD Biosciences, San Jose, CA). After plating, cells were incubated in growth media for 3 days, followed by starvation in 0.1% FBS media for 2 days. Seeding density of young and aged SMC were adjusted such that, at the end of the starvation period, cell density was comparable in the two groups. At the end of the starvation period, referred to as day
0, starvation media was removed, and cells were changed into the appropriate serum-level groups: 1%, 5%, 10%, and 20% FBS in DMEM. Cell counts were performed on days 0, 3, 5, 7, and 9. Media was changed once during the assay on day 5. On the day of cell counting, cells were trypsinized after physiological balance solution (PBS) rinsing, and cell numbers were determined using a Coulter Counter (Beckmen Coulter, Fullerton, CA). Triplicate samples were obtained for each data point on each day at each serum level, for young and aged SMC alike.
2.2.3 Inhibition Study: Heparin Dosage Response
Heparin dosage response was conducted in 6-well tissue culture plates (Falcon). Cells were seeded at a density of 30,000 cells/well. After plating, cells were incubated in growth media for 1 day, followed by starvation in 0.1% FBS media for 1 day. At the end of the starvation period, referred to as day 0, starvation media was removed, and cells were either changed into control group of 10% FBS in DMEM or into the appropriate treatment groups with the following heparin concentrations: 0.1, 1, 10, 50, and 100 ug/ml in 10% FBS in DMEM. Cell counts were performed on days 0, 3, 5, and 8. Media was changed once during the assay on day 4. On the day of cell counting, cells were
trypsinized after rinsing with physiological balance solution (PBS), and cell numbers were determined using a Coulter Counter. Triplicate samples were obtained for each data point on each day at each serum level, for young and aged SMC alike.
2.2.4 Stimulation Study: FGF-2 Dosage Response with PDGF
Fibroblast growth factor-2 (FGF-2) dose response was conducted in 6-well tissue culture plates (Falcon). Cells were seeded at a density of 15,000 cells/well. After plating, cells were incubated in growth media for 1 day, followed by starvation in 0.1% FBS media for 1 day. At the end of the starvation period, referred to as day 0, starvation media was removed, and cells were either changed into control group of 1% FBS in DMEM or changed into the appropriate treatment groups at the following growth factor concentrations: 5, 10, 20, and 50 ng/ml of FGF-2, and 10 ng/ml of platelet-derived growth factor (PDGF) in 1% FBS in DMEM. Cell counts were performed on day 0, 3, 5,
and 8. Media was changed once during the assay on day 4. On the day of cell counting, cells were trypsinized after rinsing with physiological balance solution (PBS), and cell numbers were determined using a Coulter Counter. Triplicate samples were obtained for each data point on each day at each serum level, for young and aged SMC alike.
2.2.5 Statistical Analysis
Student's t-test with Bonferroni adjustment was employed to ensure against falsely significant differentiation between the young and aged SMC, using alpha of 0.05 before the adjustment.
2.3 Results
2.3.1 Serum-level Proliferation Assay: impaired proliferation capability observed in SMC isolated from aged rats under different serum conditions.
To measure and compare the proliferation potential of young and aged SMC, proliferation rate, measured as the number of cells per well, was tracked as a function of serum levels over the span of 9 days.
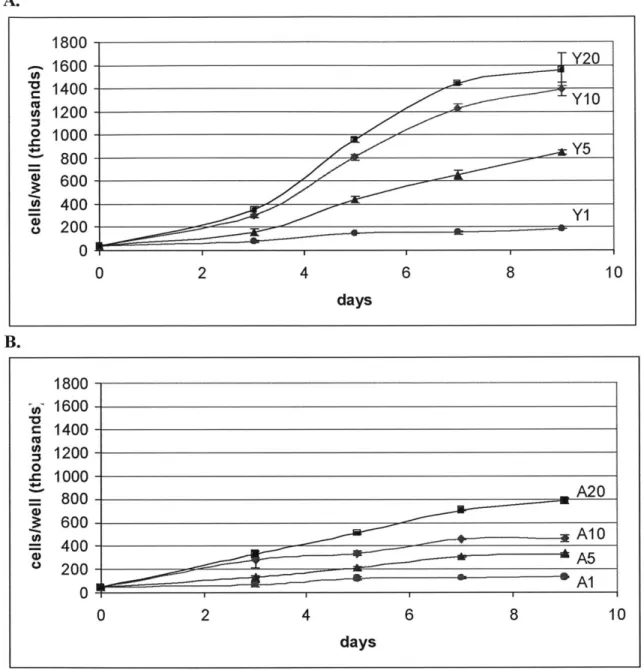
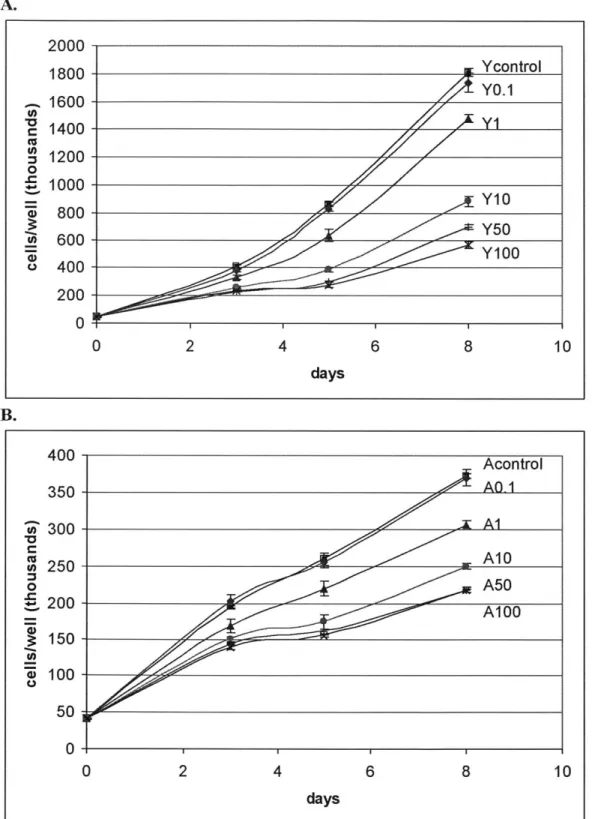
A. 1800 1600 Y20 1400Y 1200 1 Y5 100Y1 800 600 400 200 0 2 4 8 10 days 1800-- 1600- 1400-10A A 0 6~ 00 A10A 800-2 00- I 0 40 - A 0 2 4 6 8 10 days
Figure 2.1 Young and Aged SMC proliferation response to different serum levels. Both graphs are plotted
on the same vertical scale for clearer illustration of impaired proliferation capability in SMC isolated from aged rats. Data points are presented as mean + SD of triplicate samples. A: Proliferation profile of young SMC showing serum stimulation of proliferation. In the data labels, "Y" designates young rats while the
number designates the serum level in percent. (p <0.04 for comparison between different serum levels, with the exception of day 9's Y1O and Y20) B: Proliferation profile of aged SMC showing serum stimulation of proliferation. In the data labels, "A" designates aged rats while the number designates the serum level. (p < 0.01 for comparison between different serum level, with the exception of day 3's A10 and A20).
The growth assay for young SMC as a function of different serum levels shows a classic exponential proliferation profile for serum levels of 5%, 10%, and 20%. (See Figure 2. 1A). Additional serum led to more proliferation on any given day, for the range of serum levels administered. Additionally, increasing the serum level from 1% to 5%
led to a considerable increase in proliferation, which is also true for increasing the serum level from 5% to 10%. However, going from 10% to 20% led to diminishing increase in proliferation, indicating the beginning of saturation of the serum's ability to stimulate additional proliferation in young SMC.
The growth assay for aged SMC as a function of the same serum levels shows a more subdued and linear proliferation profile. (See Figure 2.1B). The classic
exponential growth pattern is not observed. Like young SMC, more serum level led to more proliferation. However, unlike young SMC, the growth curve of aged SMC at 20% serum level showed no hint of saturation yet.
The null hypothesis for our statistical analysis was that young and aged SMC proliferated at the same rate, which would lead to comparable cell count. On any given day when cells were counted, any pairs of data points were evaluated for significant comparison. By day 3 and onward, aged-modulated decrease in proliferation ability was shown to be statistically significant, supporting the hypothesis of an age-modulated decrease in proliferation in SMC, with the exception of day 3's A10 and A20 and day 9's YIO and Y20.
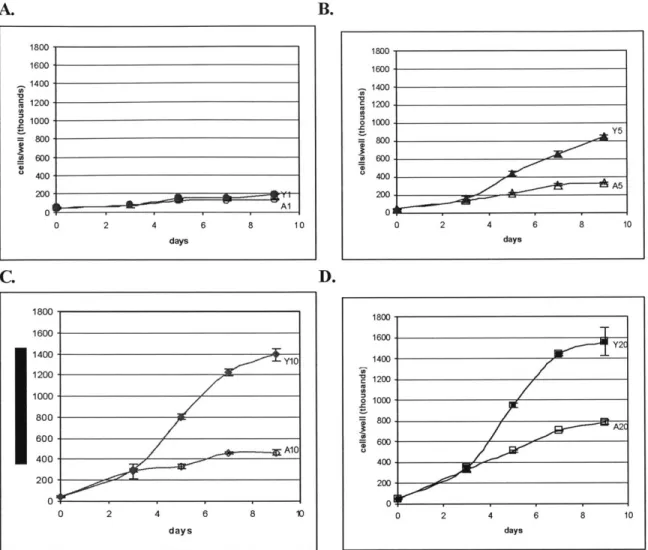
B. 1800. 1600-1400 1200 1000 800 600 400- 200-0 Al 2 4 6 8 days 10 0 1800, 1600- 1400-1200. 1000 800 600 400 200 01 0 2 A5 4 6 8 10 days D. 1800- 1600-1400Y 1200-Y 1000- 800-600 400 --- 1 200 0 0 2 4 6 8 10 days 0 1800 1600 Y2T Y2 1400- 1200-1000 800. 2 400- 200-0 0 2 4 6 8 10 days
Figure 2.2 Young vs Aged SMC proliferation differentiation at 4 different serum levels. Impaired
proliferation capability was observed in SMC isolated from aged rats. All four graphs are plotted on the same vertical scale as Figure 2.1 for clearer illustration. In the data labels, "Y" designates young rats, "A" designates aged rats, and the number designates the serum level. Data points are presented as mean ± SD of triplicate samples. A: Proliferation differentiation at 1% serum. B: Proliferation differentiation at 5%
serum. C: Proliferation differentiation at 10% serum. D: Proliferation differentiation at 20% serum.
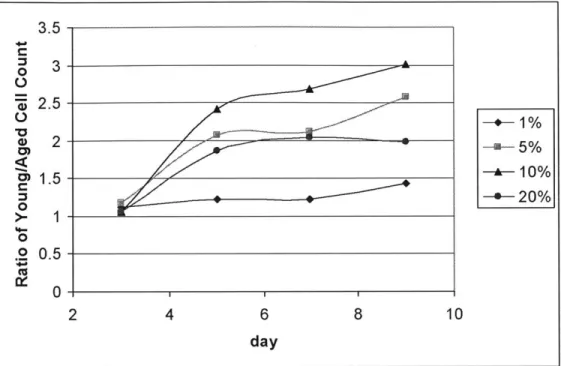
The four graphs of young versus aged SMC proliferation differentiation present the data in a way which accentuates the difference in proliferation rate between young and aged SMC at each of the four serum levels. (See Figure 2.2). The four graphs share a common vertical scale for the purpose of clear comparison. Clearly, aged SMC always proliferate at a slower rate than that of young SMC, as indicated by the decrease of proliferation capability in aged SMC relative to the young for all serum levels after day 3. Having established this age-differentiation in proliferation rate, Figure 2.3 summarizes how much more proliferative young SMC were relative to aged SMC on each of the days when samples were counted, at the different serum levels. Age-modulated differentiation was not obvious on day 3. 10% serum witnessed the most drastic fold difference between young and aged SMC proliferation, reaching as high as a 3-fold increase in young SMC by day 9. 20% serum, on the other hand, witnessed not as drastic a fold difference, which
A.
0
C.
I
is largely attributed to the fact that young SMC are reaching the limit of how fast they can proliferate at this serum concentration.
3.5 0 3 "W' 2.5-2. -+1% 2- -a-5% --- 10% 3 -*-20% 1 0 0 .2 05 -(U 0 -2 4 6 8 10 day
Figure 2.3 Ratio of young vs aged SMC proliferation. Each young and aged SMC data pair were divided
to yield this representation of fold increase in young SMC proliferation at each of the serum levels administered on each date.
The above clearly illustrates that, for the same serum level, aged SMC is much less responsive than its young counterpart in terms of proliferation capability in reaction to serum stimulation. Having established differential proliferation profiles for aged and young SMC, the next question of interest is to explore whether there exists an age-dependent difference in the ability of SMC to react to anti-proliferative and proliferative agents.
2.3.2 Inhibition Study: Heparin Dosage Response: aged SMC are less responsive than young SMC to heparin inhibition, suggesting age-modulation of the ability of SMC to ability to react to anti-proliferative agents.
Heparin is a gold-standard inhibitor of vascular SMC and we used heparin to answer the question of whether the anti-proliferative effect of growth inhibitors on SMC also experience a decrease as SMC ages. We compared the heparin dosage response between young and aged SMC and explored the question of potential age-modulated heparin reactivity. Do aged SMC experience relatively less heparin inhibition of
inhibition over time for young and aged SMC with different heparin concentrations. Because young and aged SMC grow at a different rate with the control of 10% serum, as
shown previously, a different vertical scale is used for clearer illustration. A. C 'U 0 0 0 a) 0. 2000 1800 1600 1400 1200 1000 800 600 400 200 0 0 2 4 6 8 10 days B. 400 350 300 C o250 0 ~200 150 z 100 50 0 0 2 4 6 8 10
[
daysFigure 2.4 Heparin dosage response in young and aged SMC. The dosage responses of young and aged SMC track inhibition of proliferation rate relative to heparin-free control as a function of different heparin
: Ycontrol Y0.1 Y10 Y50 Acontrol AQ-1 A1 A10 A50 Al 00
level in the media over a period of 8 days. Data points are presented as mean ± SD of triplicate samples. Note that the two graphs are plotted on a different vertical scale due to age-modulated decrease in the proliferation rate of aged SMC. A: Heparin inhibition of young SMC and the effect of different dosage. In the data labels, "Y" designates young rats while the number designates heparin concentration in ug/ml. (P < 0.05, with the exception of day 3's Y50 and Y100 and day 8's Ycontrol and YO.1) B: Heparin inhibition of aged SMC and the effect of different dosage. In the data labels, "A" designates aged rats while the number designates heparin concentration in ug/ml. (Acontrol and AO. 1 are not significantly different. P <0.05, with the exception of day 8's A50 and A100).
One must first establish that heparin does cause inhibition in young and aged SMC, proving that the difference in cell count observed is not random. Student's t-test with Bonferroni adjustment for multiple comparisons was conducted and reported in the Figure caption. In general, the inhibitory effect of heparin is visible by day 3 in both aged and young SMC; there is no apparent age-modulated delay in the growth pattern observed, indicating the young and aged SMC react to heparin inhibition similarly from the temporal perspective.
Heparin inhibits young SMC proliferation for the range of heparin concentrations administered, with higher concentration causing greater inhibition. (See Figure 2.4A). Statistical analysis has shown these differences modulated by heparin concentration to be significant, with the exception of day 3's Y50 and Y100 pair and day 8's Ycontrol and
YO.1 pair.
Heparin also inhibits aged SMC proliferation, with higher concentration causing greater inhibition. (See Figure 2.4B). Analysis showed significant difference between the proliferation curve of each heparin level in young and aged SMC. However, the difference between Acontrol and AO. 1 is not statistically significant on days 3, 5, and 8 when cells were counted. Day 8's A50 and A100 pair of comparison also yielded an insignificant difference.
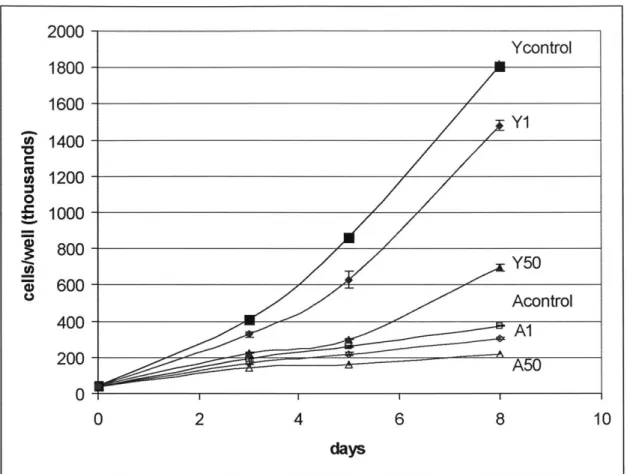
2000-Ycontrol 1800- 1600-Y 1 1400-1200 0 E 1000- S800-000 Y50 400 Acontrol A1 200 - --- ~ 5 0 0 2 4 6 8 10 days
Figure 2.5 Heparin dosage response in young and aged SMC on the same graph. Heparin levels selected from Figures 2.4A and 2.4B were plotted on the same vertical scale. Data points are presented as mean+
SD of triplicate samples.
For a comparison of the effect of aging on the heparin dosage response of SMC, Figure 2.5 shows both young and aged SMC dosage response on the same graph for selected levels of heparin. The difference in proliferation rate is clearly demonstrated.
At this point, it should be noted that young SMC display an exponential growth pattern
while aged SMC grows much more linear in nature, again affirming the observations made in the serum-level growth assay. Figure 2.5 also indicates the possibility that the inhibitory effect of heparin is more pronounced in young SMC than in aged SMC,
coinciding with what we hypothesized. To examine this possibility of whether heparin
leads to greater inhibition in young SMC, the cell counts on day 8 were normalized to the
corresponding heparin-free control for a comparison of the extent of inhibition
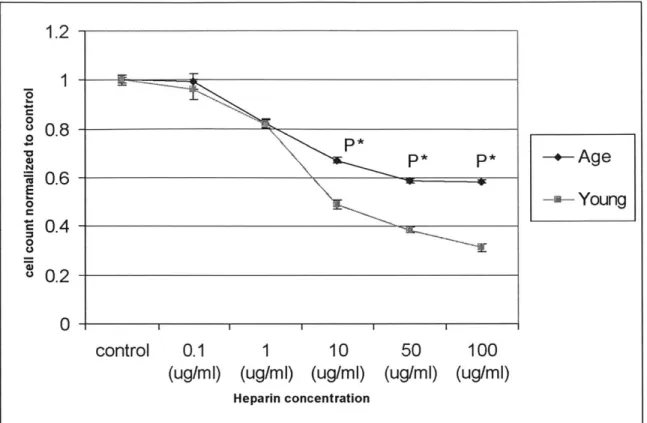
1.2 0 u 0.8 0 P* P*-Age nr0.6 -0 2ieiYoung C ~0.4 -0 S0.2 control 0.1 1 10 50 100 (ug/mi) (ug/mi) (ug/mi) (ug/mi) (ug/mi)
Heparin concentration
Figure 2.6 Age-modulated differentiation in the extent of heparin inhibition on day 8. Young SMC can be
inhibited to a greater extent than aged SMC. Cell counts at difference heparin concentration were
normalized to the corresponding heparin -free control for a comparison of the inhibitory effect of heparin on
young and aged SMC. p* indicates very highly significant.
As hypothesized originally, there is significant age modulation of the reaction of SMC to heparin inhibition. After normalization to the respective control, heparin causes inhibition of proliferation to a greater extent in young SMC than in aged SMC. Statistical analysis on the difference in heparin's ability to inhibit proliferation on young and aged SMC has proven to be significant at concentrations of 1 Oug/ml and higher. In short, the inhibitory effect of heparin is more pronounced in young SMC than in aged SMC for heparin levels of 10 ug/ml and higher.
Having established the existence of a muted reaction to heparin inhibition related to aging, the next logical step was to examine whether the incremental inhibitory effect of heparin within the two age groups is also modulated by age. Stated differently, we have established that a heparin concentration of 50 ug/ml led to greater inhibitory effect in young SMC, but is there also an age-modulated decrease in the incremental inhibition caused by raising the heparin concentration of 50 ug/ml to 100 ug/ml? Is the incremental inhibition not as pronounced in aged SMC when going from 50 ug/ml to 100ug/ml of
By day 8, a heparin level of 0.1 ug/ml did not lead to significant incremental inhibition of proliferation compared to heparin-free control, in young and aged SMC. However, looking at high levels of heparin, concentrations higher than 50 ng/ml did not
lead to additional inhibition in aged SMC, suggestion that heparin saturation has been reached at around 50 ng/ml in aged SMC. Young SMC, on the other hand, don't seem to be operating in the saturating region even for heparin levels as high as 100 ng/ml. In fact, there was no sign of saturation observed.
The result of the heparin-inhibition study on young and aged SMC is best summarized in Figure 2.7, for it clearly illustrates both the extent to which SMC can be inhibited by heparin as a function of age and the level of incremental inhibition as heparin concentration goes up.
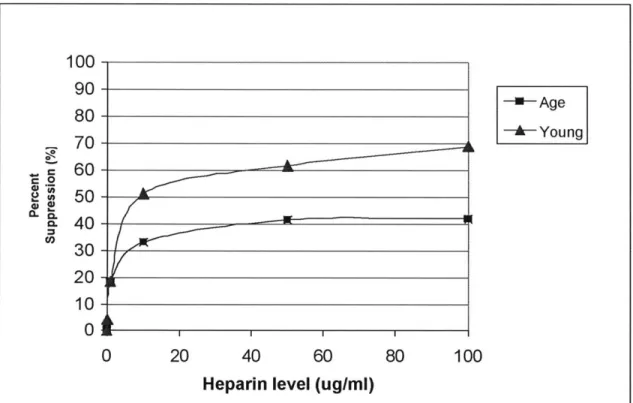
100 90-80-U-Age 80-,0-Young 40- 60-2 50-30 20- 10-0 AM 0 20 40 60 80 100
Heparin level (ug/ml)
Figure 2.7 Percent suppression of young and aged SMC as a function of heparin concentration on day 8.
This graph is constructed by the following formula applied to the data points from day 8: 100*(control cell count - treatment cell count)/control cell count. The more inhibition there is by heparin, the higher the percent of suppression. For example, a suppression of 70% at concentration X means 70% of the cell proliferation in control is suppressed by heparin level of X ug/ml, and the cell count is only 30% of the control cell count.
By taking the difference between control and heparin- inhibited cell count and then normalizing this difference to control, Figure 2.7 is able to present the
age-modulation inhibitory effect of different levels of heparin on young and aged SMC in a very insightful fashion. Two valuable pieces of information can be gained from this graph, one having to do with the degree to which proliferation can be inhibited, the other having to do with whether saturation effect is present. First, heparin inhibition of SMC
proliferation is always more pronounced in young SMC than aged SMC, suggesting aged SMC experiences muted reaction toward inhibition by heparin. In fact, heparin inhibition of aged SMC approaches an asymptotic level where at most 40% of control can be
inhibited, and any additional heparin would not lead to further inhibition. However, heparin inhibition of young SMC can lead to as high as 70% of control being inhibited, possibly higher. Second, at heparin levels higher than 50 ug/ml there is no additional inhibition in aged SMC, for saturation has been reached at around 50 ug/ml. Young
SMC, on the other hand, do not seem to be operating in the saturating region even for heparin levels as high as 100 ug/ml. This differentiation between young and aged SMC suggests an age-related change in saturation of inhibitory cue, where aged SMC actually experience inhibition saturation at a much lower heparin concentration than do young
SMC.
2.3.3 Stimulation Study: FGF-2 Dosage Response: aged SMC are less responsive than young SMC to FGF-2 stimulation of proliferation, suggesting age-modulation of the ability of SMC to react to mitogenic agents.
Having shown an age-modulated decrease in the ability of SMC to react to environmental inhibitory cues, the parallel question asked was, whether the mitogenic effect of growth factor on SMC also experiences age-modulated decreases. These sets of experiments are set up to compare the response to FGF-2 dosage between young and aged SMC and to explore the question of potential age-modulated mitogen-reactivity. Do aged SMC experience less FGF-2 stimulation of proliferation?
Because the assay is aimed at examining the issue of stimulation, a control serum level of 1% FBS was chosen based on the results of the serum-level growth assay. A range of FGF-2 concentration was administered. Platelet-derived growth factor (PDGF) at a concentration of 10 ug/ml was also administered along with the different levels of FGF-2. Figure 2.8 presents the results of growth factor stimulation over time for young and aged SMC. Because young and aged SMC grow at a different rate in 1% serum as shown previously in Figure 2.2A, different vertical scales were used for clearer
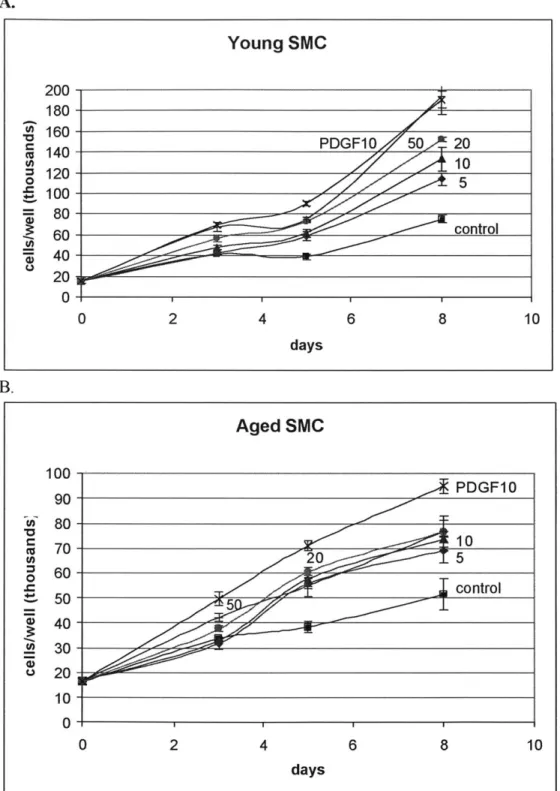
A. Young SMC 200-180 O u 160-PDGF10 50 20 1401 -10 120-5 0 5oto S100- 80-60-cotl 20-0 0 2 4 6 8 10 days B. Aged SMC 100-PDGF10 90~ u) 80-10 70 S20 5 o 60 control ~50- 51 40-U) 30- u20- 1 0-0 2 4 6 8 10 days
Figure 2.8 FGF-2 dosage response in young and aged SMC. These two dosage responses track
stimulation of proliferation rate relative to growth factor-free control as a function of different FGF-2 level in the media over a period of 8 days. PDGF level of 10 ug/ml is also administered along with the different levels of FGF -2. Data points are presented as mean ± SD of triplicate samples. Note that the two graphs are plotted on different vertical scales due age-modulated decrease in the proliferation rate of aged SMC. Curves are labeled by FGF-2 level in ng/ml, with the exception of control, which has no growth factor, and
0.03 for comparison between all pairs of dosage) B: Stimulation in aged SMC at different dosages (day 8: p <0.01 for comparison between aged control and aged PDGF 10 and comparison between aged control and
any of the aged FGF-2 dosages. However, no significant differentiation exists amongst the different FGF -2 dosages.
First, one must establish whether FGF-2 and PDGF cause proliferation in young and aged SMC, proving that the difference observed in the cell count is not random. Student's t-test with Bonferroni adjustment for multiple comparisons was conducted and reported in the figure caption. In general, the stimulatory effect was visible by day 3 in both aged and young SMC; there was no apparent age-modulated delay in the temporal growth pattern observed, indicating that the young and aged SMC react to stimulation at
a similar rate in the temporal perspective.
10 ng/ml of PDGF simulated both young and aged SMC proliferation, but to different degrees. (See Figure 2.8). By day 8, the cell count of young SMC was twice that of the aged SMC in this treatment category.
As for the stimulatory effect of the different FGF-2 concentrations, a clear pattern emerged by day 8. On day 8, young SMC demonstrated distinct and significant levels of proliferation for the different amount of FGF-2 added. This validated that FGF-2 does
stimulate cellular proliferation in young SMC, and the range of FGF-2 administered resulted in levels of proliferation significantly different from each other.
As for aged SMC on day 8, the presence of FGF-2 also led to stimulation of proliferation that is significant compared to aged control on day 8, validating that FGF-2
does indeed stimulate cellular proliferation in aged SMC also. However, in aged SMC, FGF-2 level between 5 ng/ml and 50 ng/ml yielded cell count values in the same
neighborhood on day 8; statistical analysis showed no significant differences in cell count among these dosage levels.
Comparing this observation in aged SMC to that of the young suggests that aged SMC either has decreased ability to detect the different levels of FGF-2 stimulation in the environment, or has decreased ability to translate this difference into different levels of proliferation in actuality.
180 160 140- Y20 10 U) 120 C9 80 A5 ~60-W y roAcontroI 40-20 0 0 2 4 6 8 10 days
Figure 2.9 FGF-2 dosage response in young and aged SMC on the same graph. FGF-2 levels were
selected from Figure 2.8A and 2.8B and plotted on the same vertical scale.
For comparing the effect of aging on the ability of SMC to react to FGF-2 stimulation, Figure 2.9 shows both young and aged SMC dosage response on the same graph, for selected concentrations of FGF-2. By comparing the data points in day 8, this figure also indicates that the possibility that stimulatory effect of FGF-2 is more
pronounced in young SMC than in aged SMC, coinciding with what we hypothesized. If this is true, then there exists an age-modulation of the ability of SMC to react to
mitogenic agents. To examine the possibility of whether FGF-2 leads to greater
stimulation in young SMC, the cell counts were normalized to the corresponding FGF-2-free control for a comparison of the extent of stimulation experienced by young and agd
3 2.5 0 2-*a P* -+- Aged SMC *M 1.5 E -v- Young SMC 0 0 u 0.5 control 5 (ng/mI) 10 20 50 bFGF level (nglml)
Figure 2.10 Age-modulated differentiation in response to FGF-2 stimulation on day 8. Young SMC can
be stimulated to a greater extent than aged SMC. Cell counts as a function of difference FGF-2 concentrations were normalized to the corresponding heparin -free control for a comparison of the
stimulatory effect of FGF-2 on young and aged SMC. (P* <0.05 for comparison of each pair of young and aged SMC at each heparin level).
At all concentrations of FGF-2 administered, young SMC were stimulated to a greater extent than aged SMC. This difference in the stimulatory ability of FGF-2 on young and aged SMC was hypothesized originally and is nmw confirmed to be true.
Statistical analysis has shown it is unlikely that this age-modulated decrease in the ability of SMC to respond to FGF-2 stimulation is due to chance. In short, the stimulatory effect of FGF-2 is less pronounced in aged SMC than in young SMC, and our original
hypothesis is confirmed.
Having established the existence of a muted reaction to FGF-2 stimulation due to aging, the next logical step was to examine whether the incremental stimulatory effect of
FGF-2 as its concentration went up was also modulated by age. Stated differently, it was
established that 10 ng/ml FGF-2 led to greater stimulatory effect in young SMC, but is there also an age-modulated differentiation in the incremental stimulation caused by raising the FGF-2 concentration of 10 ng/ml to 20 ng/ml? Is the incremental stimulation
The incremental stimulatory effect of FGF-2 at day 8 was found to be significant for young SMC in the range of FGF-2 concentration administered, indicating the lack of
saturation effect at least within this range of FGF-2. However, for aged SMC, FGF-2 concentration higher than 5 ng/ml did not lead to any significant incremental stimulation of proliferation by day 8, suggesting that saturation has been reached at around 5 ng/ml.
The result of the FGF-2-stimulation study on young and aged SMC is best summarized in Figure 2.11. It clearly illustrates both the extent to which SMC can be stimulated by FGF-2 as a function of age and the level of incremental stimulation as FGF-2 concentration goes up.
180 160 140 120 .2 100 -k-Aged 0 80 -- Young 0-E n 60 40 20 0 A 0 10 20 30 40 50 60 FGF level (ng/ml)
Figure 2.11 Percent stimulation of young and aged SMC as a function of FGF-2 concentration on day 8.
This graph is constructed by the following formula applied to the data points from day 8: 100* (treatment cell count - control cell count)/control cell count. The more stimulation is caused by FGF-2, the more
positive the percent of stimulation is in addition to control. For example, percent stimulation of 80 means the treatment group is 180 percent of the control. Thus, the vertical axis indicates percent of stimulation in addition to control.
By taking the difference between control and FGF-2-stimulated cell count and then normalizing this difference to control, Figure 2.11 is able to present the age-modulation stimulatory effect of different levels of FGF-2 on young and aged SMC in a very insightful fashion. Two valuable pieces of information can be gained from this graph, the degree to which proliferation can be stimulated, and whether saturation effect is present. First, FGF-2 stimulation of SMC proliferation is always more pronounced in young than aged SMC, suggesting aged SMC experiences muted reaction toward
approaches an asymptotic level of 50% proliferation in addition to control, and no more. Young SMC, on the other hand, experience stimulation as high as 160% in addition to control, and possibly higher. Second, the saturation level of FGF-2 is much lower in aged SMC. A FGF-2 level higher than 5 ng/ml does not lead to substantial additioml stimulation in aged SMC, for saturation has been reached at around 5 ng/ml, as seen in flattening of the curve. Young SMC, on the other hand, don't seem to be operating in the
saturating region even for FGF-2 concentration as high as 50 ng/ml. In fact, no sign of saturation was observed.
2.4 Discussion
This chapter focused on the issue of proliferation and the effect of aging on the cellular level, specifically the implications and insights to be gained in the context of age-related atherosclerotic plaque destabilization. The hypothesis that aged SMC proliferate
at a slower rate than young SMC has been validated.
The proliferation assay (see Figure 2.2) showed that, for the serum levels
administered, aged SMC are significantly less responsive than their young counterparts in terms of proliferation capability. To the best of our knowledge, our group is the first to
show this differentiation in serum saturation level. This finding concurred with the age-dependent decrease in proliferation that others have demonstrated in human, mouse, and rat cultures. Putting this in the context of later stage atherosclerotic progression, our findings would suggest fewer SMC in the fibrous cap of the lesions, which is consistent with previous observations [11]. In conclusion, our findings showed that, as SMC age, not only do they respond less to serum stimulation of growth, but the serum saturation level also raises. What this suggests is that, to achieve the same level of proliferation as young SMC, aged SMC would require a higher level of serum stimulation. And even with a higher serum level, the proliferation profile would still appear distinct, for aged
SMC seem to be unable to achieve the classic exponential growth profile. Interestingly, the linear growth profile in the aged SMC compared to that of the exponential in the young, leading to a three-fold difference in population size by day 9 for serum level of
10% (see Figure 2.3), brings up the possibility that biological or molecular changes are preventing the aged SMC from achieving the classic exponential proliferation profile.
Furthermore, heparin- and FGF-2-dosage studies on young and aged SMC led to the exciting finding that aged SMC experience reduced ability to respond to inhibitory and stimulatory cues. To the best of our knowledge, our group is the first to report this age- modulated muted response.
The heparin inhibition study, which demonstrated age modulation of the reaction of SMC to heparin's inhibition of proliferation, carries profound implication. In addition
for atherosclerosis has its basis in the age-modulated changes in SMC that renders it unable to react to environmental regulatory cues, thus introducing instability to the site of the lesion and exposing the patient to adverse events. Exactly how this translates into the progression of lesion destabilization is a topic for future research. However, we can safely acknowledW the existence of age-modulated decrease in sensitivity toward heparin inhibition, combined with an overall decrease in proliferation rate.
It is possible that, instead of being limited to heparin, this finding is a universal phenomenon that is true for other anti-proliferative agents as well. If such were the case, the implication of this age- modulation decrease in inhibition sensitivity would be
tremendous for therapeutical consideration. If such were the case, the argument that lesion destabilization stems from the inability of aged SMC to be regulated properly would become even more convincing.
The FGF-2 stimulation study, showing aged SMC to be less responsive than young SMC to FGF-2 (see Figure 2.5), suggests that age also modulates the reaction of SMC to FGF-2 stimulation of proliferation. Specifically, under the mitogenic influence of FGF-2, data show that aged SMC can be stimulated to a lesser extent than young SMC, and aged SMC experience stimulation saturation at a concentration much lower than that of young SMC. If the heparin inhibition study were one side of the story, then the FGF-2 stimulation study would be the other side of the story. Under both
circumstances, we have found aged SMC to be less responsive to the environmental cue given. This reduced sensitivity is clearly illustrated by the inability of aged SMC to differentiate between the different levels of FGF-2 administered.
As shown by the PDGF treatment group, this finding of reduced ability to react to growth stimuli is nmt merely FGF-2-specific. This finding pushes us toward believing that this is a universal phenomenon true for many other mitogenic agents as well.
In fact, together with insights from the heparin inhibition study, a big picture emerges where, as a person ages, the SMC display a muted ability to react to regulatory signals, either inhibitory or stimulatory. This implies that, as one ages, the stability in the system achieved by the complex network of regulation gradually breaks down as SMC changes in its ability to react to those signals of communication and control. If such were the case, the implication of this age-modulated decrease in stimulatory sensitivity would be tremendous for both therapy and treatment.
Altogether, the results from this chapter suggest that, for the same blood serum level, as SMC age, their proliferation ability decreases, which concurs with the lack of
SMC proliferation in the progression and destabilization of advanced stage
atherosclerotic lesions. Furthermore, heparin and FGF-2 dosage response data point toward the interesting phenomenon of age-modulated decrease in sensitivity toward heparin inhibition and FGF stimulation. In short, aged SMC cannot be inhibited or
stimulated as much as young SMC. And if one were to increase the amount of those environmental inhibitory or stimulatory agents, saturation is reached fairly quickly in aged SMC. This age-associated muted response, along with reduced sensitivity toward
environmental inhibitory and stimulatory cues, has profound implications for the overall communication and stability of the system. Many of the biological activities and
regulatory mechanisms are regulated through a complex network of cytokine
communication. As SMC ages, it is highly possible that the trend toward atherosclerotic plaque instability depends heavily on this change in sensitivity to environmental
3. Receptor Age Differentiation
3.1 Background
Hypothesis: Age-modulated FGF receptor-i down-regulation contributes to the age-modulated decrease in proliferation by affecting the ability of aged SMC to react to FGF-2 stimulation.
Data from the Chapter Two has demonstrated that a fundamental difference between young and aged SMC lies in the age-modulated decrease in proliferation, both in normal growth condition and under FGF-2 stimulation. As SMC receive mitogenic cues from the environment, a complex cascade of signal propagation and transduction
pathways is activated intracellularly, ultimately leading to cell division and proliferation. Results from Chapter Two would suggest that, even though the same amount of FGF-2 is administered to young and aged SMC, somewhere in the signal transduction pathway leading to proliferation, the strength of stimulatory signals could be weakened in aged SMC relative to the young, thus leading to decreased proliferation. To track the possible location of this age-related dysfunction downstream of FGF-2 stimulation, we selected a well-understood stimulus and followed its differential downstream effect on aged and young SMC.
We decided to use FGF-2 as our stimulator. Not only were primary data on age-modulation of FGF-2-stimulated SMC proliferation available from Chapter Two, but also the effect of FGF-2 on cells has been extensively studied and documented, especially in the context of vascular diseases. Since FGF-2 is an important mitogen in the blood vessel wall [19], tracing the steps of FGF-2 leading to different effects in young and aged SMC is crucial for a better understanding of the atherosclerosis process as related to aging.
It is known that FGF-2 is a member of a large family of polypeptides and is synthesized in a range of cell types, including endothelial cells, fibroblasts, SMC, and macrophages. Its biological effects are mediated by high-affinity cell surface receptors from the protein tyrosine kinase family. Though four different receptors have been identified, FGF-2 and FGF receptor-I are the predominant growth factor and growth factor receptor form in SMC [20, 21]. The FGF-2 signal transduction pathway leading to cellular proliferation is illustrated in Figure 3.1.
FGF-2HSPG FGFR
RA ProSietton Migraion
Figure 3.1 FGF-2 stimulation of proliferation. The binding of FGF-2 to its cell surface receptors is
enhanced by cell surface heparin sulfate proteoglycans, and the binding leads to activation of the surface receptors via autophosphorylation. These receptors then convey the stimulatory signals across the cell membrane to the inside the cell and activate RAS. In summary, RAS recruit RAF- 1, which then activate MEK. MEK proceed to activate the mitogen-activated protein kinases (MAPK), which translocate to the
cell nucleus where they directly activate transcription factors to start transcribing the cellular DNA. FGF-2 activation can lead to a few end-point biological effects, one of which is cell proliferation. Figure copied from [22].
FGF-2 plays an important role during the vascular injury repair process following common procedures such as angioplasty and stent implantation. While in vivo studies have shown that FGF-2 administration in an artery with an intact endothelial monolayer does not elicit SMC replication, administration of FGF-2 after vascular injury denudes the endothelium has been shown to increase SMC growth. SMC proliferation in this context, unfortunately, often results in the formation and thickening of the neointima during this repair process, leading to complications such as restenosis [19].
It is possible that age-modulated decrease of proliferation in aged SMC actually reflects a weakening or dysfunction of a segment of the FGF-2 activated signal