Publisher’s version / Version de l'éditeur:
Questions? Contact the NRC Publications Archive team at
PublicationsArchive-ArchivesPublications@nrc-cnrc.gc.ca. If you wish to email the authors directly, please see the first page of the publication for their contact information.
https://publications-cnrc.canada.ca/fra/droits
L’accès à ce site Web et l’utilisation de son contenu sont assujettis aux conditions présentées dans le site LISEZ CES CONDITIONS ATTENTIVEMENT AVANT D’UTILISER CE SITE WEB.
Research Report (National Research Council of Canada. Institute for Research in
Construction), 2007-11-16
READ THESE TERMS AND CONDITIONS CAREFULLY BEFORE USING THIS WEBSITE. https://nrc-publications.canada.ca/eng/copyright
NRC Publications Archive Record / Notice des Archives des publications du CNRC : https://nrc-publications.canada.ca/eng/view/object/?id=6dbb683c-ea98-4f11-b92a-e59291460f07 https://publications-cnrc.canada.ca/fra/voir/objet/?id=6dbb683c-ea98-4f11-b92a-e59291460f07
NRC Publications Archive
Archives des publications du CNRC
For the publisher’s version, please access the DOI link below./ Pour consulter la version de l’éditeur, utilisez le lien DOI ci-dessous.
https://doi.org/10.4224/20377338
Access and use of this website and the material on it are subject to the Terms and Conditions set forth at
Design Fires for Commercial Premises - Results of Phase II
http://irc.nrc-cnrc.gc.ca
D e s i g n F i r e s f o r C o m m e r c i a l P r e m i s e s –
R e s u l t s o f P h a s e 2
I R C - R R - 2 3 6
B w a l y a , A . C . ; Z a l o k , E . ; H a d j i s o p h o c l e o u s , G .
N o v e m b e r 1 6 , 2 0 0 7
The material in this document is covered by the provisions of the Copyright Act, by Canadian laws, policies, regulations and international agreements. Such provisions serve to identify the information source and, in specific instances, to prohibit reproduction of materials without written permission. For more information visit http://laws.justice.gc.ca/en/showtdm/cs/C-42
Les renseignements dans ce document sont protégés par la Loi sur le droit d'auteur, par les lois, les politiques et les règlements du Canada et des accords internationaux. Ces dispositions permettent d'identifier la source de l'information et, dans certains cas, d'interdire la copie de documents sans permission écrite. Pour obtenir de plus amples renseignements : http://lois.justice.gc.ca/fr/showtdm/cs/C-42
Contents
1 INTRODUCTION 1 2 EXPERIMENTAL SETUP 1 3 FIRE EXPERIMENTS 2 4 RESULTS 3 5 CONCLUSION 7 6 ACKNOWLEDGEMENTS 8 7 REFERENCES 8Appendix A: Pictures of Test Specimens and Fire Tests 9
Appendix B: Results for Test 1 – “Computer showroom” 12
Appendix C: Results for Test 2 – “Storage room” 16
Appendix D: Results for Test 3 – “Clothing store ” 20
Appendix E: Results for Test 4 – “Toy store” 24
Appendix F: Results for Test 5 – “Shoe store (storage room)” 28
Appendix G: Results for Test 6 – “Book store” 32
Abstract
This report presents the results of Phase 2 of a joint research project between the NRC-IRC Fire Research Program and Carleton University, in which seven room-scale fire experiments were conducted in simulated retail settings with the following products: computers, clothing, toys, shoes, books and cooking products (fast food restaurants). The objective of the experiments was to study room fire behaviour beyond flashover.
The results showed that all of the simulated retail settings produced fires with a peak heat release rate between 2,400 kW and 2,800 kW when ignited with a 75 kW ignition source. The peak temperatures measured at the ceiling level of the fire room exceeded 1,100 oC in all of the experiments.
The rate of fire growth for each test varied due to differences in ignitability and flame spread behaviour of the different test materials. In particular, tests laden with plastic materials and those with clothing exhibited faster fire growth rates, whereas tests
consisting predominantly of cellulose materials, such as wood and paper, had slower fire growth rates. Beyond 500 kW all of the tests demonstrated an enhancement in burning rate likely due to radiation feedback from the hot upper layer of combustion gases and the room boundaries.
Design Fires for Commercial Premises – Results of Phase 2
by
Alex Bwalya, Ehab Zalok and George Hadjisophocleous
1 INTRODUCTION
This report presents the results of Phase 2 of a joint research project between the NRC-IRC Fire Research Program and Carleton University, in which seven room-scale fire experiments were conducted in simulated retail settings.
In Phase 1 of the project, nine medium-scale fire experiments were conducted to determine the combustion properties of combustibles found in retail premises. The test facility used was a test room with
ISO 9705 compatible dimensions and the fire load density used in the experiments ranged from 661 MJ/m2 to 5,305 MJ/m2. The fire load density and composition of combustibles were determined from a survey of commercial buildings that was conducted by Carleton University in the Canadian cities of Ottawa and Gatineau [1 - 3]. Results from Phase 1 of the project have been reported in other publications [2, 4, 5].
The fire experiments in Phase 2 of the project were conducted using larger quantities of essentially the same combustibles that were tested in Phase 1. However, a different test facility was used in order to overcome a limitation of the test facility used in Phase 1, which caused the maximum measurable heat release rate (HRR) to be limited to 1,500 kW and prevented testing of flashover fires. Therefore, a main objective of Phase 2 was to study fire behaviour beyond flashover.
2
EXPERIMENTAL SETUPFigure 1 is a schematic illustration of the floor plan and instrumentation of the test facility, which was constructed with concrete blocks and had all its interior surfaces (walls and ceiling) lined with cement boards. The cement boards were also covered with an insulating sheet of ceramic fibres to reduce heat transmission and thereby extend the longevity of the interior surface lining. The 3.6 m x 2.75 m x 2.4 m high fire room had a 0.9 m x 2.2 m high doorway connecting it to a long corridor, which following a ‘U’ bend led to a 1.2 m wide door opening that was directly under the hood of an open calorimeter. The purpose of the corridor was to allow the combustion products to cool down before entering the exhaust duct of the calorimeter as it was not designed to operate at very high
temperatures.
The basic elements of the calorimeter were a 558-mm-diameter duct, an exhaust fan assembly, and a rectangular hood of 3,900 mm x 3,640 mm, which was 2,350 mm above the ground. Measurements of the volumetric flow rate and temperature of the exhaust gases, and concentrations of oxygen, carbon dioxide and carbon monoxide were taken in the hood exhaust duct to facilitate calculation of the heat release rate by using the oxygen consumption method. The optical density of the smoke was measured in the exhaust duct using a pulsed white light smoke meter.
T F 1 040 27 5 26 0 12 0 90 120 360 240 120 Calorimeter Hood Observation window Observation window T F 20 ceiling-mounted thermcouples Thermocouple tree
Heat flux meter
Fuel package
Figure 1. Floor plan of the test facility showing instrumentation positions[5]
Temperature measurements were made with K-type thermocouples at various locations in the test facilities as follows:
• One thermocouple tree was placed in the fire compartment at 300 m from the corner closest to the doorway. The thermocouples were placed on the tree at elevations of: 2.10, 1.72, 1.57, 1.42, 1.27, 0.97 and 0.67 m above the floor.
• Five thermocouples were installed in the fire compartment at ceiling height (2.4m) - one thermocouple at each quarter point and one at the center of the ceiling area. • Fifteen thermocouples were installed in the corridor at ceiling height at the following
distances from the centre line of the doorway of the fire compartment: 0.00, 0.50, 1.00, 1.50, 2.0, 2.50, 3.00, 3.50, 4.00, 4.50, 5.0, 5.75, 6.50, 7.25 and 8.00 m. Heat flux measurements were taken in the fire compartment using a heat flux meter that was placed at floor height at the centre of the floor space.
A vertical ruler attached to one side of the doorway was used to measure the height of the smoke at the doorway.
Fire events were recorded using two video cameras. One of the cameras records events in the fire room while the second camera recorded the movement of the smoke and flames along the long corridor.
3
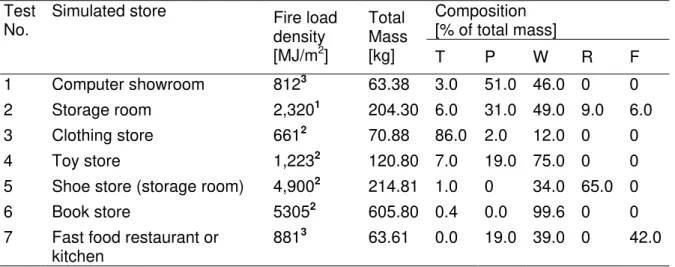
FIRE EXPERIMENTSTable 1 shows the fire load density, mass and composition for all of the
experiments that were conducted. Each fuel package, representing a fire load density determined from the survey, was limited to a floor area of about 2 m2 (twice the area used
in Phase 1) and consisted of different new and used materials, such as plastics, textiles, paper, rubber and wood products in the proportions found in the survey.
Table 1. Fire load density, mass and composition of combustibles used in the experiments
(excluding non-combustible elements).
Composition [% of total mass] Test
No.
Simulated store Fire load
density [MJ/m2] Total Mass [kg] T P W R F 1 Computer showroom 8123 63.38 3.0 51.0 46.0 0 0 2 Storage room 2,3201 204.30 6.0 31.0 49.0 9.0 6.0 3 Clothing store 6612 70.88 86.0 2.0 12.0 0 0 4 Toy store 1,2232 120.80 7.0 19.0 75.0 0 0
5 Shoe store (storage room) 4,9002 214.81 1.0 0 34.0 65.0 0
6 Book store 53052 605.80 0.4 0.0 99.6 0 0
7 Fast food restaurant or kitchen
8813 63.61 0.0 19.0 39.0 0 42.0
1
90th percentile; 2 95th percentile; 3 maximum.
T: Textiles; P: Plastics; W: Wood and paper; R: Rubber and leather; F: Food derivative
Note: The floor area covered by the fuel package in Test 5 was 1 m2 and 2 m2 in all other tests.
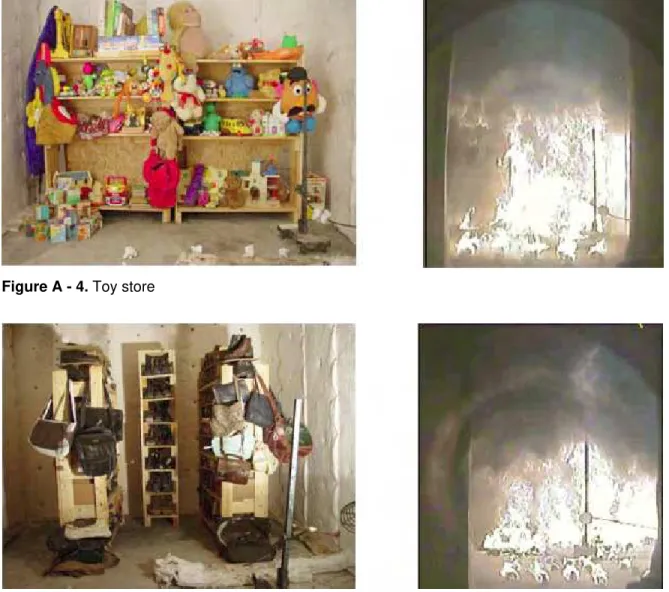
Photographs of the test arrangements and fire snapshots are given in Appendix A . The ignition source used in the experiments was a 75 kW T-shaped burner, which was applied for four (4) minutes. This ignition source simulates a fire from a large waste paper basket. All tests were allowed to continue to their natural extinction, except for Test no. 6, which was terminated by extinguishment with water, for safety reasons.
4
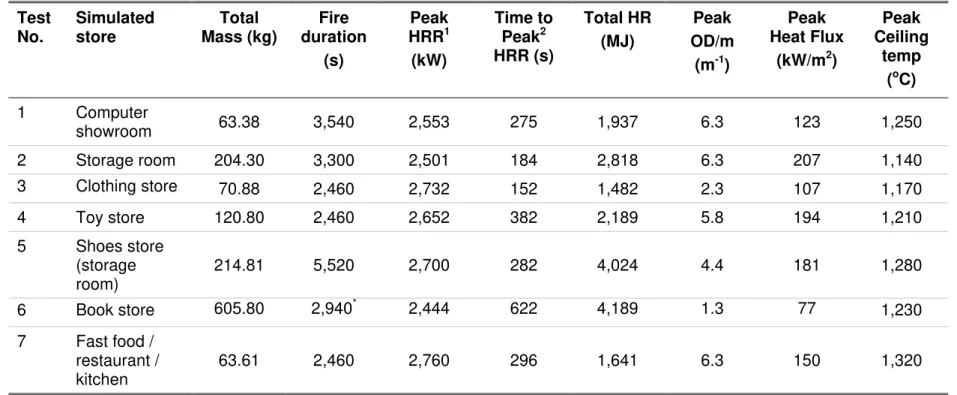
RESULTSThe results of the seven fire tests are summarized in Table 2. Appendices B through H contain detailed plots of data from all of the tests. For all of the tests, it was observed that the flames extended into the corridor following flashover. Therefore, a portion of the measured total heat release represents the combustion that took place outside of the fire room, but this was not quantified since there was no means of measuring it.
The peak value of the HRR for all of the tests does not differ appreciably as can be seen in Table 2 (mean value of 2,620 kW and standard deviation of 122 kW). However, as can be seen in Figure 2, the fire growth rates are quite different for each test until a HRR value of about 400 kW is reached. Thereafter, the rate of fire growth appears to be identical for all of the tests until the peak HRR value is reached. After the peak HRR was attained, the quantity of combustibles determined whether or not the fire was ventilation-controlled and the duration of this phase. The difference in fire growth rates is a direct consequence of the ignitability and flame spread behavior of the test materials. Plastics-laden tests and tests with clothing exhibited the faster fire growth rates whereas tests consisting predominantly of cellulose materials, such as paper and wood, had slower fire growth rates. After the HRR exceeded a value of about 500 kW all tests appeared to experience an enhancement in burning rate, which was likely due to the radiation feedback
Table 2. Summary of the test results. Test No. Simulated store Total Mass (kg) Fire duration (s) Peak HRR1 (kW) Time to Peak2 HRR (s) Total HR (MJ) Peak OD/m (m-1) Peak Heat Flux (kW/m2) Peak Ceiling temp (oC) 1 Computer showroom 63.38 3,540 2,553 275 1,937 6.3 123 1,250 2 Storage room 204.30 3,300 2,501 184 2,818 6.3 207 1,140 3 Clothing store 70.88 2,460 2,732 152 1,482 2.3 107 1,170 4 Toy store 120.80 2,460 2,652 382 2,189 5.8 194 1,210 5 Shoes store (storage room) 214.81 5,520 2,700 282 4,024 4.4 181 1,280 6 Book store 605.80 2,940* 2,444 622 4,189 1.3 77 1,230 7 Fast food / restaurant / kitchen 63.61 2,460 2,760 296 1,641 6.3 150 1,320 1
Calculated using the ASTM1537 method [6], 2 Time at which the peak HRR occurred [s]; * Test was terminated by extinguishment for safety reasons.
The HRR profiles shown in Figure 2 indicate that all of the tests were well-ventilated with the exception of Tests 5 and 6, which show distinct plateaus to signifying the existence of a ventilation controlled burning period following attainment of the peak HRR. Tests 5 and 6 also attained the highest average temperatures at ceiling level due to the longer duration of the fully-developed phase, as can be seen in Figure 3. The theoretical ventilation controlled HRR calculated based on the fire room’s opening factor of 2.95
m
5 2provided by the 2.2m x 0.9m door opening is 4.4 MW, assuming an ideal combustion efficiency of 100%. Time (s) 0 600 1200 1800 2400 3000 3600 4200 4800 5400 6000 He at Rele ase Ra te (kW ) 0 250 500 750 1000 1250 1500 1750 2000 2250 2500 2750 3000 Test 1 - Computers Test 2 - Storage Test 3 - Clothing Test 4 - Toys Test 5 - Shoes Test 6 - Books Test 7 - Fast foodFigure 2. Heat release rate profiles for all of the tests
Time (s) 0 600 1200 1800 2400 3000 3600 4200 4800 5400 6000 T em peratur e ( o C) 0 200 400 600 800 1000 1200 1400 1 - Computers 2 - Storage 3 - Clothing 4 - Toys 5 - Shoes 6 - Books 7 - Fast food
4.1 Production rate of CO and CO2
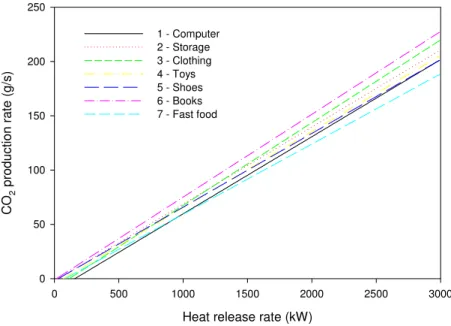
Analysis of the results indicates that the rate of production of carbon dioxide measured in the exhaust stream is directly proportional to the HRR as can be seen in Figure 4. This is to be expected considering that the method [7] employed to calculate the HRR is based on the premise that a fixed amount (13.1 MJ) of heat energy is released per kilogram of oxygen consumed and the fact carbon dioxide is the main product of
combustion that accounts for most of the oxygen consumed. The difference in the gradients of the curves can be attributed to differences in the chemical formulation of the different materials that were tested. Figure 4 clearly shows that there are similarities in the results of Tests 1, 4 and 5, which had substantial quantities of synthetic plastics. Test 6 (cellulose materials) and Test 7 (largely edible oils) form the upper and lower bound, respectively, while other tests lie in between as they had various combinations of cellulose and synthetic plastic materials. Table 3 gives the linear regression results for the graphs shown in Figure 4.
Heat release rate (kW)
0 500 1000 1500 2000 2500 3000 CO 2 pr oduction rate ( g /s) 0 50 100 150 200 250 1 - Computer 2 - Storage 3 - Clothing 4 - Toys 5 - Shoes 6 - Books 7 - Fast food
Figure 4. Correlation of CO2 production rate to the heat release rate
Table 3. Linear regression of CO2 vs. HRR results
Test no. y-axis intercept Gradient (g/kJ) Correlation
coefficient 1 -11.2871 0.0710 0.9899 2 -2.3751 0.0710 0.9976 3 -8.7530 0.0762 0.9954 4 -4.7820 0.0701 0.9959 5 -2.0322 0.0679 0.9978 6 -1.2220 0.0763 0.9986 7 -5.3901 0.06460 0.9971
For the case of carbon monoxide–a product of incomplete combustion—it’s rate of production is related to the combustion efficiency, which is in turn influenced by the ventilation conditions . The combustion efficiency was estimated from the concentrations of CO and CO2 in the exhaust duct. The contributions of pyrolyzed and partially oxidized combustion products were assumed to be small and therefore ignored in the calculation of combustion efficiency.
Figure 5, shows a typical results using data from Test 1. The results clearly indicate that the peak rate of carbon monoxide, and consequently lowest combustion efficiency, coincides with the time at which the peak HRR occurs. Thereafter, combustion efficiency improves during the fully-developed stage of the fire, resulting in lower carbon monoxide production rates. However, inefficient combustion re-occurs during the later stages of the decay likely due to limited air entrainment into the fire core caused by
reduced dynamic movement of the air and combustion gases. This is a typical trend shown by all of the tests.
Time (s) 0 300 600 900 1200 1500 1800 2100 2400 2700 C ombu s tion Ef fic ienc y ( % ) 80 85 90 95 100 CO 2 Flo w ra te (g/s) 0 50 100 150 200 250 CO flo w r a te ( g /s ) 0 2 4 6 8 10 12 14 16 He at rele a se rat e ( kW ) 0 500 1000 1500 2000 2500 3000 Combustion efficiency CO2 flow rate CO flow rate Heat release rate
Figure 5. Effect of combustion efficiency on CO and CO2 production rates
5
CONCLUSIONThe results show that all of the simulated retail settings that were tested produced fires with peak heat release rates between 2,400 kW and 2,800 kW when ignited with a 75 kW ignition source. The peak temperatures measured at the ceiling level of the fire room exceeded 1,100 oC in all of the tests.
The rate of fire growth for each test varied due to differences in ignitability and flame spread behaviour of the different test materials. In particular, tests laden with plastic materials and those with clothing exhibited faster fire growth rates whereas tests consisting predominantly of cellulose materials, such as wood and paper, had slower fire grow rates. Beyond 500 kW all of the tests demonstrated an enhancement in burning rate likely due to radiation feedback from the hot upper layer of combustion gases and the room boundaries.
6
ACKNOWLEDGEMENTSCarleton University and the staff at the Fire Research Program’s test facility in Almonte, where the experiments were conducted, are greatly acknowledged for their contribution to this work. Deserving special mention are: Ehab Zalok (Carleton University), and Eric Gibbs (Fire Research Program) both of whom conducted the experiments.
7 REFERENCES
1. Hadjisophocleous, G. and Zalok, E., 2003, “A Survey of Fire Loads in Commercial Floors of
Office Buildings”, Fourth International Seminar on Fire and Explosion Hazards, Londonderry, Northern Ireland, UK
2. Bwalya, A. C., Zalok, E., and Hadjisophocleous, G. V., 2006, “Design Fires for Commercial Premises - Results of Phase I”, Internal Report, Institute for Research in Construction, National Research Council Canada, 868, pp. 68, February 17, (IR-868).
3. Hadjisophocleous, G. and Zalok, E., 2004, “Fire Loads and Design Fires for Commercial Buildings”, Interflam 2004 10th International Fire Science and Engineering Conference 1, 435-446.
4. Zalok, E., Bwalya, A., and Hadisophocleous, G., 2005, “Medium-Scale Fire Experiments of Commercial Premises”, Fire and Materials Conference , Jan. 31-Feb. 2., San Francisco, USA.
5. Zalok, E., 2006, Design Fires for Commercial Premises, Carleton University, Department of Civil and Environmental Engineering, Ph.D. Thesis.
6. ASTM E1537-02a: Standard Test Method for Fire Testing of Upholstered Furniture, American Society for Testing and Materials, PA, USA, 2002.
7. Janssen, M., 1991, “Measuring Rate of Heat Release by Oxygen Consumption”, Fire Technology , pp. 234-249.
Appendix A:
Pictures of Test Specimens and Fire Tests
Figure A - 1: Computer showroom
Figure A - 2: Storage room
Figure A - 4. Toy store
Figure A - 6. Book store
Appendix B:
Results for Test 1 – “Computer showroom”
Time (s) 0 300 600 900 1200 1500 1800 2100 2400 2700 3000 He a t Rele ase Ra te (kW ) 0 500 1000 1500 2000 2500 3000Figure B-1.Heat release rate
Col 65 vs Col 66 Time (s) 0 300 600 900 1200 1500 1800 2100 2400 2700 3000 CO c oncentrati on [%Vol] 0.0 0.2 0.4 0.6 0.8 1.0 Figure B-2. CO concentration
Time (s) 0 300 600 900 1200 1500 1800 2100 2400 2700 3000 CO 2 concentr ation ( % Vol) 0 1 2 3 4 5 Figure B-3. CO2 concentration Time (s) 0 300 600 900 1200 1500 1800 2100 2400 2700 3000 O2 co ncen tr at ion (% V o l) 16 17 18 19 20 21 22 Figure B-4. O2 concentration
Time (s) 0 300 600 900 1200 1500 1800 2100 2400 2700 3000 Smoke de ns it y (OD/ m) 0 1 2 3 4 5 6 7
Figure B-5. Smoke density
Col 65 vs Col 66 Time (s) 0 300 600 900 1200 1500 1800 2100 2400 2700 3000 Heat flux (k W/m 2 ) 0 20 40 60 80 100 120 140
Time (s) 0 300 600 900 1200 1500 1800 2100 2400 2700 3000 Te m p e rat ur e ( o C) 0 200 400 600 800 1000 1200 Mean Temperature
Figure B-7. Ceiling temperature
Time (s) 0 300 600 900 1200 1500 1800 2100 2400 2700 3000 Te m p e rat ur e ( o C) 0 200 400 600 800 1000 1200 0.0 m 2.0 m 4.0 m 5.75 m 8.0 m Distance from the fire room
Appendix C:
Results for Test 2 – “Storage Room”
igure C-1.Heat release rate
Figure C-2. CO concentration Time (s) 0 300 600 900 1200 1500 1800 2100 2400 2700 3000 He at Rele ase Rate (kW ) 0 500 1000 1500 2000 2500 3000 F 0.0 0.2 0.4 0.6 0.8 1.0 Col 65 vs Col 66 Time (s) CO c o ncentrati on [%Vol ] 0 300 600 900 1200 1500 1800 2100 2400 2700 3000
0 1 2 3 4 5 Figure C-3. CO2 concentration Time (s) 0 300 600 900 1200 1500 1800 2100 2400 2700 3000 O2 co ncen trat ion (% V o l) 16 17 18 19 20 21 22 Figure C-4. O2 concentration Time (s) CO 2 c o nc e ntration ( % Vol) 0 300 600 900 1200 1500 1800 2100 2400 2700 3000
Time (s) 0 300 600 900 1200 1500 1800 2100 2400 2700 3000 Smoke densit y (OD/m) 0 1 2 3 4 5 6 7
Figure C-5. Smoke density
Col 65 vs Col 66 Time (s) 0 300 600 900 1200 1500 1800 2100 2400 2700 3000 Heat flux (k W/m 2 ) 0 50 100 150 200 250
Time (s) 0 300 600 900 1200 1500 1800 2100 2400 2700 3000 Te m p e rat ur e ( o C) 0 200 400 600 800 1000 1200 Mean Temperature
Figure C-7. Ceiling temperature
Time (s) 0 300 600 900 1200 1500 1800 2100 2400 2700 3000 Te m p e rat ur e ( o C) 0 200 400 600 800 1000 1200 0.0 m 2.0 m 4.0 m 5.75 m 8.0 m Distance from the fire room
Appendix D:
Results for Test 3 – “Clothing Store”
igure D-1.Heat release rate
Time (s) 0 240 480 720 960 1200 1440 1680 1920 2160 2400 2640 He at Rele ase Rate (kW ) 0 500 1000 1500 2000 2500 3000 F Col 65 vs Col 66 Time (s) 0 300 600 900 1200 1500 1800 2100 2400 2700 3000 CO c onc entrati on [%V o l] 0.0 0.2 0.4 0.6 0.8 1.0 Figure D-2. CO concentration
Time (s) 0 300 600 900 1200 1500 1800 2100 2400 2700 3000 CO 2 concentr a ti o n ( % Vol) 0 1 2 3 4 5 6 Figure D-3. CO2 concentration Time (s) 0 240 480 720 960 1200 1440 1680 1920 2160 2400 2640 O2 co nc entra tion (% v o l) 10 12 14 16 18 20 22 Figure D-4. O2 concentration
Time (s) 0 300 600 900 1200 1500 1800 2100 2400 2700 3000 S m ok e d e n s it y (OD /m) 0.0 0.5 1.0 1.5 2.0 2.5
Figure D-5. Smoke density
igure D-6. Heat flux and temperature at the floor level Col 65 vs Col 66 Time (s) 0 300 600 900 1200 1500 1800 2100 2400 2700 3000 Heat f lux (kW /m 2 ) 0 20 40 60 80 100 120 F
Time (s) 0 300 600 900 1200 1500 1800 2100 2400 2700 3000 Te m p e rat ure ( o C) 0 200 400 600 800 1000 1200 Mean Temperature
Figure D-7. Ceiling temperature
igure D-8. Temperatures long the corridor Time (s) 0 300 600 900 1200 1500 1800 2100 2400 2700 3000 Temper atu re ( o C) 0 200 400 600 800 1000 0.0 m 2.0 m 4.0 m 5.75 m 8.0 m Distance from the fire room
Appendix E:
Results for Test 4 – “Toy store”
Time (s) 0 300 600 900 1200 1500 1800 2100 2400 2700 3000 He a t Rele ase Ra te (kW ) 0 500 1000 1500 2000 2500 3000Figure E-1.Heat release rate
Time (s) 0 300 600 900 1200 1500 1800 2100 2400 2700 3000 CO c oncentration [%Vol] 0.0 0.2 0.4 0.6 0.8 1.0
Time (s) 0 300 600 900 1200 1500 1800 2100 2400 2700 3000 CO 2 concentr ation ( % Vol) 0 1 2 3 4 5 6
Figure E-3. CO2 concentration
Time (s) 0 300 600 900 1200 1500 1800 2100 2400 2700 3000 O2 co ncen trat ion (% V o l) 15 16 17 18 19 20 21 22
Time (s) 0 300 600 900 1200 1500 1800 2100 2400 2700 3000 Smo k e d ens it y (OD /m) 0 1 2 3 4 5 6 7
Figure E-5. Smoke density
Col 65 vs Col 66 Time (s) 0 300 600 900 1200 1500 1800 2100 2400 2700 3000 Heat flux (k W/m 2 ) 0 20 40 60 80 100 120
Time (s) 0 300 600 900 1200 1500 1800 2100 2400 2700 3000 Tem p er atur e ( o C) 0 200 400 600 800 1000 1200 Mean Temperature
Figure E-7. Ceiling temperature
Time (s) 0 300 600 900 1200 1500 1800 2100 2400 2700 3000 Te m p e rat ur e ( o C) 0 200 400 600 800 1000 1200 0.0 m 2.0 m 4.0 m 5.75 m 8.0 m Distance from the fire room
Appendix F:
Results for Test 5 – “Shoe Store”
Time (s) 0 300 600 900 1200 1500 1800 2100 2400 2700 3000 He a t Rele ase Ra te (kW ) 0 500 1000 1500 2000 2500 3000Figure F-1.Heat release rate
Col 65 vs Col 66 Time (s) 0 300 600 900 1200 1500 1800 2100 2400 2700 3000 CO c oncentration [%Vol] 0.0 0.2 0.4 0.6 0.8 1.0 Figure F-2. CO concentration
Time (s) 0 300 600 900 1200 1500 1800 2100 2400 2700 3000 CO 2 concentr ation ( % Vol) 0 1 2 3 4 5 Figure F-3. CO2 concentration Time (s) 0 300 600 900 1200 1500 1800 2100 2400 2700 3000 O2 co ncen trat ion (% V o l) 15 16 17 18 19 20 21 22 Figure F-4. O2 concentration
Time (s) 0 300 600 900 1200 1500 1800 2100 2400 2700 3000 Smoke de ns it y (OD/ m) 0 1 2 3 4 5
Figure F-5. Smoke density
Col 65 vs Col 66 Time (s) 0 300 600 900 1200 1500 1800 2100 2400 2700 3000 Heat flux (k W/m 2 ) 0 20 40 60 80 100 120 140 160 180
Time (s) 0 300 600 900 1200 1500 1800 2100 2400 2700 3000 Te m p e rat ur e ( o C) 0 200 400 600 800 1000 1200 Mean Temperature
Figure F-7. Ceiling temperature
Time (s) 0 300 600 900 1200 1500 1800 2100 2400 2700 3000 Te m p e rat ur e ( o C) 0 200 400 600 800 1000 1200 1400 1600 0.0 m 2.0 m 4.0 m 5.75 m 8.0 m Distance from the fire room
Appendix G:
Results for Test 6 – “Book Store”
Time (s) 0 300 600 900 1200 1500 1800 2100 2400 2700 3000 He a t Rele ase Ra te (kW ) 0 500 1000 1500 2000 2500 3000Figure G-1.Heat release rate
Col 65 vs Col 66 Time (s) 0 300 600 900 1200 1500 1800 2100 2400 2700 3000 CO c oncentration [%Vol] 0.0 0.2 0.4 0.6 0.8 1.0 Figure G-2. CO concentration
Time (s) 0 300 600 900 1200 1500 1800 2100 2400 2700 3000 CO 2 concentr ation ( % Vol) 0 1 2 3 4 5 6 Figure G-3. CO2 concentration Time (s) 0 300 600 900 1200 1500 1800 2100 2400 2700 3000 O2 co ncen trat ion (% V o l) 15 16 17 18 19 20 21 22 Figure G-4. O2 concentration
Time (s) 0 300 600 900 1200 1500 1800 2100 2400 2700 3000 Smo k e d ens it y (OD /m) 0.0 0.2 0.4 0.6 0.8 1.0 1.2 1.4 Col 65 vs Col 66 Time (s) 0 300 600 900 1200 1500 1800 2100 2400 2700 3000 He at fl u x (k W/m 2 ) 0 20 40 60 80
Figure G-5. Smoke density
Time (s) 0 300 600 900 1200 1500 1800 2100 2400 2700 3000 Te m p e rat ur e ( o C) 0 200 400 600 800 1000 1200 Mean Temperature
Figure G-7. Ceiling temperature
Time (s) 0 300 600 900 1200 1500 1800 2100 2400 2700 3000 Te m p e rat ur e ( o C) 0 200 400 600 800 1000 1200 0.0 m 2.0 m 4.0 m 5.75 m 8.0 m Distance from the fire room
Appendix H:
Results for Test 7 – “Fast Food Restaurant Kitchen”
Time (s) 0 300 600 900 1200 1500 1800 2100 2400 2700 3000 He a t Rele ase Ra te (kW ) 0 500 1000 1500 2000 2500 3000Figure H-1.Heat release rate
Col 65 vs Col 66 Time (s) 0 300 600 900 1200 1500 1800 2100 2400 2700 3000 CO c oncentrati o n [%Vol] 0.0 0.2 0.4 0.6 0.8 1.0 Figure H-2. CO concentration
Time (s) 0 300 600 900 1200 1500 1800 2100 2400 2700 3000 CO 2 conc e n tr at ion (%Vol) 0 1 2 3 4 5 Figure H-3. CO2 concentration Time (s) 0 300 600 900 1200 1500 1800 2100 2400 2700 3000 O2 co ncen trat ion (% V o l) 15 16 17 18 19 20 21 22 Figure H-4. O2 concentration
Time (s) 0 300 600 900 1200 1500 1800 2100 2400 2700 3000 Smo k e d ens it y (OD /m) 0 1 2 3 4 5 6 7
Figure H-5. Smoke density
Col 65 vs Col 66 Time (s) 0 300 600 900 1200 1500 1800 2100 2400 2700 3000 He at fl u x (kW /m 2 ) 0 20 40 60 80 100 120 140 160
Time (s) 0 300 600 900 1200 1500 1800 2100 2400 2700 3000 Te m p e rat ur e ( o C) 0 200 400 600 800 1000 1200 1400 Mean Temperature
Figure H-7. Ceiling temperature
Time (s) 0 300 600 900 1200 1500 1800 2100 2400 2700 3000 Te m p e rat ur e ( o C) 0 200 400 600 800 1000 1200 1400 1600 0.0 m 2.0 m 4.0 m 5.75 m 8.0 m Distance from the fire room
![Figure 1. Floor plan of the test facility showing instrumentation positions[5]](https://thumb-eu.123doks.com/thumbv2/123doknet/14169849.474432/6.918.243.685.103.527/figure-floor-plan-test-facility-showing-instrumentation-positions.webp)