Publisher’s version / Version de l'éditeur:
10th International Conference on Healthy Buildings, 2012, 3, pp. 2569-2574, 2012-07-08
READ THESE TERMS AND CONDITIONS CAREFULLY BEFORE USING THIS WEBSITE.
https://nrc-publications.canada.ca/eng/copyright
Vous avez des questions? Nous pouvons vous aider. Pour communiquer directement avec un auteur, consultez la
première page de la revue dans laquelle son article a été publié afin de trouver ses coordonnées. Si vous n’arrivez pas à les repérer, communiquez avec nous à PublicationsArchive-ArchivesPublications@nrc-cnrc.gc.ca.
Questions? Contact the NRC Publications Archive team at
PublicationsArchive-ArchivesPublications@nrc-cnrc.gc.ca. If you wish to email the authors directly, please see the first page of the publication for their contact information.
NRC Publications Archive
Archives des publications du CNRC
This publication could be one of several versions: author’s original, accepted manuscript or the publisher’s version. / La version de cette publication peut être l’une des suivantes : la version prépublication de l’auteur, la version acceptée du manuscrit ou la version de l’éditeur.
Access and use of this website and the material on it are subject to the Terms and Conditions set forth at
Effectiveness of ventilation interventions at improving indoor air quality in Canadian homes with asthmatic children
Aubin, Daniel; Won, Doyun; Schleibinger, Hans; Gauvin, Denis; Lajoie, Pierre; Fugler, Don; Ruest, Ken; Gingras, Véronique
https://publications-cnrc.canada.ca/fra/droits
L’accès à ce site Web et l’utilisation de son contenu sont assujettis aux conditions présentées dans le site LISEZ CES CONDITIONS ATTENTIVEMENT AVANT D’UTILISER CE SITE WEB.
NRC Publications Record / Notice d'Archives des publications de CNRC: https://nrc-publications.canada.ca/eng/view/object/?id=e46ddf3f-de95-43fb-8ce8-8f15d6a0d02f https://publications-cnrc.canada.ca/fra/voir/objet/?id=e46ddf3f-de95-43fb-8ce8-8f15d6a0d02f
Effectiveness of ventilation interventions at improving indoor air quality in
Canadian homes with asthmatic children
Daniel Aubin1*, Doyun Won1, Hans Schleibinger1, Denis Gauvin2, Pierre Lajoie2, Don Fugler3ǂ, Ken Ruest3, Véronique Gingras2
1
Institute for Research in Construction, National Research Council of Canada, Ottawa, Canada
2
Institut national de santé publique du Québec, Québec City, Canada
3
Canada Mortgage and Housing Corporation, Ottawa, Canada *
Corresponding email: Daniel.Aubin@nrc.ca ǂ Retired
SUMMARY
This paper describes the results obtained during a randomized intervention study investigating the impact of ventilation rates on indoor air quality (IAQ) and the respiratory health of asthmatic children in Québec City, Canada. The objective of this study was to determine whether increased ventilation will lead to a corresponding decrease in the number of asthmatic symptoms in children, to correlate ventilation rates with IAQ, and to support research on health based ventilation rates. The ventilation intervention consisted of the optimization of the existing mechanical ventilation system or the addition of a heat recovery ventilator (HRV) or an energy recovery ventilator (ERV). The aggregate median air exchange rate during the heating-season in the intervention group was 0.17 h-1 before the intervention and 0.36 h-1 after the intervention. After the intervention there was a marked decrease in the concentration of a number of VOC’s, formaldehyde, CO2 and airborne mould spores demonstrating that
ventilation interventions are effective at improving IAQ. KEYWORDS
field study, asthma, ventilation, indoor air quality, volatile organic compounds
1 INTRODUCTION
The first phase of the field study involved three residential home visits (two during the heating season (October to April) and one in summer) where a number of IAQ relevant
chemical, biological and physical parameters were measured over a 6 to 8 day period. A series of questionnaires capturing information related to housing characteristics and occupant
behavior were also administered during the residential home visits. In the second phase, any home with one air exchange rate measurement below 0.25 h-1 or two in between 0.25 h-1 and 0.30 h-1 was considered eligible for the intervention. Of the 115 participants involved in the study, 83 were eligible for the intervention and these were randomly divided into two groups. One group of participants (n=43), had their ventilation rates increased by a combination of: installation of a heat recovery ventilator; energy recovery ventilator; and /or modification of the existing ventilation system. The other group (n=40), did not have any modifications done to the ventilation rate and served as a control group. The monitoring in the second phase after the intervention was identical to the first phase and was used to assess the effectiveness of the intervention on improving the indoor air quality and respiratory health.The following sections will focus on the pre and post intervention IAQ and ventilation results for the heating-season.
2 MATERIALS/METHODS
A total of 115 children with physician diagnosed asthma were recruited from the Centre Hospitalier Universitaire du Québec in Québec City. Throughout the study, 4 participants dropped out during the pre-intervention phase, prior to carrying on with the intervention 17 participants were removed from the study because their homes were sufficiently ventilated and 11 other participants were removed for other reasons and one participant dropped out during the post-intervention phase.
The average air exchange rates (AER) measured in the child’s bedroom and in the living room over a 6 to 8 day period were determined using the perfluorocarbon tracer (PFT) technique developed by the Tracer Technology Group at Brookhaven National Laboratory (Dietz and Cote, 1982). Analysis of triplicate CATS, placed side by side, showed a standard deviation of less than 6% in the measured air exchange rate. The AER was also measured over a 4-5 hour period in the child’s bedroom using SF6 tracer gas decay according to the ASTM test method
E 741-00 (ASTM, 2006) using an Innova 1312 or 1412 photoaccoustic field gas monitor. Building air tightness was measured using a Minneapolis Blower Door™ from The Energy Conservatory equipped with a DG-700 pressure and flow gauge and the data was analyzed with the TECTITE Airtightness Test Analysis Software. The blower door test was conducted according to the ASTM E 779-03 test method (ASTM, 2003).
Formaldehyde was measured in the child’s bedroom over a 6 to 8 day period using duplicate Waters Sep-Pak ® ExPosure cartridges as a passive sampler. The cartridges were
subsequently analyzed for formaldehyde using high performance liquid chromatography (HPLC) according the ASTM test method D 5197-03 (ASTM, 2003). Ozone (O3) and
nitrogen dioxide (NO2) were also measured in the child’s bedroom and a discussion about the
experimental protocols and results can be found in Aubin et al. 2011. In the child’s bedroom the relative humidity (RH) and temperature were measured with an Onset HOBO U12-013 data logger and the CO2 concentration was measured with a Vaisala GMW21 CO2 sensor.
The volatile organic compounds were sampled on Perkin Elmer stainless steel ATD Passive samplers containing a Tenax TA 60/80 sorbent. Duplicate passive samplers were left in the child’s bedroom for a period of 6 to 8 days. The VOCs were then desorbed from the tubes with a flow of helium using a Gerstel TDS 3 thermal desorption system and focused on a cooled inlet at -90 °C. The thermal desorber temperature ramp was 60 °C min-1 until 300 °C followed by a 5 min hold time. The compounds were then separated and detected on an Agilent 6890 GC-MSD operating in scan mode from m/z 35 to 300. The GC was equipped with a 30 m x 250 μm i.d. Supelco SPB-624 column and the temperature program was 35 °C for 5 min followed by a 6 °C min-1 temperature ramp to 230 °C.
Particulate matter was measured using a Grimm 1.108 particle counter and a TSI P-Trak ultrafine particle counter for 4 to 5 hours during in the child’s bedroom for the first day of the 6 to 8 day measurement period. Airborne mould spores were measured using a Staplex model MAS-2 two-stage microbial air sampler for 5 minutes during each of the visits in the heating season in the child’s bedroom, living room and the basement. The spores were collected onto both dichloran 18% glycerol (DG-18) and malt extract agar (MEA) covered petri dishes. Settling mould spores were collected for 4 to 5 hours in the child’s bedroom onto both MEA and DG-18 covered petri dishes. Both the airborne and settling mould spore samples were incubated at 25 ºC for 7 days then analyzed visually with a microscope to obtain a colony count. Allergen samples in dust were collected from the child’s mattress and carpet, if present in the child’s bedroom, using a Philips Topomatic T518 vacuum cleaner equipped with a
DustreamTM collector from Indoor Biotechnologies. The dust samples were then analyzed by Aerotech Laboratories for dust mite (Der p1, Der f1), cat (Fel d1) and dog (Can f 1) allergens using an enzyme-linked immunosorbent assay (ELISA).
The interventions consisted of the installation of either a Heat Recovery Ventilator (HRV) or an Energy Recovery Ventilator (ERV) and education of the home owner on its use and maintenance. ERV’s, which can transfer moisture into the incoming outdoor air stream, were installed in the homes which had indoor RH’s measurements lower than 35-40% RH and had other factors present, such as low heating-season indoor temperature, low number of occupants and presence of mechanical ventilation, which could contribute to low indoor humidity levels during the heating-season. Overall, the intervention group had 19 ERV’s and 24 HRV’s installed. The ERV’s were successful at maintaining an acceptable in RH since the average heating-season pre and post intervention RH for the ERV sub-group was 43.7% and 43.3% respectively compared to 49.5% and 43.3% for the HRV sub-group respectively. Prior to conducting the individual ventilation intervention the precise prescription was modeled for several homes computationally and physically in NRC’s purpose built Indoor Air Research Laboratory (IARL). The computational fluid dynamics (CFD) calculations were performed using Fluent and were conducted to optimize the geometry and initial placement of any supply and return air vents in the child’s bedroom that would be required during the installation of an HRV or ERV. The results of the computational models were then validated physically in a 1:1 scale model of the child’s bedroom in the IARL. Measurements of SF6
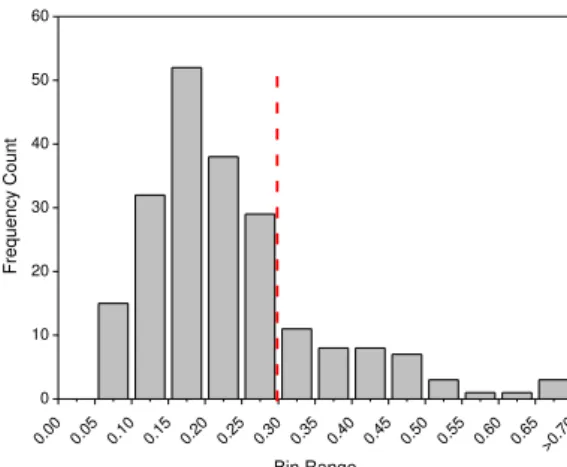
tracers gases, register flow rate, surface temperature, air temperature and velocity profiles throughout the model bedroom were compared to those predicted with the CFD modeling. Good agreement was obtained between the computational and physical modeling. The statistical analysis of the experimental data was conducted with OriginPro 8.6 (OriginLab Corporation). 3 RESULTS 0.00 0.05 0.10 0.15 0.20 0.25 0.30 0.35 0.40 0.45 0.50 0.55 0.60 0.65>0.70 0 10 20 30 40 50 60 Fr eq ue ncy Coun t Bin Range
Figure 1. Histogram of the air exchange rates (h-1) measured in the child’s bedroom in all the homes (n=114) during the heating-season pre-intervention visits. The dashed red vertical line shows our post-intervention ventilation goal of 0.30 h-1.
Table 1: Ventilation results from the child’s bedroom for intervention and control groups. Paired sample Wilcoxon signed rank test was conducted between the pre-intervention and post-intervention phase for each study group.
Parameter Group Pre-Intervention Post-Intervention
Geo. Mean Median Geo. Mean Median
Winter (PFT) Control 0.20 0.19 0.21 0.20 Intervention 0.17 0.17 0.36 0.36* Winter (SF6) Control 0.24 0.22 0.29 0.29* Intervention 0.26 0.27 0.42 0.42* Summer (PFT) Control 0.28 0.28 0.39 0.38* Intervention 0.23 0.25 0.56 0.54*
Note: Outliers above 1.5 h-1 removed for analysis, *difference between pre and post
intervention phase is statistically significant to p=0.05, and Geo. Mean = Geometric Mean
Figure 2. Average pre (yellow circle) and post (red circle) intervention heating-season air exchange rate measured in the child’s bedroom for the intervention group (n=43).
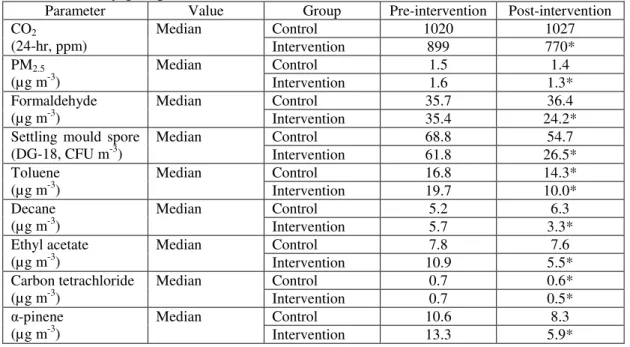
Table 2: Comparison of selected IAQ relevant parameters measured during the heating-season before and after the intervention for the control and intervention groups. Paired sample Wilcoxon signed rank test conducted between the pre-intervention and post-intervention phase for each study group.
Parameter Value Group Pre-intervention Post-intervention
CO2 (24-hr, ppm) Median Control 1020 1027 Intervention 899 770* PM2.5 (µg m-3) Median Control 1.5 1.4 Intervention 1.6 1.3* Formaldehyde (µg m-3) Median Control 35.7 36.4 Intervention 35.4 24.2*
Settling mould spore
(DG-18, CFU m-3) Median Control 68.8 54.7 Intervention 61.8 26.5* Toluene (µg m-3) Median Control 16.8 14.3* Intervention 19.7 10.0* Decane (µg m-3) Median Control 5.2 6.3 Intervention 5.7 3.3* Ethyl acetate (µg m-3) Median Control 7.8 7.6 Intervention 10.9 5.5* Carbon tetrachloride (µg m-3) Median Control 0.7 0.6* Intervention 0.7 0.5* α-pinene (µg m-3) Median Control 10.6 8.3 Intervention 13.3 5.9*
4 DISCUSSION
Figure 1 shows that the vast majority of the homes examined during the pre-intervention phase were under-ventilated and 83% failed to reach our nominal ventilation goal of 0.30 h-1 during the heating-season. For this period, the geometric mean and median air exchange rate were respectively 0.24 h-1 and 0.21 h-1 for the initial 114 homes involved in this study (some of these were subsequently removed from the intervention phase of the study). From Table 1 it can be seen that the pre-intervention summer air exchange rates were roughly 30% higher for both the control and intervention group. The average difference between simultaneously measured air exchange rates in the child’s bedroom and the living room was found to be 17% for 110 different homes. On the whole, our results suggest that the majority of the homes are under-ventilated during the heating-season which was also noted by Gilbert et al. (2006) who also observed that 80% of the homes in Québec City (n=96) had an air exchange rate below 0.23 h-1.
A clear relationship was also observed between higher concentrations of various gas-phase pollutants, such as CO2, formaldehyde and VOC’s, and lower PFT AER’s (not shown) (Aubin et al., 2011). A pronounced seasonal variation in the concentration of the gas-phase
compounds was noted with the concentration of most VOC’s being higher in winter and most aldehydes being higher in summer (Aubin et al., 2011).
From Figure 2 we can see that the intervention was successful at increasing the ventilation rates in the intervention group which increased the median PFT AER by a factor two of from 0.17 h-1 to 0.36 h-1 whereas that of the control group remained nearly constant (see Table 1). There were three outliers visible from Figure 2 which did not exhibit an increase in the ventilation rate. In the first case, the participant was non-compliant in operating their HRV, in second case the control installed with the new system was defective and eventually replaced and in the third case only one (elevated) PFT air exchange rate measurement was available during the pre-intervention phase even though the summer measurements indicated the home was still under ventilated.
From Table 2 it can be seen that the increase in ventilation led to lower observed concentrations of many IAQ relevant parameters. In particular, the median concentrations of CO2, formaldehyde and the settling mould spores decreased by 14%, 32% and 57%
respectively for the intervention group. Before the interventions, about a third of the homes exceeded the Health Canada’s (2006) formaldehyde guideline of 50 µg m-3
for an 8-hour exposure during the heating-season. Following the intervention all homes attained the Health Canada guideline in the heating-season.
Table 2 shows the concentration for a selected group of VOC’s that were routinely observed in all the homes. In certain cases, there is a statistically significant decrease in the concentration of the particular VOC following the intervention for the intervention group relative to the control group. This was the case of α-pinene, decane and ethyl acetate. However, for some compounds, such as carbon tetrachloride and toluene, there appears to be a statistically significant decrease in concentration across both the control and intervention groups. This might be due to the indoor sources for these chemicals. If the source is from a consumer product then the observed concentration will be a function of the pattern of use by the occupant along with the ventilation rate. This will cause the relationship between indoor concentration and ventilation rate to be less straightforward. If the source is from materials emissions this would lead to a relatively constant emission rate, notwithstanding changes in
RH and temperature, and the relationship between concentration and ventilation rate should be more straightforward. This was likely the case for formaldehyde.
A similarly ambiguous result was also obtained for the particulate matter measurements. From a paired t-test (α=0.05) performed on the median values it was determined that there was a statistically significant decrease in PM2.5 in the intervention group before and after the
intervention, from 1.6 to 1.3 µg m-3, but there was a statistically insignificant increase in the count of ultra-fine particles, from 5.4×106 cm-3 to 5.9×106 cm-3. This may be due to the sampling protocol for PM which was monitored during the first 4-5 hours of the visit during the heating-season and that the fact that PM levels were a easily influenced by occupant behavior such as cooking.
5 CONCLUSIONS
This paper demonstrated that the majority of the homes in our study are under-ventilated however our sample is not necessarily representative of the homes in the Québec City region. The installation of HRV’s and ERV’s was found to be effective for increasing residential ventilation rates. It was also determined that ERV’s are useful alternatives for providing an acceptable indoor RH in cold climates. Overall, ventilation interventions were found to be useful tools for improving indoor air quality and obtaining compliance with the Health Canada indoor air quality guidelines.
ACKNOWLEDGEMENT
The authors would like to thank Karine Barriault (NRC), Jean-Francois Chouinard (INSPQ), Simon Godbout (INSPQ), Pierre-Luc Lamarre (NRC), Wenping Yang (NRC), Kristina Boros (NRC), Stephanie So (NRC) and Lexi Thompson (NRC). This work was funded by the Government of Canada’s Clear Air Agenda, Québec’s Ministère de la santé et des services sociaux, the Canada Mortgage and Housing Corporation and Health Canada
6 REFERENCES
Aubin D.G., Won, D., Schleibinger, H., Gauvin, D., Lajoie, P., Fugler, D., 2011. Seasonal variation in indoor air quality from a field study investigating the impact of ventilation rates on the health of asthmatic children in Québec City. 12th International Conference on Indoor Air Quality and Climate, Austin, Paper #93
ASTM, 2003. ASTM E 779-03, Standard test method for determining air leakage rate by fan depressurization, West Conshohocken, American Society for Testing and Materials ASTM, 2003. ASTM Test Method D 5197-03, Standard test method for determination of formaldehyde and other carbonyl compounds in air (active sampler methodology), West Conshohocken, American Society for Testing and Materials
ASTM. 2006. ASTM Test Method E 741-00, Standard test method for determining air change in a single zone by means of a tracer gas dilution, West Conshohocken, American Society for Testing and Materials
Dietz R.N. and Cote E.A., 1982. Air infiltration measurements in a home using a convenient perfluorocarbon tracer technique, Environment International, 8(1-6), 419-433
Gilbert N.L., Gauvin D., Guay, M., Héroux, M.-E., Dupuis G., Legris M., Chan C., Dietz R.N., and Levesque B., 2006. Housing characteristics and indoor concentrations of nitrogen dioxide and formaldehyde in Québec City, Canada, Environmental Research, 102(1), 1-8
Health Canada, 2006, Residential indoor air quality guideline: formaldehyde, Publication H128-1/06-432-1E, Ottawa, Canada