HAL Id: halshs-00639327
https://halshs.archives-ouvertes.fr/halshs-00639327
Submitted on 8 Nov 2011HAL is a multi-disciplinary open access archive for the deposit and dissemination of sci-entific research documents, whether they are pub-lished or not. The documents may come from teaching and research institutions in France or abroad, or from public or private research centers.
L’archive ouverte pluridisciplinaire HAL, est destinée au dépôt et à la diffusion de documents scientifiques de niveau recherche, publiés ou non, émanant des établissements d’enseignement et de recherche français ou étrangers, des laboratoires publics ou privés.
CO2 abatement, competitiveness and leakage in the
European cement industry under the EU ETS:
Grandfathering vs. output-based allocation
Damien Demailly, Philippe Quirion
To cite this version:
Damien Demailly, Philippe Quirion. CO2 abatement, competitiveness and leakage in the European cement industry under the EU ETS: Grandfathering vs. output-based allocation. Climate Policy, Taylor & Francis, 2006, 6 (1), pp.93-113. �halshs-00639327�
CO2 abatement, competitiveness and leakage in the European cement
industry under the EU ETS: Grandfathering vs. output-based allocation
Climate Policy, 6(1): 93-113
Damien Demailly and Philippe Quirion
CIRED (International Research Centre on Environment and Development)
45 bis avenue de la Belle Gabrielle,
94736 Nogent/Marne,
Abstract
A recurrent concern raised by the European GHG Emissions Trading System
(ETS) is the fear of EU industry competitiveness loss: a loss in domestic
production and a loss in profits. This paper analyses how production and
profits in the European cement industry may depend upon allocation
approaches. We analyse two contrasting allocation methods of free allowances.
Under "grandfathering", the number of allowances a firm gets is independent
of its current behaviour. Under "output-based allocation", it is proportional to
its current production level. Whereas almost all the quantitative assessments of
the EU ETS assume grandfathering, the real allocation methods used by
Member States, notably because of the updating every five years and of the
special provision for new plants and plant closings, stand somewhere between
these two polar cases.
We study the impacts of these two polar allocation methods by linking a
detailed trade model of homogeneous products with high transportation costs
(GEO) with a bottom-up model of the cement industry (CEMSIM). The two
allocation approaches have very different impacts on competitiveness and
emissions abatements. Grandfathering 50% of past emissions to cement
producers is enough to maintain aggregate profitability (EBITDA) at its
business-as-usual level, but with significant production losses and CO2 leakage.
For an output-based allocation over 75% of historic unitary (tCO2
/tonne-cement) emissions, impact on production levels and EBITDA is insignificant,
abatement in the EU is much lower but there is almost no leakage. Policy
needs to recognise to what extent different allocation approaches may change
Keywords
Grandfathering, Output-based allocation, competitiveness, leakage
Damien DEMAILLY is a PhD student at CIRED. He studies the
competitiveness impacts of climate policies on CO2 intensive industries,
emphasising the role of transportation costs.
Philippe QURION is a research fellow at CIRED and LMD. He studies
emissions trading and other environmental policies, and their impact on
1. Introduction 1
The European GHG Emissions Trading System (ETS) is the most important
ETS worldwide and arguably the most important European climate change
mitigation policy in place. Assessing the environmental effectiveness and
economic efficiency of the EU ETS is therefore of the utmost importance.
Furthermore, many other countries, including the US, have not implemented
similar policies to date, so the EU ETS may impact European CO2-intensive
industry competitiveness.
However, the debate is blurred because wordings such as "competitive
disadvantage", "competitive distortion" and "competitiveness" have very
different meanings. Following Krugman (1994), one can even argue that at the
macroeconomic level, the very notion of competitiveness is meaningless.
However, for an industrial sector, the situation is different and these terms can
basically be reduced to two interpretations:
1. a loss in domestic production, which in turn may induce leakage to
imports from production in other parts of the world (“pollution havens”);
2. a loss in profits, hence in stock value, of domestic firms.
It is essential to disentangle these two effects since, as we shall see, different
allocation criteria would impact them in completely different – and often
opposite - ways. Hence, in the present paper, we analyse two contrasted
allocation methods. In the former, labelled "grandfathering" (GF), the number
of free allowances a firm gets is independent of its current behaviour. As we
demonstrate later, this assumption applies well to the US SO2 trading system,
In the latter, labelled "output-based allocation" (OB), firms receive allowances
proportional to their current production level – sometimes known as intensity-based allocation. In its pure form, this allocation method is currently excluded by the Commission, because it amounts to an “ex-post” adjustment (allocation
dependent upon behaviour during the same trading period), but it does
incorporate some features of the real-word allocation method. Notably,
repeated allocation over sequential periods gives potential for “updating”
based on output or emissions in the previous period, which offers a weaker
(deferred) form of output-based allocation, as detailed in section 2 below. The
allocation methods used by Member States in phase 1 thus stands somewhere
in between our two polar cases, and so are the methods allowed by the
directive for phase 2.
Almost all the quantitative assessments of the EU ETS that have been recently
published assume grandfathering, as defined above (Bernard et al.,
forthcoming; Criqui and Kitous, 2003; Klepper and Peterson, 2004 and 2005;
Reilly and Paltsev, 2005). An exception is IEA (2004). As we shall see in our
simulations, this assumption has a critical influence not only on
competitiveness but also on the environmental impact of the ETS (emissions
reductions in the EU and abroad).
We study the impacts of these allocation methods on the EU 27 cement
industry, which represents around 10% of world emissions from the cement
industry, through the CEMSIM-GEO model. GEO is a trade model we
developed to deal with homogeneous products with high transportation costs
(Demailly and Quirion, 2005a and 2005b). The world is divided into more than
version of GEO we use here, we assume that a Cournot oligopoly competition
takes place in every area among all the producers of the world, where demand
is assumed linear.2 This setting is inspired from Brander (1981) and Brander
and Krugman (1983). Moreover, producers are subject to a capacity
constraint.3
CEMSIM is a bottom-up model of the cement industry, developed by the IPTS
(Szabo et al, 2003 and 2006). It pays particular attention to fuel and technology
dynamics. Seven technologies are included, characterised by energy, material
and labour consumptions, an investment cost and a set of retrofitting options.
We apply GEO to cement for three reasons. Firstly, GEO is particularly suited
to the cement sector because transportation costs and capacity constraints are
central to explaining international trade patterns of this homogeneous product.
Secondly, cement is an important greenhouse gas emitter, due to cement
consumption growth over the last decades and the very high carbon emissions
per tonne, both from fuel combustion and from the process itself. The sector’s
emissions from fuel combustion represented 2.4% of global carbon emissions
in 1994 (IEA, 1999). Adding process emissions, the sector reaches around 5%
of global anthropogenic CO2 emissions. Thirdly, the cement sector is
potentially one of the most impacted by a climate policy: among twelve EU 15
industry sectors, non-metallic minerals – mostly cement – have the
second-highest direct CO2 emission/turnover ratio, just after power production
(Quirion and Hourcade, 2004).
In section 2, we briefly describe how allowances are allocated in the EU ETS.
Section 3 presents a simple theoretical model in order to explain the main
describes the applied model and section 5 describes the scenarios and provides
the results of the simulations. Section 6 concludes.
2. Allowance allocation in the EU ETS
The most straightforward way of modelling an emission trading system (ETS)
is to assume that firms covered by an ETS behave as if they were covered by
an emission tax or auctioned emission allowances, i.e., that they factor the
value of allowances into their marginal production decisions, irrespective of
how many allowances they get for free. Such a behaviour is consistent with
profit maximisation as long as the number of free allowances the firm gets is
independent of its current behaviour (especially of its production level): freely
allocated allowances have an opportunity cost, so it is rational to add them to
the marginal production cost as though the firm had to buy them through an
auction or on the market. Throughout the paper, we shall label
"grandfathering" an allocation method in which the number of free allowances
the firm gets is independent of its behaviour.
Under such an allocation, combined with profit maximisation, whether the
allowances are auctioned or freely distributed does not impact production nor
emissions, but only profits and stock value. Tietenberg (2002: 3) makes this
case as follows:
"Whatever the initial allocation, the transferability of the permits allows them
to ultimately flow to their highest-valued uses. Since those uses do not depend
on the initial allocation, all initial allocations result in the same outcome and
These assumptions have been used in most assessments of the EU ETS, e.g. by
Bernard et al. (forthcoming); Klepper and Peterson (2004 and 2005); Reilly
and Paltsev (2005)4.
However, the assumption that the number of free allowances a firm gets is
independent of its current behaviour applies well to the US SO2 trading system,
but much less to the EU ETS, for at least three reasons (Åhman et al., 2005;
Schleich and Betz, 2005)5:
⇒ Allowances are first allocated for a three-year period (2005-07), and then every
five years, taking into account new information. In particular, if a firm reduces
its production, it may well receive fewer allowances in the next periods. In the
extreme case of a plant closure, no allowance will be allocated in the next
periods;
⇒ In all national allocation plans (NAPs), allowances are allocated for free to new
entrants, although according to different formulae (Åhman et al., 2005).
Furthermore, new entrants are defined extensively, including installations
increasing their permitted production capacity;
⇒ All national allocation plans but two (Sweden and the Netherlands, cf. Åhman
et al., 2005) state that if an installation is closed, it will stop receiving
allowances, from the subsequent year and thereafter6.
Compared to auctioning or grandfathering, all these features constitute an
incentive for firms to increase their production level. Unfortunately, modelling
the precise features of all 25 NAPs would be very difficult: the allocation
decided yet. Instead we shall model two polar cases, knowing that the actual
allocation method in the EU ETS stands somewhere in between:
⇒ Pure grandfathering (GF), as described above;
⇒ Output-based allocation (OB), under which firms receive an amount of
allowances, proportional to their current production.
These two scenarios are identical to those tested in other policy contexts by
Haites (2003 and Edwards and Hutton (2001).
3. Grandfathering vs. output-based allocation: the basic theory
A simple theoretical model will help to understand how the two allocation
methods differ. Let us take a set of N homogeneous firms competing under
Cournot competition with a linear demand curve on the goods market. These
firms choose an output and an abatement level in order to maximise their profit:
( )
( )
2(
)
, . CO . q ua Maxπ
=P Q q−q c ua −P e−gf −q ob (1) With:(
0)
e≡q ue −ua (2) N Q=∑
q (3)( )
. P Q = −a b Q (4)where P(Q) is the inverse demand, decreasing, Q the aggregate output, q a
firm's output, c the marginal production cost, assumed constant with respect to
production and increasing with ua (for unitary abatement), which is the
exogenous7, e the level of emissions per firm, gf the amount of allowances
grandfathered (if any) to a firm, ob (for output-based) the amount of
allowances distributed for each unit of output (if any), ue0 the baseline unitary
emission. a > 0 and b > 0 are the parameters of the demand curve.
The case of pure auctioning can be studied by setting both gf and ob to zero;
grandfathering, by setting ob to zero; and output-based allocation, by setting gf
to zero.
Profit maximisation leads to the following first-order conditions:
2 0 c ua'( ) PCO ua π ∂ = ⇔ = ∂ (5)
Equation (5) is the usual condition of equalisation of the marginal abatement
cost to the price of CO2, which is unaffected by the allocation method. This
result is consistent with (and is indeed the basis of) Tietenberg's conclusion
above.
( ) ( )
2(
0)
0 P Q c ua b q. PCO ue ua ob qπ
∂ = ⇔ = + + − − ∂ (6)Summing (6) over the N firms and solving using (4) yields:
. 1 a N ec P N + = + (7) a P Q b − = (8)
Where ec, the extended variable production cost, is defined as:
( )
CO2(
0)
ec≡c ua +P ue −ua−ob (9)
⇒ Under auctioning or grandfathering, i.e., if ob = 0, firms add the value of
emissions per unit of output (ue0 – ua) to their marginal production cost.
Furthermore, the marginal production cost increases with abatement, which
raises the output price further. To what extent these extra costs are passed on to
consumers depends on the number of firms N.
⇒ gf does not influence the output price, nor the output level. This is because
grandfathered allowances have an opportunity cost. This is consistent with
Tietenberg's quotation above. However, from (1), compared to auctioning,
grandfathering increases the profit level.
⇒ Compared to auctioning or grandfathering, output-based allowances (a higher
ob) reduce the price level and increase the output. If the sector considered is neither a net buyer nor a net seller on the allowance market (ue0 – ua = ob),
then P rises above its business-as-usual level only in so far as the marginal
production cost increases with abatement. If the sector considered is a net
buyer of allowance (ue0 – ua > ob), then firms add to their marginal production
cost the value of the allowances they must buy (ue0 – ua – ob), as in IEA
(2004). If, conversely, the sector is a net allowance seller (ue0 – ua < ob),
output may rise compared to business as usual. At last, when ob tends to zero,
the impact on P and Q tends to that of grandfathering or auctioning.
These conclusions are consistent with the theoretical models by Sterner and
Höglund (2000; Fischer (2001); Gielen and al. (2002), except that we take the
allowance price as exogenous, which is justified by the fact that the sector we
study represents only a small share of the ETS (around 2% of total allowances).
Otherwise, for a given overall level of emissions, output-based allocation
unitary abatement is identical for a given allowance price (eq. 5) and output is
higher under OB (eq. 7, 8 and 9), unitary abatement, and thus allowance price,
must be higher under OB to obtain the same level of total abatement.
Because in these early models there is neither imperfect competition nor CO2
leakage, OB leads to a higher cost, for a given abatement, than grandfathering.
The inclusion of these two features may yield to a different conclusion, as
demonstrated by Fischer and Fox (2005); Edwards and Hutton (2001) with
general equilibrium models.
4. Presentation of CEMSIM-GEO
Cement is a product which is quite homogeneous throughout the world. The
existence of different prices is mainly justified by the importance of
transportation costs. Whereas a tonne of cement is sold around €80 at the exit
of a plant in France, it costs €10 to transport it by road over 100km. The cost is
much lower by sea: transporting cement from a harbour in East Asia to
Marseille is the same as from Marseille to Lyon. Such a characteristic must be
taken into account when assessing the impact of an asymmetric climate policy
on the cement industry: whereas coastal regions could be severely impacted,
inland ones seem to be relatively protected.
In GEO, the trade model we developed (Demailly and Quirion, 2005a and
2005b), cement is a homogeneous product: the firms of the 47 producing
countries are assumed to manufacture perfectly substitutable products. The
1,600 real sea harbours and more “land harbours” are represented, which allow
us to compute realistic transportation costs.
In the new version of GEO we use here, we assume that a Cournot oligopoly
competition takes place in every area among all the producers of the world.
Producers compete on the market of an area given their extended variable
production cost and their transportation cost from their plants to the market.
Demand is assumed linear. This modelling is inspired by Brander (1981) and
Brander and Krugman (1983). Moreover, producers are subject to a capacity
constraint. When its capacity constraint is binding, a producer gives the
priority to its domestic areas and sells its production in the most profitable
areas. A cement firm may extend its available capacity to export by using
plants located more deeply inside its territory, and consequently by increasing
production cost through higher transportation costs. However, its exports are
capped by its total capacity.
The use of the Cournot model instead of other competition representations
(Bertrand, Stackelberg, limit price…) is not only justified by the support of the
literature or its tractability, but also by the fact that it is compatible with the
following quotations from cement manufacturers and analyst (OXERA, 2004):
“Cement is a local commodity market (…)– haulage costs are significant…, therefore [we] expect significant cost pass-through”
“Cement travels on water, not well on land… imports set the price anywhere close to water with a decent port facility…”
“As import prices often cap selling prices, margins will be squeezed as costs rise … we expect no change in current cement prices”
Indeed, let us take the example of a French inland area protected by
transportation costs where no foreign firm is cost-competitive enough to be
part of the equilibrium in this area. Demand is linear: P= − ⋅a b Q. The N identical French firms, with an extended variable production cost ec, equally
share the market where the price P is given by:
1 a N ec P N + ⋅ = + (cf. above,
section 3). A rise in ec leads to a N/(N+1) cost pass-through.
Let us now assume that N’ firms of a given foreign country, with a variable
production cost c’ and a transportation cost tc, are cost-competitive enough to
be part of the equilibrium on the market of a French coastal area. Price is given
by:
(
)
' ' ' 1 a N ec N c tc P N N + ⋅ + ⋅ + =+ + . A rise in ec leads to a N/(N+N’+1) cost
pass-through. The profit margin of French firms in this area is much more impacted
than in the previous case.
The inland case corresponds to the first quotation above, the coastal case to the
second and third ones.
CEMSIM is a bottom-up model of the cement industry, developed by the IPTS
(Szabo and al, 2003 and 2006). It pays particular attention to fuel and
technology dynamics. Seven technologies are included, characterised by
energy, material and labour consumptions, an investment cost and a set of
retrofitting options. The technologies considered in CEMSIM are already used
on a large scale. Assuming no large-scale commercial application in a near
future, the model does not take into account emerging technologies like
al, 2006). We modified the original CEMSIM model to introduce more
flexibility in the content of clinker – the carbon intensive intermediary product
– in cement and in the choice of non-primary fuels, following discussions with
French cement industrials.
We use the CEMSIM database on consumption, production capacity and
energy demand, energy prices from the POLES model developed by the
LEPII-EPE as well as cement bilateral trade data form OECD to calibrate the
CEMSIM-GEO model, which is then recursively run with a yearly step.
Given the trade and technological details of CEMSIM-GEO, it is - for
tractability’s sake - a partial equilibrium model. Therefore we neglect the
macroeconomic feedbacks, such as possible changes in GDP or exchange
rates , but these impacts must be very soft – see, for example (IPCC, 2001) for
GDP impacts. Furthermore, we do not explicitly model the substitutions
between cement and other building materials, but since all the CO2 intensive
industries are covered by the EU ETS, substitutions should be limited. As a
consequence, it does not seem injudicious to work in partial equilibrium.
We highlight the fact that, in GEO, cement is assumed to be homogeneous
throughout the world: we neglect product quality or differentiation as a trade
determinant. We calibrate non-transport barriers to match real bilateral trade
data, assuming that, as soon as an exporter is competitive enough to export 1kg
of cement to the harbour of a country, the only barrier to trade it faces to export
many more barriers seem to exist in real cement trade. Foreign exporters
cannot build up supply networks overnight. EU firms have the ability to keep
the production of “aggressive” foreign producers out of home markets, for
example by restricting their access to port facilities by occupying them. EU
firms, which are highly concentrated and have developed their activities in
non-EU countries, have the ability to keep imports out of home markets
through collusive behaviours (EC, 2000). These features lead to overestimation
of the trade impacts of climate policies. Moreover, if the one-stage Cournot
model is of interest notably for addressing the cost pass-through issue, its
ability to provide quantitative results is more controversial. We also stress that
the quantification of some technical flexibility in CEMSIM (clinker ratio,
retrofitting, and fuel choice) is very difficult. As a consequence, whereas our
qualitative results are robust, our quantitative results should be considered very
cautiously.
5. Simulations and results
In the next sections we present, for various scenarios, the results for
2008-20128 of some model outputs: cement production cost, prices, consumption,
production, EBITDA and CO2 emissions in EU27.
In the first set of scenarios, an EU27 ETS is implemented with allowances
grandfathered. These scenarios are the “GF” scenarios. The scenario with firms
being grandfathered 90% of their emissions in 2004 is the GF 90% scenario.
not depend on the amount of allowances allocated. When presenting such an
output, to highlight this fact, we label this scenario “GF” instead of “GF 90%”.
In the second set of scenarios, a firm's allocation is assumed to be proportional
to its current cement production. These scenarios are the “OB” scenarios. In
our central OB scenario, the output-based allocation of allowances is assumed
to represent, for every firm, 90% of its 2004 emissions per tonne of cement
(unitary emissions). This is the “OB 90%” scenario.
For the 2005-2007 period, the CO2 price is modelled at an average of €20/tCO2,
close to the average value observed in 2005. Then, we make different
assumptions for the CO2 price between 2008 and 2012: from 10 to €50/tCO2.
According to the last observations on the EU electricity market and to the
emerging windfall profits debate in the EU, we assume that power generators
have the ability to pass on to electricity prices 100% of their extended cost rise.
For convenience’s sake, this rise in a given country equals the CO2 price
multiplied by the national unitary emission of the power sector, whatever is the
allocation method for the cement industry – as if the allowances in the
electricity sector were always grandfathered.
For simplicity, we assume that non EU27 countries do not implement any
climate policy, which leads to an overestimation of trade impacts and CO2
leakage.
Some of the insights, especially under OB 90%, do not depend only on the
CO2 price but also on the amount of allowances allocated, so we made some
judge the most important when studying the impacts on competitiveness of
climate policies: production and EBITDA.
Under the Business-as-Usual scenario (BaU), no climate policy is
implemented.
We stress that the comparison between the two central scenarios, OB 90% and
GF 90%, should be made cautiously, because nothing guarantees that they lead
to the same environmental improvement. It is even more delicate to compare
the OB and GF scenarios with the same CO2 price assumption, because these
systems, if implemented also for other sectors in the EUETS, would lead to
different prices (cf. section 3 above).
5.1. Cost-competitiveness
We label “extended variable production cost”, or simply “extended cost”, the
cost with which firms compete on world cement markets, minus transportation
costs, expressed in euro per tonne of cement. This determines the
cost-competitiveness of firms.
(a) Grandfathering (GF).
As explained previously, under GF, the extended cost of EU cement
manufacturers is defined by:
Extended cost = variable production cost + CO2 opportunity cost,
CO2 opportunity cost = CO2 price * emission per tonne of cement (unitary
Figure 2 shows how the opportunity cost increases with the CO2 price. The rise
is less than proportional. When the CO2 price increases, cement producers are
pushed to reduce their unitary emission by (1) diminishing the clinker content
of cement – clinker being the CO2-intensive intermediary product in cement
production- – (2) switching from high to low carbon intensive fuels, (3) using
more energy-efficient technologies. In 2008-2012, however, the reduction in
unitary emission is mostly due to the decrease in the clinker rate in cement
(-10% for €20/tCO2). This decrease is provoked not only by the rise in the
extended cost of clinker – due to the opportunity cost of emission, the increase
in electricity prices and the use of more expensive low-carbon fuels – but also
to the drop in the consumption and price of added materials, the non-clinker
materials in cement, due to significant cement production losses, as we will see
below9. Decompositions of the extended cost under BaU and GF 20 are
provided in Figure 3, mixing the different technologies and fuel sources.
For €20/tCO2, the extended cost rises by €14 per tonne of cement. This rise not
only leads EU firms to reduce their output but also impacts their
cost-competitiveness compared with that of foreign firms. In GEO, where road
transportation cost is the only barrier to trade for exporters, this rise
considerably facilitates the penetration of foreign cement into EU markets.
Indeed, in the EU, €14/t allows an increase in the transport of cement by road
by around 200km.
These results, as well as the following except EBITDA, are independent of the
(b) Output-based (OB) allocation
Under OB, the extended cost is defined by:
Extended cost = variable production cost + CO2 price*(unitary emission - OB
allowance)
We observe in Figure 2 that, according to CEMSIM-GEO, technical flexibility
allows EU producers to decrease their unitary emission to 90% of their 2004
unitary emission for €20/tCO2. It guarantees that the amount of output-based
allowances allocated covers their emissions: they are neither buyer nor seller
on the CO2 market, and their extended cost simply equals their variable
production cost.
Whereas firms buy some emission allowances for lower CO2 prices, from
€30/tCO2, the average unitary emission in the EU is lower than the amount of
allowances allocated per tonne of cement. Cement manufacturers become
sellers on the CO2 market, which supposes that there are buyers like the power
suppliers. Therefore, although the EU variable production cost rises, its
extended cost slightly decreases.
Obviously, this result depends on the allocation per tonne of cement: for a
decreasing allocation, results tend to get closer to the GF case. However,
according to the sensitivity test we made, we may consider that extended cost
of EU producers is not highly impacted under OB for amounts of output-based
allowances over 75% of the 2004 unitary emission: the expected10 rise remains
below 10%.
To underline this point, whereas the extended cost, and therefore the
under OB for an output-based allocation, provided the allocation factor is over
75% of 2004 unitary emissions.
5.2. Prices
(a) Grandfathering (GF)
The results in Figure 4 show that, under GF, the average price applied by EU
firms in their countries of origin increases significantly, following the rise of
their extended cost. The cost pass-through is limited by oligopolistic
competition and by international pressure: on average 75% of the extended
cost rise is passed on to consumers. Around half of this limitation is due to
oligopolistic competition, the other half to international pressure.
However, if the margin over the extended cost tends to decrease, the margin
over the variable production cost increases.
(b) Output-based (OB) allocation
As shown previously, the extended cost of EU firms under OB 90% is not
significantly impacted. Figure 4 shows, unsurprisingly, that the EU domestic
price presents the same evolution. However, if the margin over the extended
cost remains quasi constant, the margin over the variable production cost
decreases slightly because the latter increases.
Obviously, these results depend on the amount of allowances allocated per
tonne of cement. But, according to sensitivity tests, cement prices are not
over 75% of the 2004 unitary emission: the expected rise of cement prices
remains below 5%.
To sum up, the EU domestic price and the margin over the variable production
cost increase very significantly under GF. Under OB, for output-based
allocation over 75% of 2004 unitary emission, they are weakly impacted.
5.3. Consumption, production and trade
(a) Grandfathering (GF)
As we have seen, the impact of GF on the cement price in the EU is very
significant. However, because of the low elasticity price of demand (0.2),
consumption is not highly affected: it drops by 3% for €20/tCO2. Should the
elasticity be higher – and it could be, especially in the mid–long term - so
would be the impact on consumption.
However, the cost-competitiveness drop of EU producers heavily impacts EU
cement trade flows (Figure 5). Under BaU (no ETS), EU countries on average
import 11% of their cement consumed, 75% of these imports coming from
other EU countries. At a carbon price of €20/tCO2, on average, EU countries
import 18% of their consumption, of which 75% comes from non-EU countries.
EU exports (not displayed here) are halved and focus mainly on other EU
countries - 90% of exports vs. 70% in BaU.
Obviously, results vary a great deal between countries and the aggregate
results underplay the regional dimension within Europe. In the countries with
high rates of import from non-EU countries before the implementation of a
Therefore, they are less protected by transportation costs and are more
sensitive than countries with low rates of non-EU imports. The trade impact
also depends on the size and location of the country, and the location of its
population (due to transport costs, inland countries or large countries with
population living mostly inland are proportionally less impacted than the small
ones near the coast) and on its extended cost increase.
Therefore, whereas the production of the EU cement industry decreases in
average by 15% for a €20/tCO2 price, Austrian production almost maintains
the same level, while Spanish production drops by almost 20%. On the one
hand, Austria does not share borders with non-EU countries, does not have sea
harbour facilities and imports very little cement from non-EU countries before
the implementation of the ETS. On the other hand, Spain is a relatively large
country but has a lot of sea harbours and imported in 2004 almost 20% of its
cement consumption, mainly from non-EU countries.
We again emphasise some caveats of our trade modelling which lead to an
overestimation of trade impact of climate policies: we neglect product quality
or differentiation as a trade determinant, and non-transport barriers to trade
which prevents foreign producers from increasing their exports, such as the
difficulties in building a commercial network or the ability of EU firms to keep
imports away out of home markets. Moreover, if the one-stage Cournot model
is of interest notably for addressing the cost pass-through issue, its ability to
provide quantitative results is more controversial. Finally, cement firms tend to
with. Hence, cement imported from non-EU countries does not necessarily
come from non-EU firms.
In conclusion, whereas the qualitative results are robust and allow comparison
between the different scenarios, our quantitative results should be considered
very cautiously.
(b) Output-based (OB) allocation
In sharp contrast, under OB 90%, EU consumption and imports are
insignificantly impacted (Figure 5). This conclusion also holds for exports (not
displayed here). However this does not hold for much tighter OB allocations
(Figure 6). For allocation below 75% of 2004 unitary emission, the expected
drop in production becomes significant (above 5%).
To sum up, whereas the impact on consumption is small because of the very
low elasticity price of demand (and insignificant under OB), the impact on net
import and production is great under GF, and the protection afforded by OB
allocation declines if the allocation is under 75% of 2004 unitary emissions.
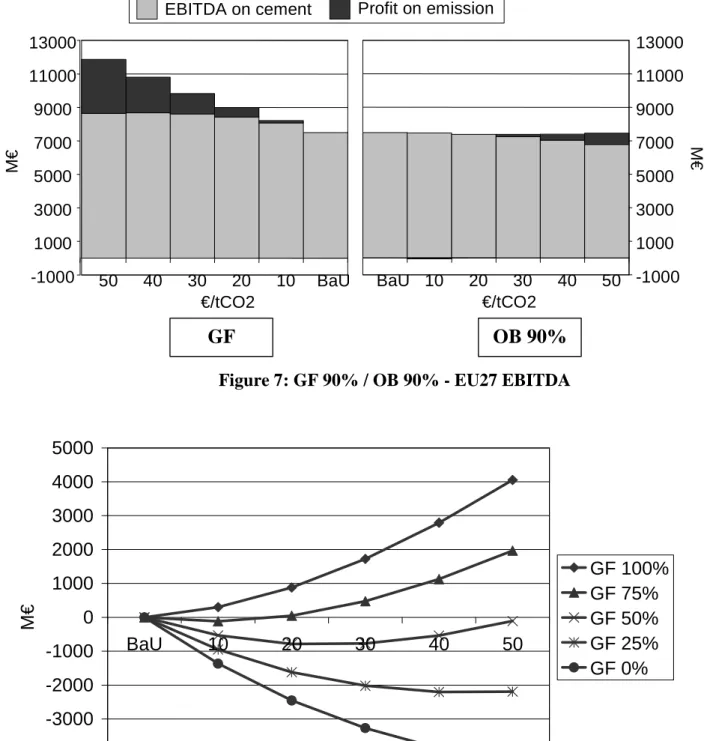
5.4. Operating profitability (EBITDA) 11
(a) Grandfathering (GF)
Under GF, EU firms see their production decreasing and their margin over
variable production cost increasing with CO2 prices. These facts have opposite
EBITDA on cement =
∑
World areas (Price - Variable cost - Transportationcost)*Production
As we may see in Figure 7, the EBITDA on cement increases with low CO2
prices and then decreases.
The net profit realised on the emission market, or simply the “profit on
emission”, is given by:
Profit on emission = (GF allocation – CO2 emission)*CO2 price
Note that this is the only output of the model presented here which depends on
the volume of GF allocation. For a GF allocation equal to 90% of historic
emissions, cement manufacturers emit less than their allocation, because their
production and their unitary emission drop enough for all the CO2 prices tested.
They are thus sellers on the CO2 market, so their profit on emission is positive.
Their emissions decrease and their profit on emission increases with rising CO2
prices. As a result, the total EBITDA increases significantly with CO2 prices,
as does the share of profit arising from emission sales.
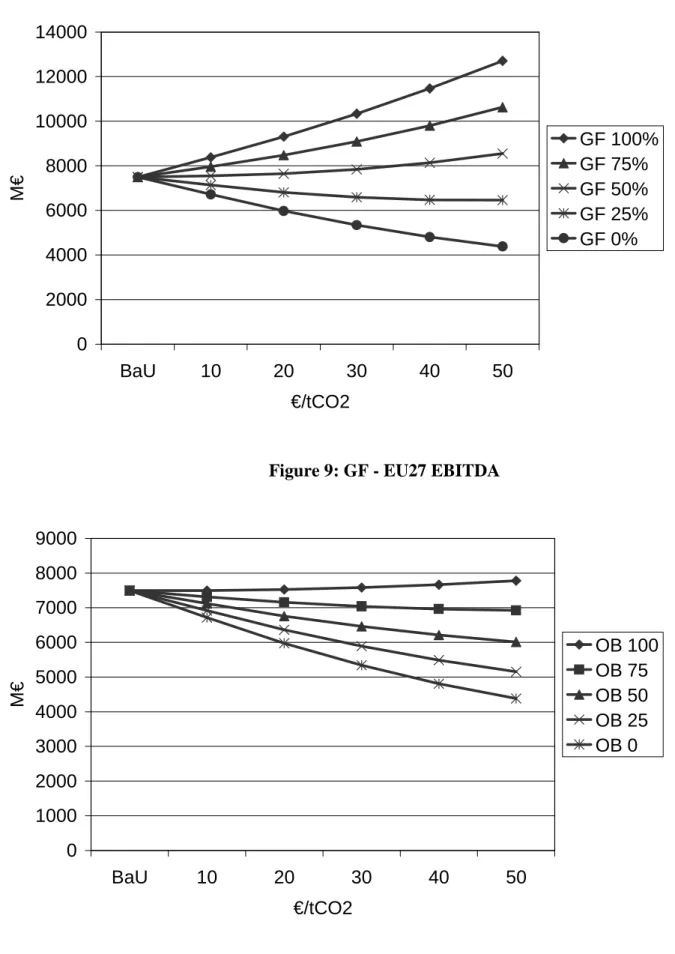
Obviously, this depends strongly on the amount of GF allowance allocated
(Figures 8 and 9). If granted allowances equal to 50% of 2004 emissions, EU
cement producers are significant buyers of CO2 emission allowances but this
remains more than offset by the value of the higher prices, and their EBITDA
still rises; however, at allocations below this, they lose.
Once again, we stress that these aggregate results underplay the regional
dimension within Europe. Whereas the EU EBITDA increases by 20% under
makes no profit on emissions - because its production is almost not impacted –
while the Spanish cement industry - whose production is largely impacted -
does increase its EBITDA by around 10%, thanks to allowances sales. For an
allocation of 50% of 2004 emissions, Austrian cement producers keep on
benefiting from the system, whereas the Spanish lose.
(b) Output-based (OB) allocation
As observed before, the margin over variable production cost decreases under
OB. As displayed in Figure 7, there is little impact on EBITDA at low CO2
prices, but for high prices, in spite of the slight production rise we have
observed, EBITDA on cement decreases. As we have already seen, EU27
cement manufacturers turn out to be neither seller nor buyer of allowances for
€20/tCO2, but for higher CO2 prices, they become sellers and profit on
emissions sales:
Profit on emissions = (OB allocation - unitary emission)*production*CO2
price
This is positive and increases with price because they sell more and at higher
value. The aggregate impact on EBITDA is weak under OB 90%, even for
high CO2 prices.
Obviously, this conclusion about EBITDA depends on the amount of OB
allowances allocated, which impacts both the profit on emissions and the
EBITDA on cement12. Figure 10 indicates that, for allocation over 75% of
2004 unitary emission, our qualitative conclusion remains valid: the expected
To sum up, under GF and for allocations over 50% of past emissions, the EU
EBITDA increases. Under 50%, it decreases. It is not highly impacted under
OB as long as the amount of output-based allowances allocated is over 75% of
2004 unitary emission.
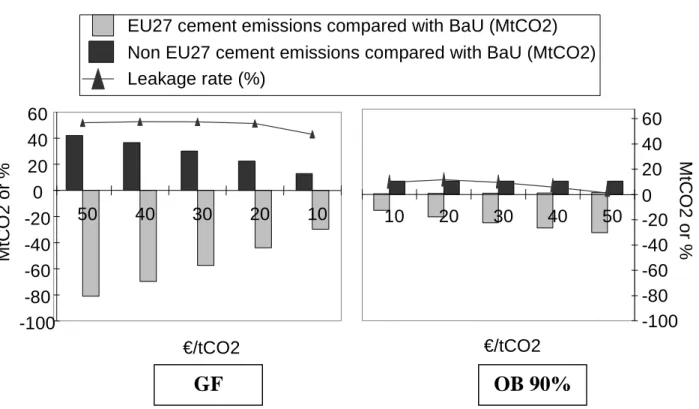
5.5. CO2 emissions (a) Grandfathering (GF)
Under GF, the drop in EU CO2 emissions by the cement industry is very
important: -25% for €20/tCO2. Half of this drop is due to the decrease in
unitary emission, the other half to the production drop (mostly the rise of net
imports). This explains the very important carbon leakage rate13 observed in
Figure 11: around 50%. It means that half of the emissions reduction made
inside EU is offset by an emissions rise outside.
We stress that not only is our trade representation (no product differentiation,
focus on transport, no inertia in trade…) responsible for this important leakage
around 2010, but so, also is the technical inertia: leakage decreases as time
goes by with the introduction of more carbon-efficient techniques. Furthermore,
the reader should keep in mind that we assume no climate policy outside the
EU which explains a part of this high leakage rate.
Under OB 90%, there is no significant production drop. The emissions
reduction is only due to the improvement of the carbon efficiency of the EU
cement industry. Therefore, for €20/tCO2, it is halved compared with GF but
the leakage rate is much smaller, around 9%, and decreases with high prices
(Figure 11). Finally, for a given CO2 price, world emissions reductions are
almost similar under GF and OB90% - slightly higher under GF.
Again we stress that some results depend on the OB allocation: the tighter the
allocation, the closer are the EU emissions reductions and carbon leakage to
the GF scenarios.
To sum up, under GF, the huge emissions drop is partially offset by an
important carbon leakage. Under OB, for generous allocations, the drop is
much weaker and so is the leakage. The tighter the allocation, the closer are the
EU emissions reductions and carbon leakage to GF. For every GF or OB
scenarios, world emissions reductions turn out to be almost similar.
6. Conclusion
We have seen that the allowance allocation system of the EU ETS is neither
grandfathering nor output-based allocation. But is it - and will it be in phase 2 -
closer to the former or to the latter? This issue turns out to be a crucial one.
If the allowance allocation system is similar to grandfathering, EU cement
producers (and many other firms also) will in aggregate benefit from a
significant rise in their EBITDA, but lose market share to imports. Indeed, our
past emissions to cement producers is enough to maintain their EBITDA to the
business-as-usual level. Given that the Directive prevents Member States from
auctioning more than 10% of the allowances for 2008-2012, and that the
analyses of National Allocation Plans for 2005-07 show that industry has
benefited from an allocation level close to BaU (Reilly and Paltsev, 2005;
Schleich and Betz, 2005), cement producers will certainly receive more than
50% of their past emissions in the next generation of NAPs. However, our
simulations also indicate a significant production loss and CO2 leakage rate
under grandfathering. As a consequence, although CO2 emissions reductions
are high under grandfathering in EU27 (around -25% for €20 per tonne of
CO2), about one half of this drop is compensated by a rise in emissions
elsewhere.
If, conversely, the allowance allocation system is similar to output-based
allocation for an allowance allocation ratio of 90% of historic unitary
emissions, neither the production level nor the EBITDA is significantly
impacted, even for a very high CO2 price (€50 per tonne). Only if the
allocation ratio were to drop below 75% of historic unitary emissions (a very
unlikely policy choice) would competitiveness impacts (on production and
EBITDA) be severe (above 5%). For any allocation ratio, abatement is reduced
compared to auctioning or grandfathering, but so is leakage, and finally world
emissions are almost similar.
Finally the allocation method - notably the updating criteria, the treatment of
new entrants and the closure rules – turns out to be a variable of importance to
determine the competitiveness impacts and the CO2 emissions reduction
Three important caveats are in order:
• First, despite the high level of regional disaggregation and incorporation of transport costs and port facilities in the GEO model, modelling trade
impacts – and therefore the carbon leakage of climate policies - is still
difficult, particularly over a relatively short period such as 2008-12.
Notably because the explicit representation of some non-transport barriers
to trade - like the ability of EU firms to keep imports out of from “home”
markets through collusive behaviours or anti-competitive practices – is
very difficult. Thus though the qualitative results are robust, the
quantitative ones should be considered very cautiously.
• Second, the allowance price depends on the allocation method, not in the cement sector, but in the whole set of sectors covered by the EU ETS,
especially power production. For a given emissions cap (or amount of
allowances allocated), the allowance price would be higher under
output-based allocation than under grandfathering.
• Third, implementing output-based allocation in the cement sector raises a difficult dilemma, due to the fact that 90% of cement emissions occur
during the production of cement's main input, clinker, and that lowering the
proportion of clinker in cement is one of the main means of cutting CO2
emissions. If allowances are allocated in proportion to cement production,
a producer may import clinker to make cement in Europe in order to
receive free allowances and sell them. Leakage would then not be
clinker production, the incentive to reduce the clinker rate in cement
vanishes, and so does a large part of CO2 abatement. This problem is not
taken into account in our simulations, since we model only trade in cement,
not in clinker.
Ultimately, there exist at least one other means to address the competitiveness
problem, other than free allocation of allowances. A tax or auctioned
allowances with a border-tax adjustment as assessed in Demailly and Quirion
(2005a and 2005b) offers the best of both worlds: compared to grandfathering,
it prevents leakage, and compared to output-based allocation, it induces
consumers to take into account the CO2-intensity of the different building
materials in their decisions, and does not suffer from the above-mentioned
Notes
1
The present analysis has benefited from a deep collaboration with the
Institute for Prospective Technological Studies (IPTS – Joint Research Centre
– European Commission). Our analysis is partly based on the world cement
model CEMSIM developed by L. Szabo, I. Hidalgo, J. C. Ciscar, A. Soria and
P. Russ, from the IPTS. We thank them and the IPTS for the explanations on
the model, for the free access to a world cement industry database compatible
with the model structure and for having hosted one of us at the IPTS for two
months. We also thank an anonymous referee, Michael Grubb, Karsten
Neuhoff, Neil Walker, Peter Zapfel and participants at two meetings organised
by Climate Strategies in Oxford and London for their comments, as well as
Françoise Le Gallo for providing data on international cement trade.
2
See Smale, this Volume, for explanation and discussion.
3
In this paper, the capacity constraint is fixed: since we do not run the model
beyond 2012, endogenising investment as in Demailly and Quirion (2005a and
2005b) would not make a significant difference.
4
The authors are aware of this limitation and write (Reilly and Paltsev, 2005:
11) "we also cannot estimate the potential distortionary effects of non-lump
sum distribution of some of the permits (those that under some countries'
5
Furthermore, the assumption of profit maximisation may also be challenged:
some managers may be reluctant to reduce production in order to sell
allowances and increase the profit level, and use their information advantage
over shareholders to maintain production above the profit-maximising level, as
in Baumol (1962).
6
Apart from if a firm closes an installation and opens a new one in the same
Member State, it may retain these allowances, but then will not get allowances
for the new installation.
7
In this model and in the rest of the present paper, we assume that the
considered sector is too small to influence the allowance price. Indeed, it
represents around 2% of the allowances allocated in the EU ETS.
8
More precisely, the figure presented for a given output variable in a given
scenario is the average value of the output variable between 2008 and 2012.
9
For further details on technological evolutions, see Demailly and Quirion
(2005a), where the decreases in added materials prices due to production losses
are not taken into account.
10
To calculate the expected impact of a policy with an uncertain CO2 price, we
give a probability (a weight) to every price tested. We assume that probabilities
average price of 2008 forwards from the beginning of 2006 – and that the
probability that price is between €15 and €35 equals 50%.
11
Earning Before Interest, Tax, Debt and Amortisation
12
The lower it is, the lower is the production and the higher is the margin on
production cost, so that the effect on the EBITDA cement is not trivial, as
under GF. Conversely, the lower is the OB allocation, the lower is the profit on
emission.
13
Leakage rate = increase in non EU27 emissions / decrease in EU27
Figures
Figure 1: Areas of GEO
€/tCO2 €/tCO2 -10 0 10 20 30 40 50 60 70 BaU 10 20 30 40 50 € /t o f c e m e n t -10 0 10 20 30 40 50 60 70 BaU 10 20 30 40 50 € /t o f c e m e n t
Variable production cost CO2 opportunity cost
GF OB 90%
0 10 20 30 40 50 60 BAU GF 20 € /t o f c e m e n
t CO2 opportunity cost
Added materials Raw material Maintenance Electricity Fuel
Figure 3: GF – structure of the EU27 extended cost
0 10 20 30 40 50 60 70 80 90 100 BaU 10 20 30 40 50 €/tCO2 € /t o f c e m e n t
Variable production cost + Margin
€/tCO2
GF
OB 90%
0 10 20 30 40 50 60 70 80 90 100 BaU 10 20 30 40 50 € /t c e m e n t0 50 100 150 200 250 BaU 10 20 30 40 50 €/tCO2 M t o f c e m e n t
Domestic production Import from EU Import from non EU
0 50 100 150 200 250 BaU 10 20 30 40 50 M t o f c e m e n t €/tCO2
GF
OB 90%
Figure 5: GF / OB 90% - EU27 consumption and trade
0 50 100 150 200 250 300 BaU 10 20 30 40 50 €/tCO2 M t o f c e m e n t OB 100 OB 75 OB 50 OB 25 OB 0
-1000 1000 3000 5000 7000 9000 11000 13000 BaU 10 20 30 40 50 €/tCO2 M €
EBITDA on cement Profit on emission
-1000 1000 3000 5000 7000 9000 11000 13000 BaU 10 20 30 40 50 €/tCO2 M €
GF
OB 90%
Figure 7: GF 90% / OB 90% - EU27 EBITDA
-5000 -4000 -3000 -2000 -1000 0 1000 2000 3000 4000 5000 BaU 10 20 30 40 50 €/tCO2 M € GF 100% GF 75% GF 50% GF 25% GF 0%
0 2000 4000 6000 8000 10000 12000 14000 BaU 10 20 30 40 50 €/tCO2 M € GF 100% GF 75% GF 50% GF 25% GF 0%
Figure 9: GF - EU27 EBITDA
0 1000 2000 3000 4000 5000 6000 7000 8000 9000 BaU 10 20 30 40 50 €/tCO2 M € OB 100 OB 75 OB 50 OB 25 OB 0
-100 -80 -60 -40 -20 0 20 40 60 10 20 30 40 50 €/tCO2 M tC O 2 o r %
EU27 cement emissions compared with BaU (MtCO2) Non EU27 cement emissions compared with BaU (MtCO2) Leakage rate (%) -100 -80 -60 -40 -20 0 20 40 60 10 20 30 40 50 €/tCO2 M tC O 2 o r %
GF
OB 90%
References
Ahman, M., Burtraw, D., Kruger, J.A. and Zetterberg, L., 2005. In: 'The
ten-year rule – Allocation of emissions allowances in the EU emissions trading
system, RFF, Discussion Paper 05-30.
Baumol, 1962. In: 'On the theory of expansion of the firm', American
Economic Review, 52(5)
Bernard, A., Vielle, M., and Viguier, L., In: 'Premières simulations de la
directive européenne sur les quotas d’émission avec le modèle GEMINI-E3',
Forthcoming,
http://ecolu-info.unige.ch/~nccrwp4/GEMINI-E3/GEMINIquotasfinalDec2004.pdf.
Brander, J., 1981. In: 'Intra-industry trade in identical commodities', Journal
of International Economics, 11: and-14.
Brander, J. and Krugman, P., 1983. In: 'A 'reciprocal dumping' model of
international trade', Journal of International Economics, 15: 313-21.
Criqui, P. and Kitous, A., 2003. In: 'Impact of linking JI and CDM credits to
the European emissions allowance trading scheme (KPI-ETS) ', Report for the
European Commission.
Demailly, D. and Quirion, P., 2005a. In: 'The competitiveness impacts of CO2
emissions reductions in the cement sector', Report for the OECD,
Demailly, D. and Quirion, P., 2005b. In: 'Leakage from climate policies and
border tax adjustment: lessons from a geographic model of the cement
industry', CESifo Venice Summer Institute, July.
European Commission, 2000. In: 'The Court of first instance reduces the fine imposed on the Cement cartel by almost eur 140 million', Press release No 16/00. http://curia.eu.int/en/actu/communiques/cp00/aff/cp0016en.htm
Edwards, T. H. and Hutton, J. P., 2001. In: 'Allocation of carbon permits
within a country: a general equilibrium analysis of the United Kingdom',
Energy Economics, 23(4): 371-386.
Fischer, C., 2001. In: 'Rebating environmental policy revenues: Output-based
allocations and tradable performance standards', RFF, Discussion paper 01-22.
Fischer, C. and Fox, A., 2004. In: 'Output-Based Allocations of Emissions
Permits: Efficiency and Distributional Effects in a General Equilibrium Setting
with Taxes and Trade', RFF, Discussion paper 04-37.
Gielen, A., Koutstaal, P. and Vollebergh, H. R. J., 2002. In: 'Comparing
emission trading with absolute and relative targets', London, Paper presented to
the second CATEP Workshop, 25-26 March.
Haites, E., 2003. In: 'Output-based allocation as a form of protection for
internationally competitive industries', Climate Policy, 3S2: S29–S41.
International Energy Agency, 1999. In: 'The reduction of greenhouse gas
emission from the cement industry', IEA, Greenhouse Gas R&D Programme.
International Energy Agency, 2004. In: 'Industrial Competitiveness under the
IPCC, 2001. In: ‘Climate Change 2001: Mitigation’, Contribution of Working
Group III to the Third Assessment Report of the IPCC.
Klepper, G. and Peterson, S., 2004. In: 'The EU emissions trading scheme –
allowance prices, trade flows, competitiveness effects', FEEM, Working paper
49.2004.
Klepper, G., and Peterson, S., 2005. In: 'Emissions trading, CDM, JI, and more
– The climate strategy of the EU', FEEM, Working paper 55.2005.
Krugman, P., 1994. In: 'Competitiveness: A dangerous obsession', Foreign
Affairs, 73(2)
McKinsey and Ecofys, 2005. In: 'Review of EU emissions trading scheme',
European Commission, DG Environment, November
Oxera, 2004. In: 'The European Emissions Trading Scheme: Implications for
Industrial Competitiveness', Report for the Carbon Trust.
Prebay, Y., Ando, S., Desarnaud,E., Desbarbieux, T., 2006. In: 'Les enjeux du
développement durable au sein de l’Industrie du Ciment : réduction des
émissions de CO2', Atelier Changement Climatique de l’Ecole des Ponts.
http://www.enpc.fr/fr/formations/ecole_virt/trav-eleves/cc/cc0506/ciment.pdf
Quirion, P. and Hourcade, J.-C., 2004. In: 'Does the CO2 emission trading
directive threaten the competitiveness of European industry? Quantification
and comparison to exchange rates fluctuations', EAERE, Annual Conference,
Budapest
Reilly, J.M. and Paltsev, S., 2005, In: 'An analysis of the European Emission
Trading Scheme', MIT, Joint Program on the Science and Policy of Global
Schleich, J. and Betz, R., 2005, 'Incentives for energy efficiency and
innovation in the European Emission Trading System'. In: Proceedings of the
ECEEE Summer Study, Mandelieu, 2005, www.eceee.org
Sterner, T. and Höglund, L., 2000. In: 'Output-based refunding of emission
payments: theory, distribution of costs, and international experience', RFF,
discussion paper 00-29.
Szabo, L., Hidalgo, I., Ciscar , J.C., Soria, A., Russ, P., 2003. In: 'Energy
consumption and CO2 emissions from the world cement industry', DG
JRC-IPTS Report, Technical Report Series, EUR 20769 EN.
Szabo, L., Hidalgo I., Ciscar J.C. and Soria A., 2006. In: 'CO2 emission
trading within the UE and Annex B countries: the cement industry case',
Energy Policy , 34(1), 72-87.
Tietenberg, T., 2002. In: 'The tradable permits approach to protecting the