Publisher’s version / Version de l'éditeur:
Vous avez des questions? Nous pouvons vous aider. Pour communiquer directement avec un auteur, consultez la première page de la revue dans laquelle son article a été publié afin de trouver ses coordonnées. Si vous n’arrivez pas à les repérer, communiquez avec nous à [email protected].
Questions? Contact the NRC Publications Archive team at
[email protected]. If you wish to email the authors directly, please see the first page of the publication for their contact information.
https://publications-cnrc.canada.ca/fra/droits
L’accès à ce site Web et l’utilisation de son contenu sont assujettis aux conditions présentées dans le site LISEZ CES CONDITIONS ATTENTIVEMENT AVANT D’UTILISER CE SITE WEB.
Proceedings of the 10th Canadian Conference on Building Science and
Technology, pp. 169-181, 2005-05-01
READ THESE TERMS AND CONDITIONS CAREFULLY BEFORE USING THIS WEBSITE. https://nrc-publications.canada.ca/eng/copyright
NRC Publications Archive Record / Notice des Archives des publications du CNRC :
https://nrc-publications.canada.ca/eng/view/object/?id=0dac3d5d-b992-429e-b095-c5563c49a0c4 https://publications-cnrc.canada.ca/fra/voir/objet/?id=0dac3d5d-b992-429e-b095-c5563c49a0c4
NRC Publications Archive
Archives des publications du CNRC
This publication could be one of several versions: author’s original, accepted manuscript or the publisher’s version. / La version de cette publication peut être l’une des suivantes : la version prépublication de l’auteur, la version acceptée du manuscrit ou la version de l’éditeur.
Access and use of this website and the material on it are subject to the Terms and Conditions set forth at
Methods for evaluating long-term changes in thermal resistance of
vacuum insulation panels
Mukhopadhyaya, P.; Kumaran, M. K.; Lackey, J. C.; Normandin, N.; van
Reenen, D.
Methods for evaluating long-term changes in thermal
resistance of vacuum insulation panels
Mukhopadhyaya, P.; Kumaran, K.; Lackey, J.;
Normandin, N.; van Reenen, D.
NRCC-47716
A version of this document is published in / Une version de ce document se trouve dans :
Proceedings of the 10
thCanadian Conference on Building Science and Technology,
Ottawa, Ont., May 12-13, 2005, pp. 169-181
METHODS FOR EVALUATING LONG-TERM
CHANGES IN THERMAL RESISTANCE OF
VACUUM INSULATION PANELS
Phalguni Mukhopadhyaya, Kumar Kumaran, John Lackey, Nicole Normandinand David van Reenen
National Research Council Canada, Institute for Research in Construction, Ottawa, ON, Canada
Abstract
Efficient insulating systems are the key to the energy efficiency of a building envelope. Vacuum Insulation Panels (VIPs) offer excellent thermal resistance properties that can enhance the energy efficiency of insulating systems, use less space, and provide savings in energy consumption. However, from a Canadian perspective, VIP systems are little known and indeed unused in the building industry. There is a need to investigate the prospect of using VIPs in various components of building envelope. The long-term thermal insulating efficiency of the VIPs depends on its ability to maintain an adequate level of vacuum inside the panel. For design purpose the long-term thermal insulating characteristics of the VIPs needs to be understood and defined. This paper addresses some of the test methods that could accelerate the long term changes in thermal resistance and presents selected results from tests using elevated pressure, relative humidity and temperature on three types of VIPs.
1.0 INTRODUCTION
It may not be obvious but it is true that the existence of life on our planet is very much dependent on
insulation. The layer of air that encompasses our planet is essentially an effective insulation blanket (1)
keeping our planet inhabitable for us. In a more day-to-day life our interaction with insulating materials and systems is a permanent affair (thermos flask, clothing, fur, window glass, building envelope etc.). The search for a better and space and/or cost efficient insulation system remains an ongoing process involving
the development of innovative technologies (2,3).
The energy crisis of the seventies called for a review on how building envelopes are insulated and the system is built upon to reduce heat losses and improve energy efficiency of built environment. Canada was in the forefront of this technology and a renowned leader of research and development activities at that time. However, technological developments in the area of insulation technology show that there is room
for improvement in the insulation technology for building envelopes (4-6).
It is well known that the absence or reduction of gaseous pressure inside a porous material increases its
thermal insulating potential (1). This phenomenon has be exploited for the innovation of materials or
systems that provide higher thermal resistance in a given space. However, the real challenge is to develop high performance thermal insulation systems that incorporate a vacuum, making use of the latest scientific and technological developments in materials and manufacturing, and to identify practical building applications for such materials. The combination of micro-and nano-porous materials with vacuum technology offers the potential solution that can make building insulation systems much more space-efficient compared to the current systems. With the development of vacuum insulation panels (VIPs) that are ten times more space-efficient than contemporary products, the thickness of building envelopes might be even reduced from the current level. That might result in less use of wood and wood based materials in the constructions and possibly, to a reduction in the amount of material that needs to be recycled at the end of the buildings service life. Furthermore, as Canada is committed to uphold Kyoto Agreement, any
innovation that could reduce CO2 generation deserves attention. Space-efficient insulation materials, such
as vacuum insulation panels, could help reduce energy consumption and hence CO2 generation.
However, there are many practical aspects regarding the long-term performance and application of VIPs in building construction that need to be quantified. Air molecules and water molecules can permeate through the foil and the seams that are part of the VIPs (see section 2), thus reducing the thermal resistance of the
panels. The long-term thermal resistance of VIPs will then depend on the ability of the foil and to maintain the vacuum over long periods of time. Any application of the panels must not alter the damage the foil or the seams. Even one pinhole in the foil or the seam destroys the vacuum and drastically reduces the long-term performance of the VIPs. This is a challenge in building applications.
Researchers at the Institute for Research in Construction (IRC) at the National Research Council of Canada (NRC) have been working with several experts from Europe and several Canadian stakeholders in an International Energy Agency Annex (Annex 39) on the above issues during the past three years. This paper reports selected experimental observations regarding selected factors that affect the long-term performance of VIPs. To assess the long-term performance, state-of-the art VIPs that were manufactured in Europe were subjected to various aging conditions as was recommended by a panel of experts in the Annex, with a view to developing laboratory methods to quantify long term performance.
2.0 VACUUM INSULATION PANEL
The high thermal resistances that are offered by evacuated panels of open porous systems in comparison with traditional thermal insulation materials of the same thickness have been well known for several
decades (2,3). Kollie et al. (3) have reviewed the history of the development of vacuum insulation. The
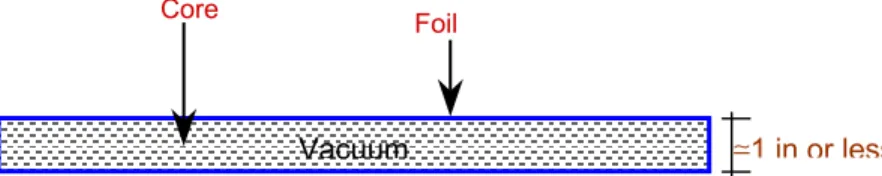
technology for manufacturing large VIPs has advanced to such a point that panels, which are larger than 1 m X 3 m, are currently available in Europe and are being used for building applications. A state-of-the-art vacuum insulation panel consists of an open porous ‘core’ material and a thin impermeable membrane
called the ‘foil’ (Figure 1). Some of the core materials that are now used in VIPs include open porous
polystyrene, polyurethane, precipitated silica and silica gel. The pore sizes of these materials are in the micro-meter to nano-meter scales. The foils whose principal function is to tightly seal the vacuum by preventing the entry of air and water molecules by diffusion are laminated or multilayered. The multilayer includes several layers of aluminium, either metallic or metallized, and organic polymeric materials strongly bonded together at a total thickness that is measured in micro-meter. Advanced technologies now make it possible to seal these foils vacuum-tight.
≅1 in or less
Foil Core
Vacuum
Figure 1 - Schematic diagram of vacuum insulation panel.
Traditional insulation systems, such as glass fibre, cellulose, and foam boards, reduce heat conduction by enclosing air or gases that have low thermal conductivity. In VIPs this enclosed air or gas is removed to further reduce the thermal conductivity or increase the thermal resistivity of the material between the foils in VIPs. VIPs can be as high as ten times more space-efficient than insulation products that are currently
used (Figure 2).
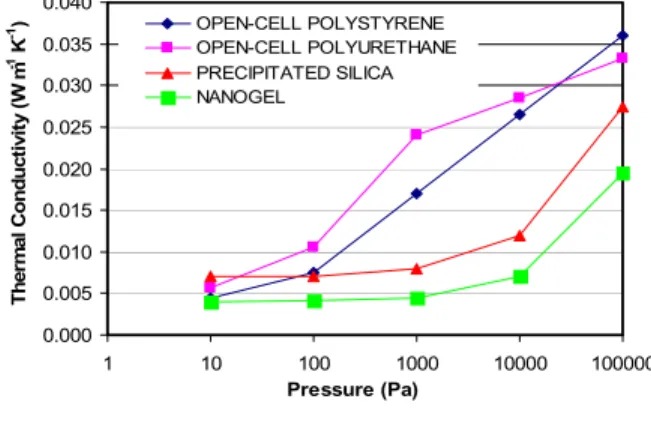
The initial thermal conductivity of a VIP depends on the pore dimensions of the core and the level of the
vacuum retained within the sealed panel. This is illustrated in Figure 3, based on a set of data published by
a manufacturer of VIPs. Nanogel core material has the highest capacity to maintain the lower thermal conductivity when internal vacuum is partially lost (i.e. increase of internal gas pressure). The nanogel product maintains very low thermal conductivity even at 10 kPa. This is because it is mainly nano-porous or the pore sizes are predominantly in the nano meter range. The open-cell polyurethane system, being predominantly micro porous, the thermal efficiency of the VIP is lost at less than 100 Pa vacuum levels. The thermal performance of precipitated silica and the open-cell polystyrene lays between that of the other two. This performance is based not only on the pore size (based on the mean-free-path/pressure relationship equations), but may also be somewhat influenced by radiation-inhibiting additives.
Figure 2 - Thermal resistivity (Thermal resistance of VIP/thickness) of vacuum insulation panel compared to those of several common insulating materials
0.000 0.005 0.010 0.015 0.020 0.025 0.030 0.035 0.040 1 10 100 1000 10000 100000 Pressure (Pa) Th e rm a l Cond uc ti v it y ( W m -1 K -1) OPEN-CELL POLYSTYRENE OPEN-CELL POLYURETHANE PRECIPITATED SILICA NANOGEL
Figure 3 - Change of thermal conductivities of core material due to loss of vacuum
3.0 EXPERIMENTAL PROGRAM
As mentioned earlier, the experts in the Annex 39 laid out the experimental program at NRC. The main objective of the experiments was to assess the impact of environmental loads, such as high relative humidity and higher than normal room temperature on the performance of the VIPs. This study was organized in two-phases (Phase I and Phase II) and to date has involved three types of panels.
Phase I
In Phase I, two different types of vacuum insulation panels (Type I (metallized) and Type II (metallic)) were obtained from a manufacturer. The panels were manufactured approximately 30 days prior to initial testing. There were six specimens of each type. The core of these panels has been identified as a nano-porous system, that includes precipitated silica, micro-fibres and an opacifier, and was dusty and grey in colour. The core was layered parallel to the major surface of the VIP as is common. The foils of the VIP specimens 1 to 6 (Type I) were shiny and called metallized and that of specimens 7 to 12 (Type II) were dull and called metallic. The details of the construction of these foils are unknown to the researchers at the Institute. Experts at the Annex identified the shiny foil to be a three-layered product and the dull one single
layered. The size of each VIP specimen was 300 mm X 300 mm X 30 mm (Figure 4). The initial thermal
resistances of the panels were determined according to ASTM Standard C518. Then they were exposed to different environmental loads and the changes in thermal resistances followed. It is noted that ASTM standard C518 was not developed particularly for the thermal measurement on VIPs. ASTM Standard C1484 discusses the applicability and limitations of apparatus meeting C518 method for the thermal measurement of VIPs. Hence, the results obtained in this study should be primarily used for comparing the long term changes in the thermal resistance of the VIPs.. The reproducibility and sensitivity of the specific C518 type apparatus at NRC for the present work was confirmed through a set of preliminary investigations (see Appendix I).
The accelerated environmental loads considered for Phase I of this study were high relative humidity (RH), high pressure and high temperature. During the exposure period at regular intervals the thermal characteristics of the VIPs were repeatedly determined. This was continued for more than a year. The various exposure regimes considered for Phase I are: (1) Exposure to standard laboratory conditions, (2) Laboratory temperature and high RH (about 90 %); (3) Exposure to 32 ºC and 90 % RH; (4) Exposure to 5 bar over pressure at 21 ± 1 ºC and approximately 50 % RH; and (5) Exposure to 3 bar over pressure at 21 ± 1 ºC and approximately 50 % RH.
Type I Type II
300mm × 300mm × 30mm
Figure 4 - Vacuum insulation panels
The properties of ‘core’ and ‘foil’ materials of VIP panels play a very important role to determine its short- and long-term thermal characteristics. Hence, in Phase I, the water vapour permeance and sorption characteristics of these materials were characterized. For one VIP specimen the ‘core’ and ‘foil’ materials were separated in order to determine their sorption and water vapour permeance characteristics respectively. The sorption curve for the ‘core’ material was determined according to ASTM Standard C 1498. The water vapour permeance of the ‘foil’ material was determined according to ASTM Standard E 96.
In addition to the aforementioned test on ‘foil’ material, two types of unused ‘foil’ bags with seams on three sides were obtained from the VIP manufacturer. The water vapour permeability of this ‘foil’ bag with and without the seams was determined according to ASTM Standard E 96.
Phase II
Phase II of this study is still ongoing. Twenty VIP panels are under observation at this moment. In this study change of internal pressure, (an indicator of potential long-term performance), in the vacuum insulated panel is being investigated.
4.0 EXPERIMENTAL OBSERVATIONS
The experimental observations are presented in the following sections. 4.1 Initial Thermal Characteristics
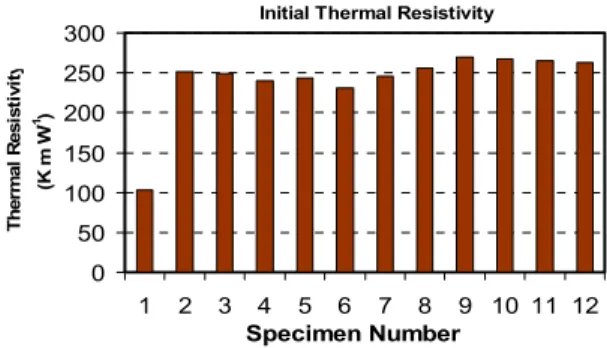
The initial thermal resistances of the twelve test specimens were measured according to ASTM standard
C518, . The measurements, made within two weeks of arrival at NRC are shown in Figure 5. The
apparatus exerted a pressure ≈ 300 kPa on the surfaces of the VIPs. Eleven of the twelve VIPs tested
yielded the expected high thermal resistivity (The thermal resistance of a VIP is divided by panel thickness
Initial Thermal Resistivity
0 50 100 150 200 250 300 1 2 3 4 5 6 7 8 9 10 11 12 Specimen Number T h er m al R esi st ivi ty (K m W -1)
Figure 5 – Initial thermal resistance divided by thickness of VIPs. Specimen 1 was defective. Specimens 1 to 6 are Type I and 7 to 12 are Type II
and is termed thermal resistivity for the purposes of the paper, even though the core is a system not a material and is not proportional to thickness). Specimen 1 had approximately half the "thermal resistivity" of the others. That was an indication of some defects in that panel. Visually nothing was apparent but it was felt that the ‘foil’ on the specimen was soft or floppy.
4.2 Ageing of Specimens in Laboratory Condition (Controlled Specimen)
Specimens 9 and 10 were aged in the laboratory at 21 ± 1 ºC and approximately 50 % RH. The thermal
characteristics of these specimens are shown in Figure 6. Initially there was a measurable drop (about 6 %)
in the resistivity of both specimens, but after that the changes were negligible for nearly one year. Within the limits of the precision of the heat flow meter apparatus the thermal resistivity remained the same.
Specimen 9 0 50 100 150 200 250 300 0 43 98 195 254 373 Time (days) Th er m a l R esi st iv it y (K m W -1 ) Specimen 10 0 50 100 150 200 250 300 0 42 97 194 252 372 Time (days) Ther m al R esi s ti v it y (K m W -1 )
Figure 6 - Aging of specimens at laboratory conditions for more than a year
4.3 Exposure to High (90%) Relative Humidity
Specimen 4 was aged in a manner similar to specimens 9 and 10, except that between 90 days and 190 days, the specimen was exposed to 90 % RH at 23 ºC for 60 days. The results of this exposure are shown in
Figure 7. Specimen 04 0 50 100 150 200 250 300 0 53 90 189 264 377 Time (days) T h er m al R esi st ivi ty (K m W -1 ) 90% RH
Figure 7 - Ageing of a Type I specimen with additional exposure at 90% relative humidity for 60 days
These results suggest that the 60-day exposure to high RH did not affect the ageing pattern of the test specimen significantly.
4.4 Exposure to High Temperature (32 ºC) and Relative Humidity (90 %)
Specimens 6 and 12 were aged similar to specimens 9 and 10 except that between 255 and 290 days they
were exposed to 32 ºC and 90 % RH for 30 days. The results are shown in Figure 8. These data in Figure 8
reveal that for Type I and Type II VIPs the short period of 35ºC temperature and 90% RH had a minor effect on the pattern of ageing of the specimens.
25 v it y s ist i R e rm al T h e
Figure 8 - Ageing at laboratory conditions except for35 days at 35ºC 90% RH relative humidity
Specimen 06 0 50 100 150 200 0 0 55 92 255 292 377 Time (days) T h e rm a lR e si st ivi ty (K m W -1 ) Specimen 12 0 50 100 150 200 250 300 0 44 95 246 294 372 Time (days) (K m W -1 ) High T and RH High T and RH
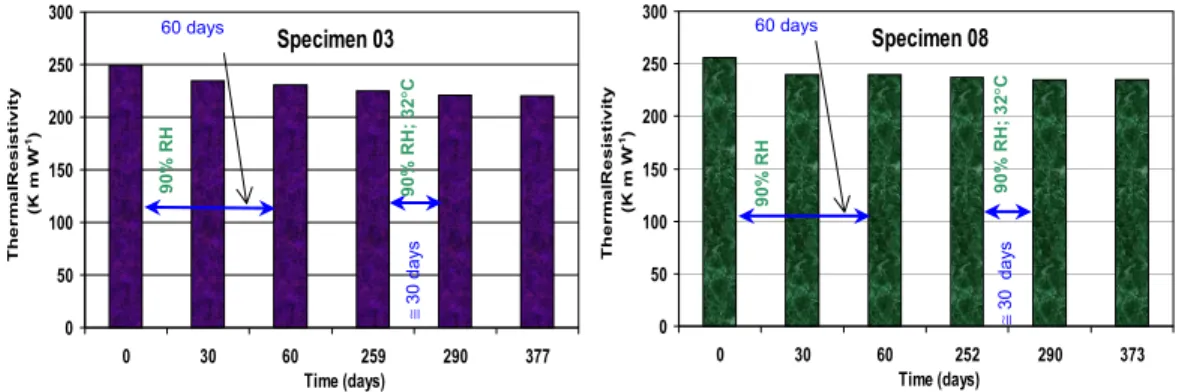
4.5 Ageing in a Combination of High Relative Humidity (RH) and Temperature (T) Condition Specimens 3 and 8 were exposed to 90 % RH at laboratory conditions, initially at 30 days, followed by another 30 days (i.e. total 60 days). Then after about 250 days, the panels were exposed to 32 ºC and 90 % RH for 30 days. The changes in the thermal resistivity (standardized resistance) of these specimens are
shown in Figure 9. Specimen 03 0 50 100 150 200 250 300 0 30 60 259 290 377 Time (days) T h er m a lR esi st ivi ty (K m W -1) Specimen 08 0 50 100 150 200 250 300 0 30 60 252 290 373 Time (days) T h er m al R es is ti vi ty (K m W -1) ≅ 30 days ≅ 30 days 60 days 60 days 90% R H ; 32 ° C 9 0 % RH; 3 2 ° C 90% R H 9 0 % RH
Figure 9 – Ageing of 30 mm thick of Type I and Type II VIPs for a combination of laboratory and of 35 ºC and/or 90% relative humidity conditions
Comparison of the data in Figure 9 with those in Figures 7 and 8 shows that even 90 days of exposure
during 1 year to high humidity and out of that 30 days also at higher temperature than laboratory temperature did not affect the overall ageing of the specimens.
4.6 Ageing Under Overpressure
Initially specimens 2, 5 and 11 were aged for about 250 days, like specimens 9 and 10. Specimen 7 was
aged identical to specimens 3 and 8. But then the VIPs were stacked in a pressure chamber (Figure 10),
kept at an over-pressure of 5 bars for 30 days, tested for their thermal resistivity and then subjected to an over-pressure of 3 bars for 15 days. The exposure to 5 bars shrunk all specimens by approximately 6 % in
all dimensions (Figure 11). A further exposure to 3-bar over-pressure for 15 days did not alter the physical
Original VIP Panel Shrunk VIP Panel
Figure 10 - Pressure chamber used to create overpressure
Figure 11 - Dimension change of Type I VIP due to an overpressure of 5 bars
appearances of the four specimens. The shrinkage affected the thermal resistivity significantly, as shown in
Figure 12. However there was no significant change in the thermal resistivity due to the second exposure to 3-bar over-pressure. The specimens were retested after nearly 480 to 490 days of total ageing and the
and as a result solid particles came together. This may be the reason for the substantial decrease in the thermal resistivity after the exposure to the 5 bar over-pressure. Further work is necessary on the aging of VIPs due to overpressure.
Specimen 02 0 50 100 150 200 250 300 0 90 254 292 307 490 Time (days) T h e rma lResi st iv it y (K m W -1 )
5 bar
3
bar
Specimen 05 0 50 100 150 200 250 300 0 90 252 289 304 486 Time (days) T h erma lR esi st iv it y (K m W -1 )5 bar
3 bar
Specimen 11 0 50 100 150 200 250 300 0 97 243 281 296 479 Time (days) T h er m a lResist ivit y (K m W -1 )5 bar
3 bar
Specimen 07 0 50 100 150 200 250 300 0 60 249 286 301 483 Time (days) T h ermal R es is ti vi ty (K m W -1 )5 bar
3
bar
Figure 12 - Ageing of Type I and Type II VIPs under two overpressure cycles and a series of laboratory condition cycles
4.7 The Defective Specimen
Within the first 60 days the defective specimen (Specimen 1, Type I) lost its vacuum altogether and the
thermal resistivity was reduced to 54.0 K m W-1. This is still higher than the thermal resistivity of any
common insulation and matches that of the best cellular plastic insulation. This thermal resistivity is entirely due to the nano-porous structure of the core material.
At this stage the VIP was opened and the ‘foil’ and the ‘core’ were separated. From the foil, six circular specimens, approximately 15 cm in diameter, were prepared for dry cup (approx 0 %) measurements according to ASTM Standard E 96 and air permeance measurements according to a procedure developed at
the NRC (7). Two sets of chamber RH conditions were used for the dry cup measurements, namely 90 % to
0% RH and 95 % to 0% RH. Measurements were conducted in triplicate at each test condition.
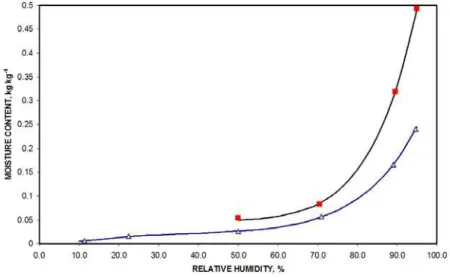
The core was cut into many 35 by 35 by 30mm pieces for sorption and desorption measurements, according to ASTM Standard C1498. The dry mass of each test specimen was determined by drying to constant mass at 105 ºC. At each test condition, measurements were done in triplicate. Sorption was done at 11.3 %, 22.7 %, 50.1 %, 71.0 %, 88.0 % and 94.9 % RH. Desorption measurements were done at 50.1 %, 70.5 %, 89.5 % and 94.8%. The RH measurements are better than 1 % accurate as traceable to a chilled-mirror standard. For the desorption measurements, the specimens were conditioned at very close to the saturation vapour pressure for 24 h and it was noticed that all conditioned specimens shrunk by as much as 1/3 of their original volume.
The water vapour permeability test results from the dry cup measurements show that the metallized foil is very resistant to vapour diffusion. The water vapour permeance of the metallized foil material varied
The results from sorption and desorption measurements are plotted in Figure 13. This plot reveals the hygroscopic nature of the core. At the initial stage of adsorption, any water molecule that enters the VIP has a strong chance to get adsorbed by the core depending on the equilibrium pressure over the core material and to negate any potential increase in the total pressure.
Figure 13 - The sorption-desorption characteristics of the VIP ‘core’ material (the lower curve is for sorption and upper for desorption).
4.8 Air Permeance of the Foil
Air permeance measurements were done according to a procedure developed at the Institute for Research in Construction (IRC) at the National Research Council Canada (7). This method is based on the principle described in ASTM Standard C 522, Standard Test Method for Airflow Resistance of Acoustical Materials. Bomberg and Kumaran (7) had extended the ASTM C 522 method for general application to building materials.
The foil test specimens (Type I), even at an over pressure of 100 kPa, yielded no measurable airflow rates (less than 0.1 cubic meters per square meter per hour). An attempt to follow pressure decay within the test chambers showed no decay for many (approx. 100) hours. Both these prove that the foils are highly resistant to the diffusion of air molecules. The permeance is infinitesimally small, compared to other conventional membranes used in building construction, and immeasurable by conventional methods. 4.9 Heat Flow and Edge Effects
Test specimens 5, 6, 11 and 12, during the first two months of the test program, were placed side by side
and the edges were brought together as close as physically possible (Figure 14), to make one 60 by 60 cm
test assembly of four VIPs. The resulting assembly was tested in a 60 by 60 cm heat-flow-meter apparatus that conformed to ASTM Standard C 518. The point at which four corners of the individual test specimens met lay at the center of the metering area in the apparatus. The effective thermal resistivity of the assembly
was only 53 K m W-1, in comparison with 220 K m W-1 or higher thermal resistivity shown by individual
VIP. It is obvious from this measurement that locations at which the edges meet in an application of VIPs will correspond to appreciable thermal bridges. This presents a challenge in building applications of VIPs.
60 cm. VIP Panel VIP Panel VIP Panel VIP Panel 60 cm
Figure 14 – Vacuum insulation panel assembly
4.10 Vapour Permeance of Foils with and without Seams
Two types of foil bags used for VIP manufacture were selected for these tests. One type was identified as a single layer metallized foil and the other a three-layer metallized foil. The bags already had seams on three edges. From each type, six circular test specimens were prepared for vapour permeance tests according to ASTM Standard E 96. Three of the six had a portion of the seams at the center of the test area. Dry cup
measurements were done on all twelve-test specimens at approximately 90 % RH and 23°C temperature.
The results from these measurements are listed in Table 1. The results show that the seams do not provide
any easier path for vapour diffusion in comparison with the foils themselves. Also, as one would expect, the three layers metallized foil offers measurably higher resistance towards vapour diffusion than that offered
by the single layer metallized foil. But all values in the Table 1 are about 1 to 4 ng m-2 s-1 Pa-1.
Table 1 – Vapour Permeance of Foils with and without Seams cut from Type I Panels
Water Vapour Permeance (WVP), ng m-2 s-1 Pa-1
Single Layer Metallized Foil Three Layers Metallized Foil Without Seam With Seam at Center of
Test Specimen.
Without Seam With Seam at Center of Test Specimen. 3.26 3.32 0.90 1.30 2.79 3.04 1.02 1.54 2.84 3.98 0.89 0.96 2.28 2.72 0.76 1.18 2.64 2.75 0.66 1.39 2.47 3.22 0.73 0.84
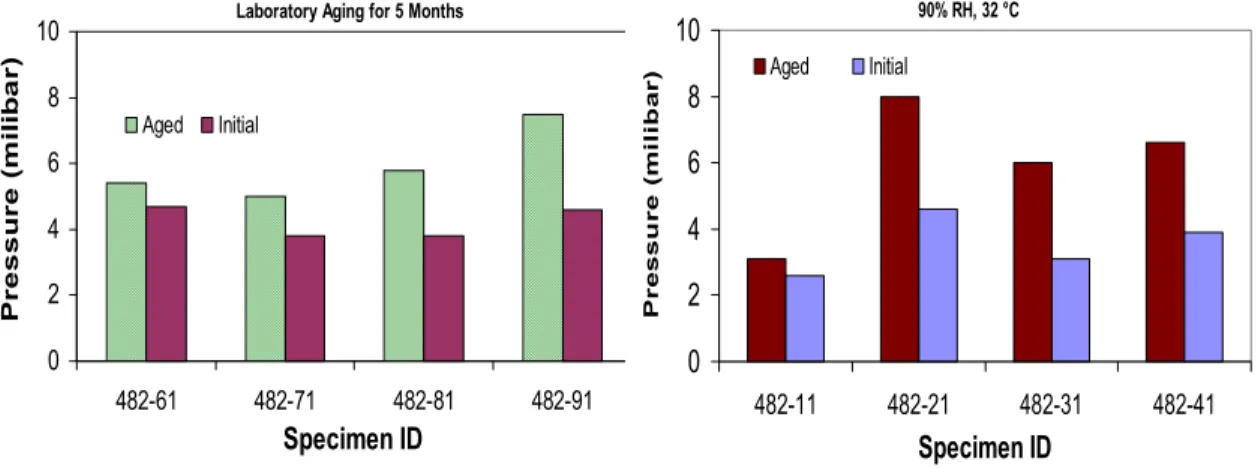
4.11 Phase II - Internal Pressure Change (Work in Progress)
After reviewing the results obtained from the first phase of the experimental work, phase II of the work has been initiated. In this second phase twenty VIP panels (Type III, generically, very similar to types I and II) are being tested in the laboratory. The exact construction will not be known until the end of the study. The
initial thermal resistivities of these specimens are shown in Figure 15. The thermal resistivity values varied
between 226 and 255 m.K.W-1. In addition, the internal pressure of each specimen was measured using a
vacuum chamber. The internal pressure varied between 2.2 and 5.6 milibar as shown in Figure 16.
The effectiveness of the VIPs depends on its ability to retain the internal vacuum during its service life. Hence, aging or loss of its effectiveness must be directly related to the internal pressure. In this study four
VIP specimens were exposed to laboratory condition (50% RH and 20°C temperature) and another four
were exposed to elevated room temperature (32°C) and relative humidity (90%) condition for sixty days.
After five months both sets of specimens were tested to determine the level of internal pressure. The results
are shown in Figures17 and 18. It is evident from these graphs that with time the internal pressure of the
vacuum panel can increase. The level of increment might be small or insignificant within a period of five month but this tendency highlights the importance to investigate further on the long-term performance of vacuum insulation panels (VIPs).
) .W -1 m .K y ( ivi t si st R e al er m T h 0 50 100 150 200 250 300 48 2-1 48 2-11 48 2-21 48 2-31 48 2-41 48 2-51 48 2-61 48 2-71 48 2-81 48 2-91 48 2-10 1 48 2-11 1 48 2-12 1 48 2-13 1 48 2-14 1 48 2-15 1 48 2-16 1 48 2-17 1 48 2-18 1 48 2-19 1 Specimen ID 0 1 2 3 4 5 6 7 8 9 10 48 2-1 482 -11 482 -21 482 -31 482 -41 482 -51 482 -61 482 -71 482 -81 482 -91 482-101 482-111 482-121 482-131 482-141 482-151 482-161 482-171 482-181 482-191 Specimen ID P ress u re ( m ili b a r)
Figure 15 - Initial thermal resistivity of VIP
specimens (second phase
)
Figure 16 - Initial internal pressure of VIP specimens(second phase)Laboratory Aging for 5 Months
0 2 4 6 8 10 482-61 482-71 482-81 482-91 Specimen ID P r ess u r e ( m il ib ar) Aged Initial 90% RH, 32 °C 0 2 4 6 8 10 482-11 482-21 482-31 482-41 Specimen ID Pr essu r e (m iliba r ) Aged Initial
Figure 17 - Internal pressure change in VIPs after over 150 days exposure at laboratory condition
Figure 18 - Internal pressure change in VIPs exposed for 60 days to 90% RH and 32°C
5.0 SUMMARY OF OBSERVATIONS
The experimental work reported in this paper is part of a larger research project that develops methods to assess the applicability and sustainability of vacuum insulated panels (VIPs) for use in the building envelope construction. This research initiative is still in progress, however, a number of observations can be made on the effects of elevated temperature and elevated humidity the thermal resistance of the panels. Firstly, it has been found that accelerated aging tests using high relative humidity and higher than normal indoor temperatures for periods of 30 to 60 days have no major influence on the thermal performance of the vacuum insulation panels. Exposure of the VIPs toan overpressure were not conclusive, as the applied pressure (5 bar) on the VIPs was higher than the layered structure of the ‘core’ material could withstand. Further work is necessary on the effect of overpressure.
Secondly, it has been observed that ‘foils’ and ‘seams’ do allow measurable water vapour transmission through them. However, the rate of water vapour transmission was very small.
Thirdly, the ‘core’ material of VIPs, used in this study has a large affinity towards water molecules. Such core material can adsorb water vapour molecules and thus will delay any increase in the net pressure inside the VIP due to water vapour intrusion depending on the vapour pressure versus moisture content of the materials in the core of the VIPs.
Lastly, but very importantly, the thermal bridges that the edges of VIPs create can significantly reduce their composite effectiveness as thermal insulation as expected. Further work is necessary on developing methods to measure the effectiveness of edge sealing techniques on the performance of the VIP insulations. 6.0 ACKNOWLEDGEMENT
Authors would like to acknowledge the financial support provided for this project by NRCan, Icynene, Enbridge Consumers Gas, Lexcor Industry Supply , Rideau Construction Inc., CMHC, BASF Canada and Plastifab.
This work is dedicated to the memory of Harris Cunningham who passed away in 2003. 7.0 REFERENCES
1. Pelanne, C. M. (1978) “Thermal insulation: what it is and how it works”, Journal of Thermal Insulation, Volume 1, April 1978, pp. 223-236.
2. Stovall, T. K., “An Introduction to VIP Technology,” Vacuum Insulation Panel Symposium, Baltimore, May-3-4, 1999.
3. Kollie, T. G., McElroy, D. L., Fine, H. A., Childs, K. W., Graves, R. S., and Weaver, F. J., “A Review of Vacuum Insulation Research and Development in the Building Materials Group of the Oak Ridge National Laboratory,” Oak Ridge National Laboratory, Oak Ridge, Tennessee 37831-6092, September 1991, pp. 91.
4. “Accelerating the Adoption of Vacuum Insulation Technology in Home Construction,
Renovation, and Remodelling” (2002) Project Final Report, Cooperative Agreement No. H-21173CA, NAHB Research Center Inc., 400 Prince George’s Boulevard, Upper Marlboro, MD 20774-8731.
5. Ellis, M. W., Fanney, A. H. and Davis, M. W., “Calibration of a Calorimeter for Thermal Resistance Measurements of Advanced Insulation Panels”, HVAC & R Research, Volume 6, No. 3, pp. 273-284.
6. Kumaran, M.K., Mukhopadhyaya, P., Lackey, J.C., Normandin, N., and van Reenen, D. "Properties of vacuum insulation panels: results from experimental investigations at NRC Canada," Proceedings of the Joint NSC-NRC Workshop on Construction Technologies (Taipei, Taiwan, 4/26/2004), pp. 147-156, April 01, 2004.
7. Bomberg, M. T. and Kumaran, M.K., "A Test method to determine air flow resistance of exterior membranes and sheathings," Journal of Thermal Insulation, Vol.9, pp. 224-235,1986.
Appendix I: Preliminary Tests to Demonstrate the Sensitivity and Reproducibility of the Apparatus Conforming to ASTM Standard C 518
The ASTM Standard C518 uses Heat Flow Meter (HFM) Apparatus to determine heat transmission characteristics of traditional thermal insulation materials where the measured thermal conductivity is
typically between 0.016 and 0.055 W m-1 K-1. The thermal conductivity of a VIP can be as low as 0.004 W
m-1 K-1.
The 300 mm × 300 mm heat flow meter apparatus that is used in the investigations has 150 mm × 150 mm
heat flow transducers on both plates. These transducers consist of thermopiles with 900 copper-constantan
junctions. The transducers were calibrated for heat fluxes ranging from 4 W m-2 to 100 W m-2 using transfer
standards that were developed in a guarded hot plate apparatus that conforms to the ASTM standard C177. The accuracy of the latter has been well established through several international round robin measurements. The details of the calibration procedures are identical to that were reported in an earlier
publication from the Institute1. Edge insulation was used to reduce heat losses from the test assembly.
Also, the ambient temperature was maintained to match the mean temperature of the test specimens. The results from steady states that have been maintained for a minimum of 12 h were used to determine the heat transmission characteristics of the test specimens. The heat fluxes that were measured were between 3 and
4 W m-2. The agreement between the values obtained from the hot and cold plate transducers was always
within one percent. The stability of the hot and cold surfaces was within 0.05 K during that 12 h steady state.
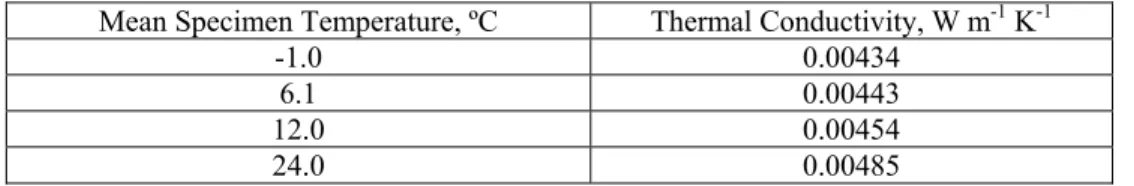
One had to test whether the HFM Apparatus could be used to measure the thermal conductivity and changes in thermal conductivity of VIPs. To accomplish this, a fresh test specimen of a VIP with a label
claiming a thermal conductivity of 0.004 W m-1 K-1 from its manufacturer was chosen. The thermal
conductivity of the panel at four different mean temperatures was determined using the above heat flow meter apparatus and procedure. The results listed in Table A1 and plotted in Figure A1 confirmed that the apparatus had adequate sensitivity to be used in this investigation and to follow small changes in thermal resistance of the VIPs.
Table A1. The thermal conductivity of a different but similar type of VIP at four mean temperatures.
Mean Specimen Temperature, ºC Thermal Conductivity, W m-1 K-1
-1.0 0.00434 6.1 0.00443 12.0 0.00454 24.0 0.00485 1
J. Lackey, N. Normandin, R. Machand and M. K. Kumaran, J. Thermal. Insul. and Bldg. Envelopes, Vol. 18, 1994, 128-144.
0.0043 0.0044 0.0045 0.0046 0.0047 0.0048 0.0049 -5 5 15 25 35
Mean Specimen Temperature, °C
Thermal Conductivity, W m
-1
K
-1
.
Figure A1. The thermal conductivity of a VIP at several mean specimen temperatures, according to ASTM Standard C 518.