Publisher’s version / Version de l'éditeur:
Vous avez des questions? Nous pouvons vous aider. Pour communiquer directement avec un auteur, consultez la première page de la revue dans laquelle son article a été publié afin de trouver ses coordonnées. Si vous n’arrivez pas à les repérer, communiquez avec nous à [email protected].
Questions? Contact the NRC Publications Archive team at
[email protected]. If you wish to email the authors directly, please see the first page of the publication for their contact information.
https://publications-cnrc.canada.ca/fra/droits
L’accès à ce site Web et l’utilisation de son contenu sont assujettis aux conditions présentées dans le site LISEZ CES CONDITIONS ATTENTIVEMENT AVANT D’UTILISER CE SITE WEB.
Proceedings of the 12th International Conference on the Durability of Building
Materials and Components (XII DBMC), pp. 2193-2200, 2011-04-12
READ THESE TERMS AND CONDITIONS CAREFULLY BEFORE USING THIS WEBSITE.
https://nrc-publications.canada.ca/eng/copyright
NRC Publications Archive Record / Notice des Archives des publications du CNRC :
https://nrc-publications.canada.ca/eng/view/object/?id=c4ec47bb-79d2-4d9b-9b5a-b5246e132105 https://publications-cnrc.canada.ca/fra/voir/objet/?id=c4ec47bb-79d2-4d9b-9b5a-b5246e132105
NRC Publications Archive
Archives des publications du CNRC
This publication could be one of several versions: author’s original, accepted manuscript or the publisher’s version. / La version de cette publication peut être l’une des suivantes : la version prépublication de l’auteur, la version acceptée du manuscrit ou la version de l’éditeur.
Access and use of this website and the material on it are subject to the Terms and Conditions set forth at
A GIS tool for accessing climate data relevant to building practitioners
Kyle, B. R.; Lacasse, M. A.; Auld, H.; Manville, S. G.; Abdulghani, K.
A GI S t ool for a c c e ssing c lim a t e da t a re le va nt t o building
pra c t it ione rs
N R C C - 5 4 4 9 9
K y l e , B . R . ; L a c a s s e , M . A . ; A u l d , H . ; M a n v i l l e ,
S . G . ; A b d u l g h a n i , K .
J u l y 2 0 1 1
A version of this document is published in / Une version de ce document se trouve dans:
Proceedings of the 12th International Conference on the Durability of Building
Materials and Components (XII DBMC), Porto, Portugal, April-12-15, 2011
http://www.nrc-cnrc.gc.ca/irc
The material in this document is covered by the provisions of the Copyright Act, by Canadian laws, policies, regulations and international agreements. Such provisions serve to identify the information source and, in specific instances, to prohibit reproduction of materials without written permission. For more information visit http://laws.justice.gc.ca/en/showtdm/cs/C-42
Les renseignements dans ce document sont protégés par la Loi sur le droit d'auteur, par les lois, les politiques et les règlements du Canada et des accords internationaux. Ces dispositions permettent d'identifier la source de l'information et, dans certains cas, d'interdire la copie de documents sans permission écrite. Pour obtenir de plus amples renseignements : http://lois.justice.gc.ca/fr/showtdm/cs/C-42
A GIS tool for accessing climate data relevant to building
practitioners
Brian R. Kyle
1Michael A. Lacasse
2Heather Auld
3Stephan G. Mainville
4Khaled Abdulghani
5 T 09 ABSTRACTMaintenance of building façades and related systems should be an on-going process.
Nonetheless, maintenance prioritisation issues are often neglected due to the lack of available
tools to assess vulnerability to climatic effects and susceptibility to deterioration. How is
climatic information currently accessed and used and what are the existing means to assess
climate loading effects? A Geographic Information System (GIS) platform [ESRI ArcGIS
9.3] was proposed as an appropriate tool to integrate climatic design information and other
analyzed climate data in a geographical context and allow users ready access to climate
information pertinent to building practitioners. On the basis of this effort climatic design data
used for building codes and standards, such as degree days, 15 minute, one day and annual
rainfall, driving rain wind pressure and related loads were made available in the GIS
platform. This climatic design data provides basic information from which derivative climate
parameters can be developed and from which relevant climate load projections can be
extracted for use by building designers, practitioners and maintenance experts.
KEYWORDS
GIS, climate design data, building systems, design and maintenance
1
XTN Sustainable Life-cycle Asset Management Consulting, CANADA, [email protected]
2
National Research Council Canada, CANADA, [email protected]
3
Heather Auld, Environment Canada, CANADA, [email protected]
4
Public Works and Government Services Canada, CANADA, [email protected]
5
Kyle, Lacasse, Auld, Mainville and Abdulghani
2 XII DBMC, Porto, PORTUGAL, 2011
1 INTRODUCTION
Maintenance of building façades and related systems should be an on-going process. Nonetheless, maintenance prioritisation issues are often neglected due to the lack of available tools to assess vulnerability to climatic effects and susceptibility to deterioration. What are the current means employed to access climate information? Key components of the building systems that are most in need of maintenance interventions ought to be identified to prevent premature catastrophic failure, to sustain the health and safety of the occupants, and to maintain the serviceability of the system over its service life. Maintenance prioritisation ensures effective deployment of limited or insufficient funds.
1.1 The need
The design and sizing of mechanical, heating, ventilation and air-conditioning systems is influenced directly by expected loads upon the systems, occupant functional requirements as well as legal and building operational regulations and frameworks. Amongst the climatic loadings, temperature and humidity are of primary concern having significant impact upon the required capacity of heating and cooling systems. Wind loads affect the efficiency of air-intake and handling units ; potentially altering building pressurisation and effective operation of functional services such as elevators.
Buildings are making an ever-increasing use of weather-driven renewable energy sources such as integrated wind turbines, solar panels and enhanced day lighting techniques. The design, maintenance and longer-term performance and broader adoption of these technologies depend upon the availability of reliable climate information including temperature data, solar radiation exposure and cloud-cover information, as well as wind intensity projections.
Data on wind, solar radiation, temperature, moisture and precipitation is essential to properly evaluate the design and effects of maintenance on all building envelope components. This is significant when considering the expected performance of “green” walls and roofs since implied seasonal loadings may be drastically different from those expected with more conventional configurations.
Knowledge of the combined effects of wind, moisture and thermal loads on façade systems permits the determination of the response of the wall including the hygrothermal performance, dilation at the panel joints, susceptibility to water penetration or the product of combined responses that act to deteriorate the façade system. Hence, evaluating climatic effects in combination with wall response permits establishing the most severe combinations most likely to deteriorate the façade and thus provides a basis for prioritising maintenance programs for high-rise buildings. The process can be used to establish risk of deterioration from climatic effects among the different walls for a given building façade, between the level of risk among different buildings in a given climate, or for comparing the relative effects of similar façades exposed to different climate loadings.
The effects of moisture and other climate parameters on the deterioration of façade components are well known; spalling of masonry caused by freeze-thaw action, spalling and degradation caused by salt migration, damage due to expansion of materials or components; loss of adhesion or rupture of jointing products from joint movement. Likewise, water penetration of the façade from wind-driven rain to the interior causes failure of interior finishes, damage to gypsum plasters, mould or mildew growth and degradation of the thermal performance of insulation.
1.2 Background
Over the past 20 years the geo-information field , once a highly specialized niche domain, has evolved to a technology having a broad effect on society and its interaction with nature. Geographic
Information Systems (GIS) applications range from simple navigation to critical and extremely complex tasks, such as infrastructure risk management, prediction and mitigation of the effects of natural disasters.
A GIS tool for accessing climate data relevant to building practitioners
XII DBMC, Porto, PORTUGAL, 2011 3
This broadened GIS use is partially due to the increased availability of Geographic Positioning
Systems (GPS) and greater access to georeferenced data. In North America most levels of government provide some level of “free-of-charge” access to geospatial data [e.g. GeoGratis, 2010,USGS National Map, 2010 ]. Historically, access to GIS data in Europe has been restricted by financial or legal barriers and as a result, European data often originated from U.S. based systems.
Various GIS initiatives have evaluated the interface of the natural and built environments, usually focusing upon a specific material or degradation processes [Inkpen et al.,2001, 2008,Cole et al., 1999, 2003a-c, 2004] with the intent of identifying geographically susceptible regions for the occurrence of the particular phenomenon. These works demonstrate the inherent capabilities as well as the ever increasing computational capabilities of GIS.
Numerous climate datasets and buildings related design tools have been developed [Hui and Cheung, 1997, ASHRAE, 2009, RETScreen, 2010]. An integral, and obviously required, characteristic of these tools is georeferenced climate data. Despite this potential direct linkage to GIS-based systems, to-date there have been relatively few initiatives to create GIS enabled climate data sets [Agnew and
Palutikof, 2000, Mitchell et al., 2004,] and equally as few efforts specifically focused upon implementing GIS relative to building-level data [Kyle et al., 2008, Hallberg et al., 2008].
1.3 Continually altered context
The rising perception of the significance of climate change and the potential impacts upon
infrastructure and buildings has resulted in several initiatives to monitor the impacts of future climate effects and to project potential longer-term changes [DEFRA, 2010, Environment Canada, 2008, IPCC, 2007, NASA, 2010]. The outputs of these efforts, while not explicitly aimed at assisting with the development of climate design data, if properly considered will contribute to the design and construction of more durable and climatically responsive buildings.
1.4 Approach
The intent of the work described herein was to create a tool that put Canadian climate design data in a GIS context. The GIS platform that was used to integrate climate information in a geographical context is ESRI ArcGIS 9.3. The ArcGIS database was populated with all necessary climate
information as obtained from the National Building Code of Canada [NBCC, 2010], to provide basic information from which derivative climate parameters can be developed and from which relevant climate data can be extracted for building designers, practitioners and maintenance experts.
The remainder of this paper describes the nature of the dataset, the preparation and processing required to migrate the data to the GIS context, as well as the results of the exercise.
2 NATIONAL BUILDING CODE OF CANADA 2010 DATASET
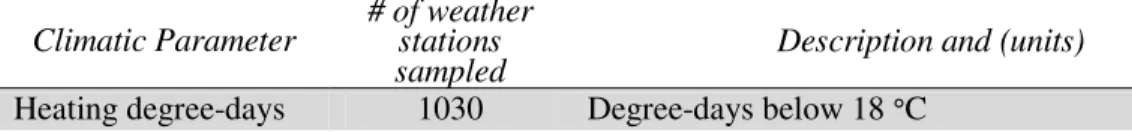
Appendix C of the National Building Code of Canada [NBCC, 2010] provides recommended design data for a number of locations throughout Canada. This document acknowledges the yearly and seasonal variability in climate loadings and the potential long-term shift in climate regimes. Table 1 lists the climatic parameters used in the developed tool and includes a short description of the parameter as well as the number of weather stations sampled.
Table 1. Composition of the NBCC 2010 Climatic Data Subset as Implemented Climatic Parameter # of weather stations
sampled Description and (units)
Kyle, Lacasse, Auld, Mainville and Abdulghani
4 XII DBMC, Porto, PORTUGAL, 2011
15 min. rain 1/10 485 Annual maximum 15 min. rainfall – 10 year return period (mm) One-day rainfall 3500+ Annual maximum one-day rainfall- 50 year return period (mm) Annual rainfall 2051 Total annual rainfall (mm)
Annual precipitation 2051 Total annual precipitation (mm)
Driving Rain 2051 Driving rain wind pressure - 5 year return period (Pa)
Snow Load Ss 2000+ Total annual snow load - 50 year return period (KPa) Snow Load Sr 2000+ Total annual snowload (rain-on-snow) - 50 year return period (KPa) Hourly wind pressure
1/10 400+.
Average hourly wind pressure – 10 year return period (KPa)
Hourly wind pressure
1/50 400+.
Average hourly wind pressure – 50 year return period (KPa)
This national model dataset is representative of the nature of the raw data sampled as well as the statistical analysis employed and traditional historically-based probablistic assessment. The final determination of the content of the document is made via consultation with various domain experts, and the document is, as such, consensus driven. The current, 2010, version of the climatic design data has directly considered climate change effects in the determination of distributions for various design parameters, most notable being the intensity of precipitation events.
3 GIS TOOL AND DATASET PREPARATION
The principal software package used for this work was ESRI ArcGIS Desktop 9.3 from
Environmental Systems Research Institute, Inc [ESRI, 2010]. Two additional tools, Spatial Analyst and ArcReader, were used during the development to add specific funtionality and ease-of-use. ArcGIS Desktop is a collection of products that runs on desktop computers and is used to create, import, edit, query, map, analyze and publish geographic information. It allows examination of various data relationships, permits testing of predictions. ArcGIS Desktop includes ArcView, ArcEditor and ArcInfo; providing progressively greater GIS functionality.
Spatial Analyst is an extension to ArcGIS Desktop , providing tools for comprehensive, raster-based spatial modeling and analysis. This tool permits the derivation of new information from existing data, spatial relationship analysis, development of spatial models and complex raster operations.
ArcReader is a free, easy-to-use desktop mapping application that allows users to view, explore and print maps and globes. Users of ArcReader can view high-quality interactive maps authored by higher-level ArcGIS Desktop products and published with the ArcGIS Publisher extension. The availability and quality of the data typically represent significant limitations to GIS implementation. In this particular case, the datasets had been pre-processed for representation and required only a minor verification for consistencies and/or anomalies. The project approach used was to interpolate the dataset with various weather station locations. Within the ArcGIS framework there are various interpolation methods available. For this initiative, and as is commonly the case in other climate data analysis, Iverse Distance Weighting (IDW) was used. IDW is a multivariate interpolative process whereby values are assigned to unknown datapoints by using values from scattered set of known datapoints. IDW is well suited for this type of analysis since the data is very predictable and
consistent across the country. IDW is able to represent the data and interpolate a smooth distribution of unknown points. The control values for the interpolation analysis were chosen primarily by trial and error, aimed at generating results with adequate cartographic appeal to the audience and users. This process required considerable computing time and fine tuning . Once the results are complete, the whole mid-level product is packaged to be viewed using ArcReader.
A GIS tool for accessing climate data relevant to building practitioners
XII DBMC, Porto, PORTUGAL, 2011 5
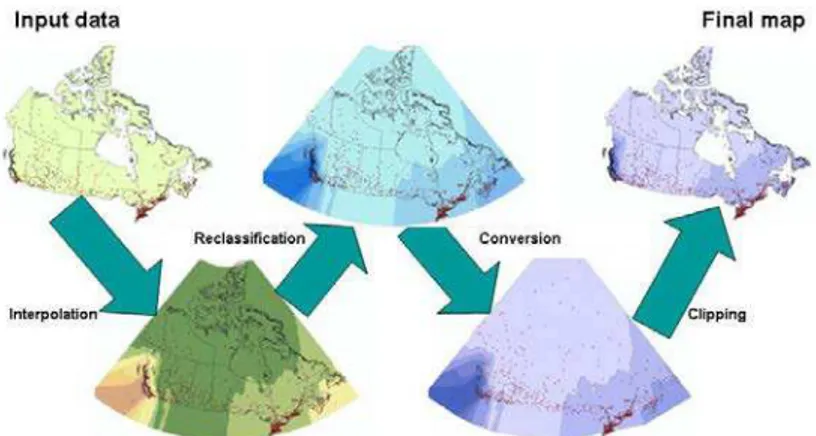
The data manipulation process used for the migration of\the design dataset to the ArcGIS context is presented in Fig. 1. A basic description of the steps taken to reach the final products is as follows:
• Interpolation - Iverse Distance Weighting is used to estimate data values at locations without data, based upon the distances to populated datapoints;
• Reclassification – the interpolated dataset is transferred to a rastor file while maintaining the original raw data;
• Conversion - the raster file is converted to a polygon file containing specific attributes; and • Clipping – limits the displayed map to a specified desire border, e.g. to the map of Canada. The mapping capabilities of the ArcGIS system permit various layer selections and further
combination of loads and effects; the colour selection and control over the ramping gradation.
Figure 1. Process diagram for the dataset preparation and migration in ArcGIS 9.3
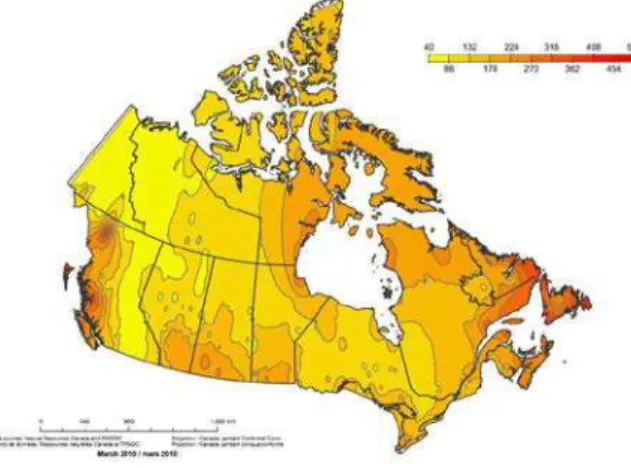
4 RESULTS
The procedure described in Section 3 was applied to each of the design parameter datasets listed in Table 1 of Section 2. Figures. 2 to 4 present results for a sampling of these parameters.
Kyle, Lacasse, Auld, Mainville and Abdulghani
6 XII DBMC, Porto, PORTUGAL, 2011
Figure 3. Canadian design data for annual snowload (rain-on-snow) - 50 year return period (KPa)
Figure 4. Canadian design data for driving rain wind pressure - 5 year return period (Pa)
5 DISCUSSION
This system provides National Building Code of Canada climate design data, a consensus-based dataset borne from recent climatic observations as well as historical weather records and tendencies. As such, it fulfills the minimum data requirements for typical building climate design considerations in Canada.
At the highest level, this system offers a visualization of the macroclimate of any particular region in Canada, and at the lowest level, it provides climate information on a meso (building) scale and basic information needed to determine the microclimate loads on a building, its façade and systems. Many observers believe that climate change is having a greater, and more rapidly occurring, impact upon many design parameters than originally predicted. In some regions of Canada, long-standing design and construction practices are no longer perceived to adequately address climatic conditions and loadings and the usefulness of design data that is based, even in-part, on historical climate records is being questioned.[PIEVC, 2008, Auld and MacIver 2007].
With traditional approaches, the validity of such a stance (or climate design data itself) can only be substantiated with long-term data collection and comparisons of climate and weather observations relative to the climate design data that had been used. If the effects of climate change are as pressing as suggested, the time requirements to project and validate climate design data must be shortened. In the interim, if there are concerns about the adequacy of any projected climate loadings, at any stage of
A GIS tool for accessing climate data relevant to building practitioners
XII DBMC, Porto, PORTUGAL, 2011 7
a building’s service life, designs should meet requirements beyond the limits of datasets comparable to that described in this paper. Climate design databases, in conjunction with GIS interfaces,
provide
basic information from which derivative climate parameters can be developed and relevant
climate load projections can be extracted for use by building designers, practitioners and
maintenance experts.
Regardless of the basis of the databases, there will be an increasing role for GIS-based systems to provide building practitioners with current, historical and projectioninformation on climate loadings.
6 SUMMARY
An ESRI ArcGIS 9.3 Geographic Information System (GIS) platform was proposed as an appropriate tool to integrate climatic design information and other analyzed climate data in a geographical context and allow ready access to climate information pertinent to building practitioners. On the basis of this effort climatic design data used for building codes and standards, such as degree days, 15 minute, one day and annual rainfall, driving rain wind pressure and related loads were made available in the GIS platform. This climatic design data provides basic information from which derivative climate parameters can be developed and from which relevant climate load projections can be extracted for use by building designers, practitioners and maintenance experts.
ACKNOWLEDGMENTS
The support of this work by the Program for Energy Research and Development (PERD) administered by Natural Resources Canada is gratefully acknowledged.
REFERENCES
Agnew, M.D., Palutikof, J.P. 2000, GIS-based construction of baseline climatologies for the Mediterranean using terrain variables, CLIMATE RESEARCH Vol. 14: 115–127
American Society of Heating, Refrigerating, and Air-conditioning Engineers (ASHRAE) 2009, Handbook of Fundamentals, Chapter 14 – Climatic Design Information, Atlanta GA, 2009. Auld, H., MacIver, D. 2007, Changing Weather Patterns, Uncertainty and Infrastructure Risks: Emerging Adaptation Requirements, Adaptation and Impacts Research Division, Environment Canada,Occasional Paper 9, 4905 Dufferin Street, Toronto, Canada
Cole, I.S., King,, G.A., Trinidad, G.S., Chan, W.Y., Paterson D.A. 1999, ‘An Australia-wide map of corrosivity: a GIS approach’, 8th Int. Conf. On Durability of Building materials and Components, Vancouver, Canada, 30 May to 3 June 1999.
Cole, I.S., Chan, W.Y., Trinidad, G.S., Paterson D.A. 2004, An Holistic Model for Atmospheric Corrosion: Part 4 — A geographic information system for predicting airborne salinity Corrosion Engineering, Science and Technology, 200 4, vol. 39, no. 1.
Cole, I.S., Ganther, W.D., Paterson, D.A., King, G.A., Furman, S.A., Lau, D. 2003a. A Holistic Model for Atmospheric Corrosion: Part 2 — Experimental Measurement of Deposition of Marine Salts in a Number of Long-range Studies, Corrosion Engineering, Science and Technology, 2003, vol. 38, no. 4.
Cole, I.S., Paterson, D.A., Ganther, W.D. 2003b. A Holistic Model for Atmospheric Corrosion: Part 1 — Theoretical Framework for the production, Transportation and Deposition of Marine Salts. Corrosion Engineering, Science and Technology, 1 June 2003, vol. 38, no. 2, pp. 129-134(6).
Cole, I.S., Paterson, D.A., Ganther, W.D., Hinton, B., McAdam, G., Chotimongkol, L., Bhamornsut, C, Hue, N.V., Purwadaria, S. 2003c. A Holistic Model for Atmospheric Corrosion:
Kyle, Lacasse, Auld, Mainville and Abdulghani
8 XII DBMC, Porto, PORTUGAL, 2011
Part 3 — Effect of Natural and Man-made Landforms on Deposition of Marine Salts in Australia and South East Asia, Corrosion Engineering, Science and Technology, 2003, vol. 38, no. 4.
Department of Environment, Food and Rural Affairs, United Kingdon (DEFRA), 2010, UK Climate Projections, 2010, http://ukclimateprojections.defra.gov.uk/
Engineers Canada, Public Infrstructure Engineering Vulnerability Committee (PIEVC) 2008, Adapting to Climate Change, Canada’s First National Engineering Vulnerability Assessment,
Appendix B-6, Thermosyphon Foundations, Northwest Territories and Yukon, Ottawa, Canada, April 2008, http://www.pievc.ca/e/Appendix_B.6_Northwest_Territories_Thermosyphon_Foundations.pdf
Environment Canada, 2008, Climate Trends and Variation Bulletin: Annual, 2008. Environmental Systems Research Institute, Inc , (ESRI) 2010, http://www.esricanada.com
Hallberg, D., Akander, J., Stojanović, B., Kedbäck, M., 2008, Life Cycle Management System – A Planning Tool Supporting Long-Term Based Design and Maintenance Planning, 11th International Conference on Durability of Building Materials and Components, Istanbul Turkey, May 11-14, 2008 Hui, S. C. M. and Cheung, K. P., 1997. Climatic data for building energy design in Hong Kong and Mainland China, In Proc. of the CIBSE National Conference 1997, 5-7 October 1997, London (paper for CIBSE Virtual Conference 1997).
Inkpen, R.J., Fontana, D., Collier, P., Mapping Decay: Integrating Scales of Weathering within a GIS, Earth Surface Processes and Landforms; Earth Surf. Process. Landforms 26, 885–900 (2001)
Inkpen, R., Duane, B., Burdett, J., Yates, T. 2008, Assessing stone degradation using an integrated database and geographical information system (GIS), Environ. Geol. 56:789–801, Springer-Verlag Intergovernmental Panel on Climate Change (IPCC), 2007, Climate Change 2007: The Physical Science Basis.Contribution of Working Group I to the Fourth Assessment Report of the
Intergovernmental Panel on Climate Change. S. Solomon, D. Qin, M. Manning, Z. Chen, M. Marquis, K.B. Averyt, M. Tignor and H.L. Miller (Eds.). Cambridge University Press, Cambridge, United Kingdom and New York, NY, USA, 996 pp., 2007.
National Aeronautics and Space Administration, Goddard Institute for Space Studies (NASA), 2010, Common Sense Climate Index, http://data.giss.nasa.gov/csci/
National Building Code of Canada, (NBCC), 2010, Appendix C - Climatic and Seismic Information for Building Design in Canada, Ottawa,Canada, 2010
GeoGratis 2010, Natural Resources Canada,
http://geogratis.gc.ca/geogratis/en/index.html;jsessionid=3C4FFD51E9954D9DE09FFB6CA3D837FA RETScreen International (RETScreen), 2010, Software & Data, Natural Resources Canada,
http://www.retscreen.net/ang/version4.php
Kyle, B., Lacasse, M.A., Cornick, S.M., Richard, D., Abdulghani, K., Hilly, T., 2008, A GIS-Based Framework for the Evaluation of Building Façade Performance and Maintenance Prioritization, 11th International Conference on Durability of Building Materials and Components, Istanbul Turkey, May 11-14, 2008
Mitchell, T. D., Carter, T. R., Jones, P. D., Hulme, M., and New, M. 2004, A comprehensive set of high-resolution grids of monthly climate for Europe and the globe: the observed record (1901–2000) and 16 scenarios (2001–2100). Tyndall Centre Working Paper 55, Norwich, United Kingdom, 30 pp. URL: http://www.cru.uea.ac.uk/cru/data/hrg.htm
USGS (United States Geological Survey) National Map (2010). WWW document, http://nationalmap.gov/index.html