HAL Id: hal-03130134
https://hal.archives-ouvertes.fr/hal-03130134
Submitted on 3 Feb 2021HAL is a multi-disciplinary open access
archive for the deposit and dissemination of sci-entific research documents, whether they are pub-lished or not. The documents may come from teaching and research institutions in France or abroad, or from public or private research centers.
L’archive ouverte pluridisciplinaire HAL, est destinée au dépôt et à la diffusion de documents scientifiques de niveau recherche, publiés ou non, émanant des établissements d’enseignement et de recherche français ou étrangers, des laboratoires publics ou privés.
Influence of a porous urban block on urban flood flow
patterns
M Mejía-Morales, A Paquier, S Proust, E Mignot
To cite this version:
M Mejía-Morales, A Paquier, S Proust, E Mignot. Influence of a porous urban block on urban flood flow patterns. River Flow 2020, Jul 2020, Delft, Netherlands. pp.7. �hal-03130134�
Influence of a porous urban block on urban flood flow patterns
M.A. Mej´ıa-Morales, A. Paquier & S. Proust UR RiverLy - INRAE, Villeurbanne, France
E. Mignot
LMFA - Insa Lyon, Villeurbanne, France
ABSTRACT: Urban flood laboratory experiments usually consider that the flow is mostly con-centrated in streets and does not enter the building areas. However, urban blocks might modify the flow patterns at local scale due to the inflows or/and outflows through openings such as gates, windows, doors, etc. To investigate the influence of urban block porosity on flow distribution, flow depth and velocity in the surrounding streets, experiments were performed on a physical model. The results show that the urban block porosity does not substantially affect the discharge distribution in the streets located downstream of the urban block. However, flow depth, velocity and flow rate in the surrounding streets are more strongly modified.
1 INTRODUCTION
In the recent decades, urban flooding events have become more frequent (Wahlstrom & Guha-Sapir 2015). Understanding these extreme events is particularly important because of the huge monetary and human costs involved.
Numerical simulations of urban floods have thus increased in recent years, based on different scenarios, the first objective being the estimate of the flood hazard for the population. These studies were mainly performed using 2D numerical models (e.g. Mignot et al. 2006, Hunter et al. 2008, Abderrezzak et al. 2009, Cea et al. 2010, Paquier et al. 2019). However, any numerical model needs to be validated, and often there are no reliable data available to do so. Therefore, physical models offer the opportunity to study these events, as well as to validate the quality of numerical models.
The vast majority of the previous studies using physical models considered buildings or urban blocks as porous structures. For instance, they are represented as aligned and staggered non-porous square obstacles (e.g. Testa et al. 2007, Yoon 2007, Soares-Fraz˜ao & Zech 2008, Huang et al. 2014, Tomiczek et al. 2016). Others represent them as non-porous structures with geometries closer to reality (e.g. Ishigaki et al. 2003, Smith et al. 2016). Only a few studies consider these structures as porous buildings (e.g. Zhou et al. 2016, Sturm et al. 2018, W¨uthrich et al. 2018).
In that context, the present study is conducted using a physical model termed MURI, located in the hydraulics and hydro-morphology laboratory of INRAE Lyon-Villeurbanne, France. It has been adapted to provide an adjustable porosity to one of the urban blocks. The purpose of this work is to quantify the impact of urban block porosity on the flow rate distribution, flow depth and velocity patterns in a small-scale flooded urban area. Three cases with the same boundary conditions but different urban block porosity values and a reference case (with non-porous urban block) are compared herein.
2 EXPERIMENTAL SET UP
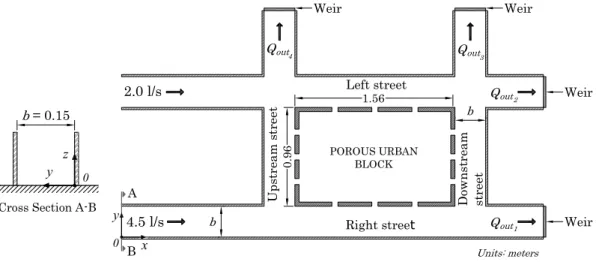
The experimental facility consists of a 1.56 m long and 0.96 m wide rectangular urban block made of transparent plastic and 4 adjacent streets of width b = 0.15 m, see Figure 1. The urban block facades are porous or non-porous as required (due to openings in the walls). The total inflow is
6.5 l/s, distributed among 2 streets: 4.5 l/s on the right street and 2.0 l/s on the left street. The flow finally leaves the facility through 4 outflows, one on each street.
A honeycomb mesh has been placed in both inlet streets to straighten out the flow. At each outlet a weir ensures a subcritical flow. The weir is 3 cm high at the outlets 2, 3 and 4, and 4.0 cm high at the outlet 1. The bottom is made of PVC and the slope of the model in the longitudinal direction (x-axis) is 0.12%. b 1.56 2.0 l/s b 0 x y
Cross Section A-B
Left street 4.5 l/s Units: meters Weir Qout4 Qout1 Right street Qout2 Qout3 POROUS URBAN BLOCK Dow ns tr ea m str eet U ps tr ea m st reet A B Weir Weir Weir 0.9 6 b = 0.15 0 y z
Figure 1. Top view of the experimental set-up comprising two longitudinal streets, two transverse streets, and a porous urban block.
2.1 Flow configurations
The experiments were conducted under steady flow conditions and the boundary conditions were kept constant for all cases. Four cases were studied, a case (Case 0-0) consists of a non-porous urban block configuration (the openings in the facades are closed), and the 3 following cases consist of a porous urban block configuration: Case 0-1 with 1 opening on the right and left facades, Case 0-3 with 3 openings on the right and left facades, and Case 3-3 with 3 openings on the right and left facades and 3 openings on the upstream and downstream facades, see Figure 2.
The porosity in the urban block has been defined for each facade as follows:
ψ =opening length along the facade
total length of the facade (1)
Table 1 shows the porosity values in the facades for each case studied.
Table 1. Porosity values for each case.
Upstream & Downstream facades Right & Left facades
Openings ψ (%) Openings ψ (%) Case 0-0 0 0.0 0 0.0 Case 0-1 0 0.0 1 3.9 Case 0-3 0 0.0 3 11.5 Case 3-3 3 18.8 3 11.5 2.2 Metrology
For each of the 4 flow cases, the discharge leaving the facility is measured at each outlet by an electromagnetic flowmeter. The flow rate within each street is estimated based on the streamwise
Left street Right street NON-POROUS URBAN BLOCK Dow ns tr ea m st re et U ps tr ea m st ree t POROUS URBAN BLOCK
Case 0-0 Case 0-1 Case 0-3 Case 3-3
Left street
Right street Dow
ns tr ea m st re et U ps tr ea m st ree t Left street
Right street Dow
ns tr ea m st re et U ps tr ea m st ree t Left street
Right street Dow
ns tr ea m st re et U ps tr ea m st ree t POROUS URBAN BLOCK POROUS URBAN BLOCK
Figure 2. Sketch of the 4 studied cases with different urban block porosities.
velocity distribution obtained in different cross sections by using an ADV (Acoustic Doppler Velocimeter) with a side-looking probe, with intervals between 2 points in the vertical direction of 0.6 cm and in the spanwise direction of 1.0 cm (velocity measured for 100 s at 100 Hz at each measuring point). Flow depths are measured along the streets using an US (Ultrasonic Distance Sensor), and the streamlines within the whole measuring domain are obtained using the LSPIV technique (Large Scale Particle Image Velocimetry).
3 EXPERIMENTAL RESULTS
All three cases with a porous urban block are compared with Case 0-0, which is considered as a reference case (non-porous urban block configuration). In the following, the different results are normalized by the reference case data.
3.1 Flow distribution
The flow rate values measured for the reference case at the four outlets and at the upstream end of each street around the urban block are summarized in Table 2.
Table 2. Flow rates (l/s) for the reference case (Case 0-0). Outlet
Right Left Upstream Downstream
1 2 3 4 Street Street Street Street
1.95 1.60 1.54 1.44 3.95 1.11 0.55 1.99
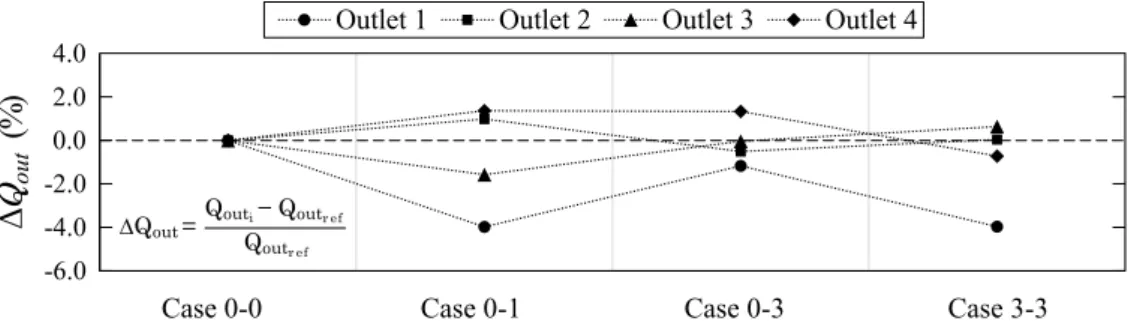
The outflow (Qout) distribution for the different cases studied herein does not significantly vary.
The values measured at the different outlets for the four cases are very similar. When noting the largest relative difference (denoted as ∆Qout) of outlet discharge for a given outlet between a
porosity case and the reference case is about 4%, and is observed at Outlet 1, for Case 0-1 and Case 3-3, see Figure 3.
-6.0 -4.0 -2.0 0.0 2.0 4.0 0.5 1.5 2.5 3.5 4.5
Outlet 1 Outlet 2 Outlet 3 Outlet 4
Case 0-0 Case 0-1 Case 0-3 Case 3-3
Qout
Δ
(%
)
∆Qout=QoutQi− Qoutr ef outr ef
Figure 3. Relative difference in flow rate at each outlet (∆Qout) with respect to Case 0-0.
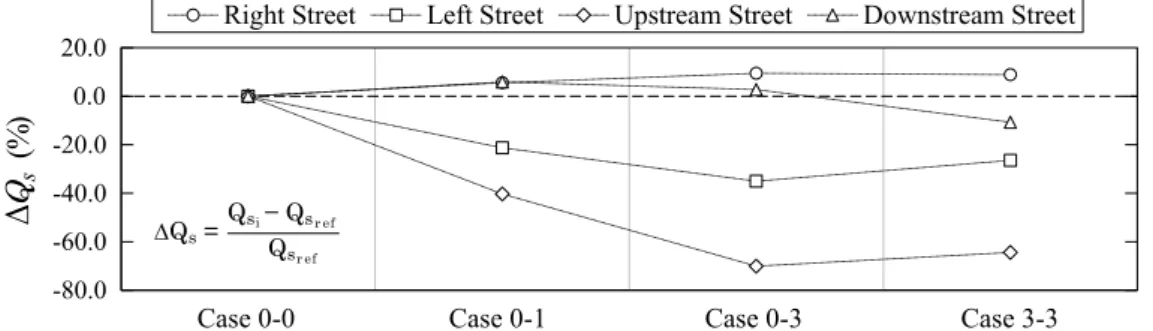
In contrast, the distribution of the flow rate in the streets (Qs) surrounding the urban block for the porosity cases significantly differs from the reference case distribution. Note that the variation
in flow rate distribution increases with the urban block porosity. To observe these variations, the flow rates at the upstream end of each of these reaches are compared with the reference case. Figure 4 shows the relative difference (denoted as ∆Qs) in these flow rates for each street and for
each case.
When comparing cases 0-1 and 0-3, the variation in flow rate with respect to the reference case is greater in the case 0-3, at least in the right, left and upstream streets. These variations are also linked to what happens inside the block, which directly affects the direction of flow through the openings in the facades (Fig. 5 depicts the streamlines for the different cases). For instance, from Case 0-3 to Case 3-3, with an increasing porosity in the upstream and downstream facades, the flow rate of the downstream street strongly decreases. The porosity impacts the flow entering the street because the flow is directed from the urban block towards the street in this facade, see Figure 5, Case 3-3. -80.0 -60.0 -40.0 -20.0 0.0 20.0 0.5 1.5 2.5 3.5 4.5
Right Street Left Street Upstream Street Downstream Street
Case 0-0 Case 0-1 Case 0-3 Case 3-3
Qs Δ (% ) ∆Qs=Qsi− QQ sr ef sr ef
Figure 4. Relative difference in flow rate at the upstream end of each street surrounding the urban block (∆Qs) with respect to the reference case.
0 0.2 0.4 0.6 0.8 1 1.2 1.4 3 3.5 4 4.5 5 0 0.2 0.4 0.6 0.8 1 1.2 1.4 3 3.5 4 4.5 5
Figure 5. Streamlines of the free-surface velocity field in the area under study for the different cases (derived from LSPIV data).
3.2 Flow depth and bulk velocity
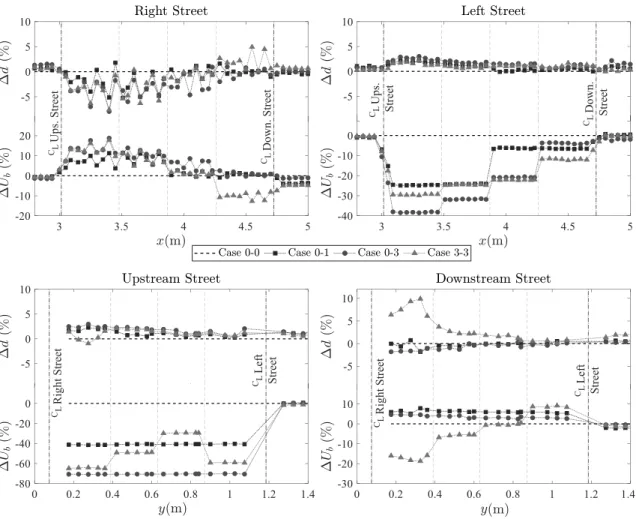
As observed for the outflow discharges, the flow depths (denoted as d) in the outlet regions of the experimental facility show no significant variation compared to the reference case. The same is observed along the upstream reaches on the right and left streets, see the upper charts in Figure 6. In contrast, flow depth change along the street reaches that surround the porous urban block with a change in porosity. The most notable variations can be found in the right and downstream streets, up to 8% and 10% respectively. Similarly to the flow rates, the flow depth variations increase with an increasing urban block porosity.
As flow rate and flow depth vary along the streets that surround the porous urban block, flow velocity also varies. The bottom graphs in each chart in Figure 6 show the variations in bulk velocity (denoted as Ub) computed from the measured flow depths and estimated flow rates. The
greatest variations with respect to the reference case are observed in the left and upstream streets, and as in these streets the variation in flow depth is not very significant, the variation in bulk velocity is mainly related to the variation in flow rates.
CL Ups. Str eet CL Do wn . Street CL Up s. Street CL Do wn . St reet CL Rig ht Street CL Left Street CL Rig ht Street CL Left Street
Figure 6. Relative difference in flow depth (∆d) and bulk velocity (∆Ub) with respect to the reference
case. Measurements along the centerline of each street. Vertical dashed lines show the location of the openings along the block facades, and vertical dash dotted lines indicate the location of the corresponding streets.
4 CONCLUSIONS
The experiments conducted during this study showed that the urban block porosity has a strong impact on the flow characteristics of the surrounding streets (up to 70% difference with respect to non-porous urban block for velocity and flow rate, with the conditions tested here), while the
areas downstream and upstream of the urban block do not show a great difference with the case of a non-porous urban block (5% maximum for velocity).
The influence of the urban block porosity on the flow in the streets proved to be greater when the porosity increases. This flow is also influenced by the flow pattern within the urban block, especially whether flow exits or enters the block through the porous wall.
Flow velocity and flow depth within streets are hydraulic parameters that are taken into account by urban flood studies to assess the level of flood hazard. Therefore, the proper estimate of the level of flood hazard requires to take into account the urban block porosity and its impact on the local flow characteristics.
5 ACKNOWLEDGEMENTS
The authors acknowledge the financial support offered by the French National Research Agency (ANR) for the project DEUFI (under grant ANR-18-CE01-0020).
REFERENCES
Abderrezzak, K. E. K., Paquier, A., & Mignot, E. 2009. Modelling flash flood propagation in urban areas using a two-dimensional numerical model. Natural Hazards, 50(3), 433-460.
Cea, L., Garrido, M., & Puertas, J. (2010). Experimental validation of two-dimensional depth-averaged models for forecasting rainfallrunoff from precipitation data in urban areas. Journal of Hydrology, 382(1-4), 88-102.
Huang, C.-J., Hsu, M.-H., Teng, W.-H., & Wang, Y.-H. 2014. The impact of building coverage in the metropolitan area on the flow calculation. Water, 6(8):2449-2466.
Hunter, N. M., Bates, P. D., Neelz, S., Pender, G., Villanueva, I., Wright, N. G., Liang, D., Falconer R. A., Lin, B., Waller, S., Crossley, A. J. & Mason, D. C. 2008. Benchmarking 2D hydraulic models for urban flooding. Proceedings of the Institution of Civil Engineers - Water Management. Vol. 161:1, pp. 13-30. Ishigaki, T. 2003. Hydraulic model tests of inundation in urban area with underground space. In Proc. of
30th IAHR Congress, Greece, 2003, pages 487-493.
Mignot, E., Paquier, A., & Haider, S. 2006. Modeling floods in a dense urban area using 2D shallow water equations. Journal of Hydrology, 327(1-2), 186-199.
Paquier, A., Bazin, P. H. & El kadi Abderrezzak, K. 2019. Sensitivity of 2-D hydrodynamic modelling of urban floods to the forcing inputs: lesson from two field cases. Urban Water Journal, pages 1-10. Smith, G. P., Rahman, P. F., & Wasko, C. 2016. A comprehensive urban floodplain dataset for model
benchmarking. International journal of river basin management, 14(3):345-356.
Soares-Fraz˜ao, S. & Zech, Y. 2008. Dam-break flow through an idealised city. Journal of Hydraulic Research, 46(5):648-658.
Sturm, M., Gems, B., Keller, F., Mazzorana, B., Fuchs, S., Papathoma-Kohle, M., & Aufleger, M. 2018. Experimental analyses of impact forces on buildings exposed to fluvial hazards. Journal of hydrology, 565:1-13.
Testa, G., Zuccala, D., Alcrudo, F., Mulet, J., & Soares-Fraz˜ao, S. 2007. Flash flood flow experiment in a simplified urban district. Journal of Hydraulic Research, 45(sup1):37-44.
Tomiczek, T., Prasetyo, A., Mori, N., Yasuda, T., & Kennedy, A. (2016). Physical modelling of tsunami onshore propagation, peak pressures, and shielding effects in an urban building array. Coastal Engineer-ing, 117:97-112.
Wahlstrom, M. & Guha-Sapir, D. (2015). The human cost of weather-related disasters 1995-2015. Geneva: UNISDR.
W¨uthrich, D., Pfister, M. Nistor, I. & Schleiss, A. 2018. Experimental study on forces exerted on buildings with openings due to extreme hydrodynamic events. Coastal Engineering, 140:72-86.
Yoon, K. 2007. Experimental study on flood inundation considering urban characteristics(ffc06-05). Urban Flood Disaster Management Research Center, Seoul.
Zhou, Q., Yu, W., Chen, A. S., Jiang, C., & Fu, G. 2016. Experimental assessment of building blockage effects in a simplified urban district. Procedia Engineering, 154:844-852.