HAL Id: hal-03024568
https://hal.archives-ouvertes.fr/hal-03024568
Submitted on 25 Nov 2020
HAL is a multi-disciplinary open access
archive for the deposit and dissemination of
sci-entific research documents, whether they are
pub-lished or not. The documents may come from
teaching and research institutions in France or
abroad, or from public or private research centers.
L’archive ouverte pluridisciplinaire HAL, est
destinée au dépôt et à la diffusion de documents
scientifiques de niveau recherche, publiés ou non,
émanant des établissements d’enseignement et de
recherche français ou étrangers, des laboratoires
publics ou privés.
Deflating the LLSVPs: bundles of mantle
thermochemical plumes rather than thick stagnant
”piles”
A Davaille, B Romanowicz
To cite this version:
A Davaille, B Romanowicz.
Deflating the LLSVPs: bundles of mantle thermochemical plumes
rather than thick stagnant ”piles”. Tectonics, American Geophysical Union (AGU), 2020, 39 (10),
�10.1029/2020TC006265�. �hal-03024568�
Deflating the LLSVPs: bundles of mantle
thermochemical plumes rather than thick stagnant
”piles”
A. Davaille1, B. Romanowicz2,3,4
1Laboratoire FAST, CNRS / University Paris-Saclay, ORSAY, France. 2Coll`ege de France, Paris, France
3Institut de Physique du Globe de Paris, France
4Department of Earth and Planetary Science, University of California, Berkeley, USA
Key Points:
• We use seismic tomography and fluid mechanics constraints to decipher the
mor-phology of LLSVPs in the Earth’s mantle.
• The two LLSVPs do not extend as compact, continuous and uniform piles above
the core-mantle boundary.
• Each LLSVP corresponds to a bundle of several thermochemical plumes.
Corresponding author: A. Davaille, davaille@fast.u-psud.fr
manuscript submitted to Tectonics
Abstract
Based on SEMUCB-WM1 tomographic model, - validated by other recent models-, and fluid mechanics constraints, we show that the large-low shear velocity provinces (LLSVPs) present at the base of the Earth’s mantle beneath the Pacific and Africa do not extend as compact, uniform structures very high above the core-mantle boundary. In contrast, they contain a number of well-separated, low velocity conduits that extend vertically through-out most of the lower mantle. The conceptual model of compact piles, continuously cov-ering the areal extent of the LLSVPs is therefore not correct. Instead, each LLSVP is composed of a bundle of thermochemical upwellings probably enriched in denser than average material. It is only when the tomographic model is filtered to long wavelengths that the two bundles of plumes appear as uniform provinces. Furthermore, the overall shape of the LLSVPs is probably controlled by the distribution of subducted slabs, and due to their thermochemical nature, the position of both LLSVPs and individual upwelling dynamics should be time-dependent. There is also evidence for smaller plumes originat-ing near the CMB in the faster than average regions of the votoriginat-ing map of Lekic et al. (2012) as well as other, barely resolved, weaker plumes within the LLSVPs. These finer scale features are starting to be resolved tomographically owing to improvements in full waveform modeling of body waves, including diffracted S waves (Sdiff) and waves mul-tiply reflected on the core-mantle boundary (ScS), and their codas.
1 Introduction
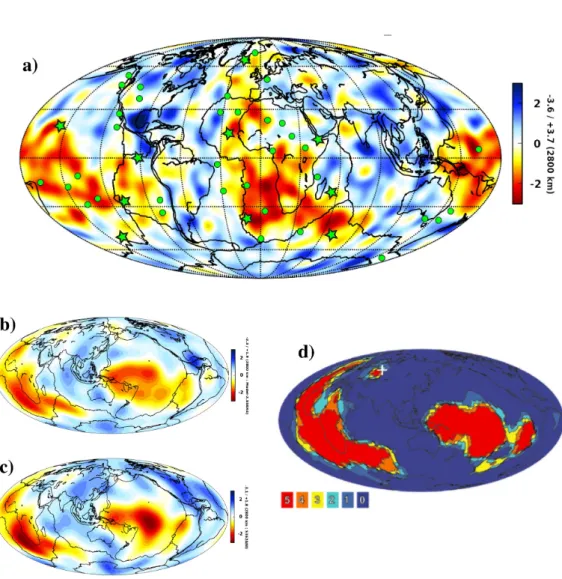
Already 30 years ago, the first global seismic tomographic images of the Earth’s mantle revealed the presence of very long wavelength structure (degrees 2 and 3) in the lower mantle (fig.1), correlated with similar wavelength structure in the geoid (e.g. Dziewon-ski et al., 1977; DziewonDziewon-ski, 1984). Since then, these features have been confirmed and refined through many generations of global mantle tomographic models. They have been dubbed large low shear velocity provinces (LLSVPs), because they are best resolved in shear velocity tomography and they appear slower than the surrounding mantle. One is located beneath the Pacific Ocean and the other one beneath the Atlantic and south Africa. They cover about 25% of the surface of the core-mantle boundary (CMB), and their outside boundaries are well resolved across different tomographic models (e.g. Le-kic et al., 2012). The LLSVPs are separated by a ring of fast velocities that contains most of the locations of current and past subduction at least in the last 200 Myrs (e.g. An-derson, 1982; Richards and Engebretson, 1992; Ricard et al, 1993; Lithgow-Bertelloni and Richards, 1998; Dziewonski et al., 2010). On the other hand, most of the hotspots are concentrated in the areas corresponding to the surface projection of the LLSVPs (fig.1). The hotspots with the longest tracks are located at their edges, as are the reconstructed positions of large igneous provinces (LIPs) in the last 200 Myrs (e.g. Torsvik et al, 2008).
Because they exhibit lower seismic velocities than the surrounding mantle, LLSVPs must be hotter than average, and may well represent the primary locus of the return flow from subduction (e.g. Ricard et al, 1993), in which case their origin could be purely ther-mal (e.g. Schuberth et al, 2009; Davies et al., 2012). However, there is also evidence from seismological imaging that they could be compositionally different from the surround-ing mantle. In particular, forward modelsurround-ing of waveforms of shear waves diffractsurround-ing along the core-mantle boundary (Sdiff) indicates that their borders are sharp, at least in some regions, with a lateral transition occurring over less than 100-200 km, sharper than what would be expected from temperature variations alone (Ni et al., 2002; Wang and Wen, 2004; To et al., 2005). There is also evidence for anti-correlation of shear and bulk sound velocity, at least at the longest wavelengths, in the lowermost mantle (Su and Dziewon-ski, 1997; Kennett et al., 1998), an indication for the presence of lateral compositional variations. Finally, some normal-mode based studies (Ishii and Tromp, 1999) and tomo-graphic studies that include constraints from other geophysical observables such as the geoid (Simmons et al., 2010), have suggested that the LLSVPs may be denser than the
Figure 1. a) Relative perturbations (in percent) in shear velocity in model SEMUCB-WM1 (French and Romanowicz, 2014) at 2800 km depth. The surface hotspots are superimposed in green. The stars represent the hotspots with a long-lived track and/or associated with a LIP event ; Model comparison up to harmonic degree l=12 between b) SEMUCB-WM1, and c) S362ANI (Kustowski et al., 2008); d) vote map from Lekic et al (2012).
manuscript submitted to Tectonics
surrounding mantle. However, the earlier mode-based tomographic results were met with skepticism, as it was shown that models with higher or lower density than average could be equally likely, depending on parametrization and the choice of starting models (Ro-manowicz, 2001; Kuo and Ro(Ro-manowicz, 2002). This debate continues to this day: a re-cent model based on the observation of Stoneley modes (modes sampling the region around the CMB) suggests that the LLSVPs are lighter than average (Koelemeijer et al., 2017), while another study based on a novel technique utilizing constraints from tidal data in-dicates that they might be denser than average (Lau et al., 2017). Better constraints on the CMB topography could tell us if LLSVPs are denser (CMB deflected) or lighter (CMB uplifted) than the surrounding mantle (e.g. Deschamps et al, 2018, 2019), but the data is not yet good enough to give a definite answer (for a recent review, see Koelemeijer, 2020). There is also some suggestion that the excess density could be concentrated in patches of ultra-low velocity zones (Yuan and Romanowicz, 2017).
The nature and evolution of the LLSVPs through time, and their role in the gen-eral mantle circulation have been widely debated. If LLSVPs were dense and old enough, Dziewonski et al. (2010) argued that they could have anchored mantle convection in the so-called ”degree 2” configuration. Indeed, this configuration of the mantle longest wave-length structure is not random, but corresponds to a stable energy configuration from the point of view of the Earth’s moments of inertia, with LLSVPs located antipodally at the equator, surrounded by a ring of fast velocities going through the Earth’s poles of rotation, and containing the positions of these poles over at least the last 200 Myr. The fixity of LLSVPs and of their edges as plumes sources was even suggested to exist over much longer times (Burke et al, 2008; Torsvik et al, 2010). Such fixity would be a valuable constraint to reconstruct the continents paleo-motions. However, the coincidence between plume formation and LLSVP edges is not proven statistically (e.g. Austermann et al, 2014). On the other hand, if LLSVPs are not so dense compared to slabs, inves-tigations of the effect of internal mass redistribution on the position of the Earth’s ro-tational pole show that temporal variations of the roro-tational axis are essentially due to changes in the subduction history in the last 410 Myr (Rouby et al, 2010; Greff-Leftz and Besse, 2014); variations in LLSVP shape or vertical extent only modulate the sig-nal (Rouby et al, 2010). So the present-day number and shapes of LLSVPs could only be a manifestation of the state of present day mantle circulation (McNamara and Zhong, 2004). Numerical modeling in the presence of continents by Zhong and collaborators (Zhong et al, 2007 ; Li and Zhong, 2009 ; Zhong and Liu, 2016) suggests that the mantle con-vective pattern may have alternated between a ”degree 1” and a ”degree 2” dominated planform while the mantle evolved through geological times. On the other hand, labo-ratory experiments suggest the possibility of an even larger range of mantle circulation configurations (Androvandi et al, 2011).
In the last 20 years, the interplay between compositional heterogeneities and man-tle convection has been largely investigated through experimental and numerical geo-dynamic modeling (for recent reviews, see Tackley, 2012 ; Davaille and Limare, 2015 ; McNamara et al, 2018), and several scenarios have been proposed about the possible com-position of the LLSVPs. On the one hand, LLSVPs may represent the primordial reser-voir tapped by mantle plumes and providing the distinct isotopic composition of ocean island basalts (OIBs), a scenario proposed among others by Kellogg et al. (1999) and most recently addressed through a combination of trace element geochemistry, seismic tomography and geodynamic modelling (Jackson et al., 2018; Williams et al., 2019). The key issue is then how to keep this primitive reservoir isolated for Gyrs in a convective mantle. The presence of a layer of material several percent denser than the ambient man-tle, maybe also more viscous, at the base of the mantle provides a possible answer (e.g. Davaille et al, 2002; Tackley, 2002; Nakagawa et al, 2010; Deschamps et al, 2012; Li et al, 2014). Such a layer would have been swept into dense primordial ”piles” (Tackley, 2002; McNamara et al. 2004, 2005) in response to mantle convection. An alternative sce-nario is that the LLSVPs are made up of accumulated slab material, since basaltic crust
becomes denser than the surrounding mantle in the deep mantle (e.g. Hirose et al., 2005). Here, the key issue is whether basaltic crust segregation has been efficient enough to build the present-day LLSVPs (e.g. Nakagawa and Tackley, 2005; Li and McNamara, 2013; Mulyukova et al, 2015). Recently, Li et al. (2014) showed that it is possible for the LLSVPs to contain both primordial and recycled material, while Ballmer et al. (2017) proposed a model (BEAMS,”bridgmanite-enriched ancient mantle structures ”), in which the LLSVPs are made of recycled oceanic crust, while the ambient mantle surrounding the LLSVPs would house primordial material which would not participate to general convection. In this case, mantle plumes rising through those regions would pick up some of the primor-dial signature along the way.
Whatever the origin of the compositional heterogeneities in the mantle, laboratory experiments have shown that the morphology and time evolution of hot upwellings in a heterogenous mantle critically depend on the latter’s viscosity and density structure (e.g. Le Bars and Davaille, 2004; Davaille et al, 2005; Kumagai et al, 2007, 2008). A whole zoology of shapes and behaviour could therefore develop in the mantle for density anoma-lies of compositional heterogeneities between 0 and 2% (e.g. Davaille, 1999). As noted by Schubert et al (2004), the extent of each LLSVP is much greater than the size of a single classical thermal plume, so that each LLSVP should host a bundle of plumes. Al-though thermochemical upwellings are predicted to be wider (Le Bars and Davaille, 2004; Kumagai et al, 2008) than purely thermal plumes, they are still much thinner than the typical lateral extent of each LLSVP. This lead Davaille et al (2005) to interpret the to-mographic images in the ”Indo-Atlantic” LLSVP as a bundle of 9 thermochemical up-wellings, each at a different stage of their evolution. This interpretation can appear at odds with the images of the tomographic voting maps (e.g. Cottaar and Lekic, 2016) con-structed based on smooth, filtered versions of tomographic models.
So, given the recent improvement in tomographic models resolution, it is time to reappraise the morphology of LLSVPs to answer several key questions: how high do LLSVPs rise above the core-mantle boundary ? are LLSVPs compact and uniform across that
depth range? or are they made up of a bundle of upwellings whose long wavelength ex-pression is the characteristic degree 2-3 pattern observed in all tomographic models (Schu-bert et al., 2004; Davaille et al, 2005; Bull et al, 2009; Garnero et al., 2016)?
In what follows, we first briefly review the fluid mechanics constraints on mantle convection and plume generation. We then illustrate the morphology of the LLSVPs draw-ing on images mainly from model SEMUCB-WM1 (French and Romanowicz, 2014, 2015). We note that many of the features considered are present in other high resolution tomo-graphic models. We show that the LLSVPs do not extend higher than 200-300km above the CMB as continuous piles, and that their appearance of large compact piles extend-ing to heights in excess of 1000-1500 km is due to long wavelength filterextend-ing of a bundle of distinct columnar plumes, as already proposed by Schubert et al. (2004). We then pro-vide an update of the Davaille et al. (2005) geodynamic interpretation of tomography in the ”Indo-Atlantic” domain in terms of thermochemical upwellings, and extend it to the ”Pacific” domain. We limit our analysis to the lower mantle as LLSVPs spring from the CMB area.
2 Fluid mechanics constraints
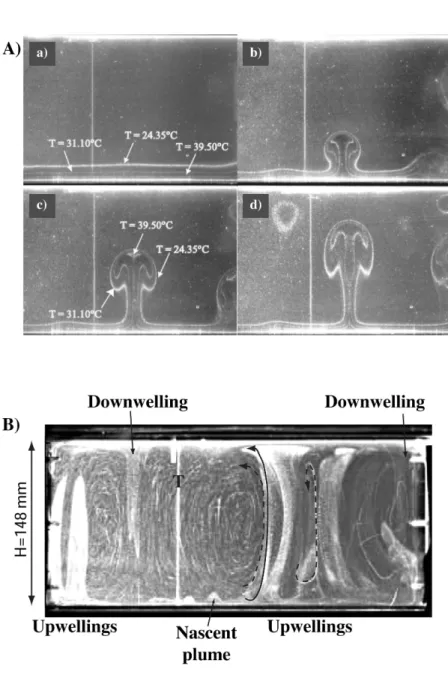
The Earth’s mantle is cooled from above by the universe, heated internally by the decay of radioactive elements, and heated from below by the core. The signature of the latter is the large temperature gradient that exists in a thin layer above the CMB (e.g. Stacey and Loper, 1983). In a fluid mechanics framework, this layer represents the ther-mal boundary layer (TBL) of the system. Hot plumes are buoyant upwellings that re-sult from the instability of this TBL (fig.2A; e.g. Loper and Stacey, 1983; Schubert et al, 2004). They develop when the vigour of convection is sufficiently strong. This vigour
manuscript submitted to Tectonics
Figure 2. Plumes development and morphology in the purely thermal case. A) Growth of TBL instabilities in sugar syrup at Ra=6.5 105 (run from Androvandi et al, 2011). The vertical
line is a thermocouple probe. The other white lines are isotherms. a . Time t=260 s, growth of the TBL by thermal diffusion: the isotherms are flat and parallel to the heated bottom bound-ary; b. t=440 s, a thermal mushroom-shape plume rises from the TBL; c. t=440 s, as the plume rises, the TBL shrinks; d. t=540 s. B) Experiment in sugar syrup at high Rayleigh number and intermediate viscosity ratio (run lRa12 from Androvandi et al, 2011: Rahot = 5.3 107; γ
= 142). Vertical cross-section taken 8 cm from the front lateral wall. The bright heavy lines are isotherms. The two downwellings are part of a cold cell that surrounds a bundle of hot up-wellings. The nascent plume indicated will remain trapped under the cold gravity current due to the downwelling and will eventually diffuse away. ”T” indicates a thermocouple probe.
depends on the Rayleigh number, which compares the driving thermal buoyancy force to the resisting effects of thermal diffusion and viscous dissipation:
Ra(H) = αρ∆T gH
3
κη (1)
where α is the thermal expansion, κ is the thermal diffusivity, η the viscosity, ρ the den-sity, ∆T the temperature difference across the system, and H the height of the system. Convection starts only when buoyancy forces are strong enough, so that Ra becomes greater than a critical value Rac∼ 1000. For a planetary mantle, Ra typically ranges between
105and 109, several orders of magnitude above the critical value. For this Ra range, plumes
are expected to develop. Howard (1964) proposed that plumes were developing as soon as the local Rayleigh number Ra(δ) across the TBL of thickness δ (which is growing by thermal diffusion from the heated bottom boundary) was reaching the critical value Rac.
Then experimental and numerical studies showed that plume size and spacing were pro-portional to the TBL thickness:
δ = H( Rac Ra(H))
1/3 (2)
In particular, the plume conduit diameter is very close to the TBL thickness (fig.2A). Note that plume characteristics are therefore independent of the mantle thickness, and are determined locally by the TBL (for reviews, see Schubert et al, 2004; Davaille and Limare, 2015). Fig.3 shows that only rather small TBL thicknesses (between 50 and 300 km), and therefore small plumes’conduit diameters, are expected out of the bottom TBL. Plumes spacing could reach on the order of a thousand kilometers for a viscosity of 1022 Pa.s. Depth-dependence of material properties is not steep enough to significantly in-crease the plume characteristics (e.g Schubert et al, 2004).
Figure 3. a) Typical thickness of the hot TBL, which corresponds also to the plume conduit diameter
, and b) plume spacing as a function of mantle viscosity for temperature contrasts across the TBL of 300oC (green dashed line) and 1000oC (red solid line).
When the viscosity strongly depends on temperature, convection organizes itself so that most of the viscosity variation is stored in the cold more viscous TBL at the top of the system, and the viscosity ratio in the bottom hot TBL remains small (<< 10). This produces a strong asymmetry between the two TBL and the flow pattern becomes also strongly asymmetric (e.g. fig.2B). In the ”mobile lid” regime at intermediate vis-cosity ratios, downwellings will form a network of cold cells each encasing a bundle of
manuscript submitted to Tectonics
Figure 4. A) Thermochemical plumes morphology for increasing B . The orange material is denser. B-F) Development through time of the plumes for different buoyancy ratios. B) B=0.42; C) B=0.47; D) B=0.72; E) B=1.09 (A-E: adapted from Kumagai et al, 2008); F) B=2.4 (adapted from Kumagai et al, 2007).
hot less viscous plumes (fig.2B; Schubert et al, 2004; Androvandi et al, 2011). More vis-cous downwellings displace less visvis-cous material, so that cold downwellings strongly in-fluence the bottom hot thermal boundary layer (Schaeffer and Manga, 2001; Gonnermann et al, 2004) and the hot upwellings can fully develop only out of the zone impacted by downwellings. However, within the hot plume area, the plumes diameter and spacing are still well predicted according to (2) and fig.3a (Androvandi et al, 2011). So in the purely thermal case, given the size of the mantle LLSVPs (typically 5000 to 8000 km across at CMB depth), each of them should host at least about 10 plumes (e.g. Schubert et al, 2004; Davies et al, 2012).
If a denser layer (of compositional origin) of thickness lb exists at the bottom of
the mantle, the pattern of convection will depend on two additional parameters besides the Rayleigh number Ra and the viscosity ratio γ: the layers thicknesses ratio a = lb/H,
and the buoyancy number, which compares the density contrasts of compositional ori-gin (∆ρX) and of thermal origin:
B = ∆ρX αρ∆Te
(3)
where ∆Te is the averaged temperature anomaly in the bottom hot TBL. Depending on
the combination of these 4 parameters, a whole zoology of convective regimes (Le Bars and Davaille, 2004; Davaille et al, 2005) and plume shapes (Kumagai et al, 2008) appears. The last 20 years have seen an increasing number of numerical studies to investigate these different regimes (for a recent review, see McNamara, 2018). Stratified convection ap-pears when B > 1, whereby thermal plumes develop above the denser hotter layer (fig.4Ag, E), with the same characteristics as fig.3. When 0.5 < B < 1, the interface between the two layers becomes strongly deformed under the action of the convective motions. If the denser layer is thin enough, it can be gathered in piles by the incoming slabs or under upwelling plumes. When B < 0.5, the whole denser layer can become unstable and invade the upper layer. The hot upwellings morphology can then be quite different from the purely thermal plumes (fig.4). In all cases B < 1, they are ”thermochemical”, being constituted of material from both layers. They need to be hotter than their purely thermal counterpart since temperature-induced density anomaly has to overcome the sta-ble compositional density contrast. The conduit diameters increase because each ther-mochemical plume now hosts an inner convective circulation (fig.4). Their spacing is dic-tated by convection in the most viscous layer and could range between 800 km and 3500 km (Le Bars and Davaille, 2004). So again, given the sizes of mantle LLSVPs, each of them should host several thermochemical upwellings.
Thermochemical upwellings present a strong time-dependence, as their chemically denser component will loose their heat as they rise, and therefore eventually reach a level of neutral buoyancy, after which the denser material will fall back down (e.g. Kumagai et al, 2008; fig.4B, C, D). Hence, in a thermochemical situation, all the hot material is not buoyant. It could stagnate at some level in the mantle (fig.4D, F), or, it could even go down if its compositional density exceeds its thermal buoyancy (e.g. Kumagai et al, 2008; Cadio et al, 2011; Dannberg and Sobolev, 2015). Moreover, while the chemically denser material stagnates or descends, it is still heating the surrounding mantle, which can therefore rise as a ”secondary” thermal plume (fig.4B, C, D), or even as several of them if the stagnating thermochemical upwelling has sufficiently spread laterally (fig.4F). The timescale of a thermo-chemical plume evolution strongly depends on the lower man-tle viscosity and typically ranges between 50 and 200 Ma (e.g. Kumagai et al, 2008; Ca-dio et al, 2011).
manuscript submitted to Tectonics
Figure 5. Slow local minima from SEMUCB-WM1 at decreasing depths: a) 2800km, b) 2650 km, c) 2500 km, d) d=2300 km. The solid black circles represent local minima lower than -1% and the dashed circles represent local minima lower than -0.5%. The surface hotspots are
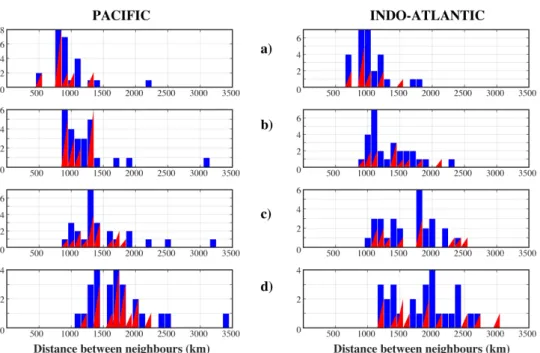
Figure 6. Histograms of the distance between two local minima from SEMUCB-WM1 : a) first neighbours, b) second neighbours, c) third neighbours, d) fourth neighbours. The blue rectangles are for local minima lower than -0.5%, and red triangles for local minima lower than -1%. The latter correspond to minima inside the LLSVPs only (if we take the long wavelength LLSVPs contours of Lekic et al (2012) vote map), while the former covers the minima population inside and outside the LLSVPs.
3 LLSVPs and mantle convection from global mantle seismic
tomog-raphy
3.1 Model SEMUCB-WM1
In figure 1, we show the lateral variations of isotropic shear velocity (VS) at 2800
km in model SEMUCB-WM1 (French and Romanowicz, 2014), and its filtered version at lmax= 12 (fig. 1b), compared to that of an earlier, lower resolution, tomographic model,
S362ANI (Kustowski et al., 2008; fig. 1c). While the filtered SEMUCB-WM1 model shows some amplitude differences with S362ANI, the overall patterns are in good agreement, as is reflected in a voting map (fig. 1d) such as that of Lekic et al. (2012), comparing 5 tomographic models, highlighting the agreement across the models on the extent of the two LLSVPs in the last 500 km of the mantle, and the ring of fast velocity surrounding them. While this voting map is quite remarkable, what is not always realized is that it only shows the agreement of the models at long wavelength, as these models have been filtered up to degree 16 in a spherical harmonics expansion (about 2500 km wavelength), prior to applying the voting. At these long wavelengths, all models present lower than average shear velocities within the rather well defined boundaries of the LLSVPs, and higher than average shear velocities outside of the LLSVPs, with the exception of one particular region, resolvable at that scale and named the ”Perm anomaly”, which exhibits lower than average VS in all five models. What needs to be emphasized, is that this does
not mean necessarily that the area covered by the LLSVPs is uniformly of lower than average VS. There could be ”holes” in both the LLSVPs and in the surrounding regions,
which simply would be filtered out in this voting map, either because they are of too fine a scale, or because they are not consistently resolved in the same locations in all
mod-manuscript submitted to Tectonics
els. The presence of such holes, not visible at degree 16, is evident when one inspects in-dividual models at their nominal resolution (e.g. fig.1a, but also other models). Cottaar and Lekic (2016) extended the voting map concept higher above the CMB, delineating large dome-like structures that extend, in some cases, to heights of more than 1000 km above the CMB. However, their study is again based on long-wavelength filtered versions of the 5 models considered (up to degree 18), that can miss interruptions in the domes which may not appear at this scale. Nevertheless, these maps have been very influen-tial in conveying the idea that LLSVPs are towering ”piles” or ”domes” of large lateral extent and height. However, while voting maps are useful to investigate the most robust features of shear velocity models - necessarily at long wavelengths - they cannot be con-sidered at face value as representing true mantle structure. Likewise, comparison of mod-els in order to extract the ”true” structure (e.g. Becker and Boschi, 2002) only works to a point, as mantle tomography techniques evolve and improve with time, so that not all models are ”equal” and some important features may have been missed in earlier stud-ies simply because of lack of resolution, while even nominally higher resolution models may vary in which regions are better resolved than others due to differences in datasets and inversion techniques. Indeed, cross-correlation between different global tomographic models shows much poorer correlation (<0.4) for degrees higher than 16 in the lower man-tle (e.g. Meschede and Romanowicz, 2015).
Figure 7. Examples of depth cross-sections in the isotropic VS part of radially anisotropic
model SEMUCB-WM1, expressed as relative velocity perturbations (in percent) with respect to global average at any given depth, in the Pacific. These cross-sections highlight broad plume conduits originating at the CMB and extending quasi-vertically through the lower mantle and in some cases in the upper mantle in the vicinity of prominent hotspots, with varying inten-sity/resolution. The locations of the cross-sections are shown in the inset maps, with hotspots indicated as green dots. Depth tickmarks are every 500 km, with the deepest one at 2500 km depth. Broken lines mark the 400, 660 and 1000 km depth horizon. In (D) the halo of the San Fernando plume, which is out of plane, is visible south of the Galapagos
In model SEMUCB-WM1, while not all the small scale low velocity minima (fig.1a) may be well resolved or stable, many of the strongest ones can be followed vertically for at least 500 km from the CMB, as illustrated in Figure 5. Here, the S-wave velocity lo-cal minima have been outlined by black circles (solid when the lolo-cal minimum is lower
Figure 8. Same as Figure 7 in the Atlantic hemisphere. These cross-sections highlight broad plume conduits originating at the CMB and extending quasi-vertically up to at least 1000 km depth in the vicinity of prominent hotspots, with varying intensity/resolution. In (B), the sep-aration between the Reunion and Marion plumes appears poorly resolved. They seem to both originate in nearby patches at the CMB. In (C), the strong plume conduit likely corresponds to the East African volcanism under Kenya, even though the triangle further South marks the projection of the location of the Comores hotspot on this cross-section.
Figure 9. Comparison of two cross-sections in models GLAD-M25 (top, Lei et al., 2020) and SEMUCB-WM1 (bottom, French and Romanowicz, 2014), which shows good qualitative agree-ment in the morphology of fat plumes both in the Pacific and Atlantic hemispheres. We note that other authors have previously argued for the presence of fat plumes in the lower mantle based on travel times of P and S waves (e.g. Montelli et al., 2004).
manuscript submitted to Tectonics
than -1% and dashed when it is lower than -0.5%). The circles have been positioned at 2800 km depth and dropped at the same locations on all subsequent panels. The ver-tical continuity of the low VS areas is good, especially for the stronger minima. The
typ-ical distance between two minima is about 1000 km (fig.6). According to section 2, these VS minima could correspond either to purely thermal TBL instabilities controlled by a
mantle viscosity of 1022Pa.s (fig.3), or to thermochemical instabilities. This is even more
clearly seen in cross-sections, highlighting some of the strongest vertical plume-like con-duits that extend vertically at least 2000 km from the CMB (fig.7- 8), as has been ex-tensively discussed in French and Romanowicz (2015). Figure 9 shows a comparison of cross-sections through some of these plumes in models SEMUCB-WM1(bottom) and the more recent model GLAD-M25 (Lei et al., 2020, top) showing very similar morphology in at least some of the large plume conduits in these two full-waveform-based tomographic models.
3.2 Resolution tests
We have also conducted synthetic resolution tests (fig. 10-13), in which we have designed input models representing either a compact, continuous LLSVP-like anomaly (fig.10-11) centered in the Pacific, or a narrower vertical ”plume” under Hawaii (fig.12), and passed them through the resolution matrix obtained for the last iteration of the in-version in the construction of SEMUCB-WM1, to show how these structures might get deformed or degraded by inversion. Note however, that this kind of resolution test only validates the last iteration of the tomographic inversion, which is a non-linear problem. Performing a full resolution test, which involves several iterations of forward and inverse computations would be computationally prohibitive. In fig.10, an LLSVP-like pile with uniform VS reduction of 2% extends from the core-mantle boundary to 1800 km depth.
Its lateral and height extent is well recovered in the output model, and it is not chopped up into separate columns. There is no loss of amplitude at the bottom of the mantle, and a maximum 25% loss in the mid mantle, depending on the ray coverage. In the lower mantle, a VS reduction of 2% would typically correspond to a temperature increase of
∼400oC if there is no associated compositional anomaly (e.g. Karato, 2008; Deschamps
et al, 2012). Likewise, the pile shown in fig.11, which extends only 600 km above the core mantle boundary is also well recovered both in height, lateral extent, and amplitude, with-out the inversion breaking it up into distinct smaller scale columns. In fig.12, a verti-cal input plume of 400 km diameter and 2% velocity reduction compared to ambient man-tle (located below the Hawaian hotspot) retains its shape and height in the output model, but becomes twice broader and dramatically loses amplitude (by a factor of 4). Fig.13 shows a whole mantle depth cross-section centered on Africa, where the LLSVP is bro-ken up into distinct columns of varying height in model SEMUCB-WM1 (fig.13A), and the corresponding resolution test results, indicating that a thick uniform pile in this lo-cation would be well resolved (fig.13C) as would be a series of separate narrower columns (fig.13D). We note that forward modeling of shear wave travel times independently con-firms the presence of ”holes” in the African LLSVP (Kastle et al., 2017). So overall, the resolution of SEMUCB-WM1 is estimated to 800 km, although with some loss of am-plitude (French and Romanowicz, 2014, 2015). Any interpretation of the images in terms of plumes or thermochemical upwellings will have to keep this in mind.
3.3 How thick would be a denser pile if and when it exists ?
Fig.14a shows a depth cross-section across the central portion of the Pacific LLSVP, far away from any known hotspot at the surface. The height of the region of significantly reduced VS across this rather uniform part of the LLSVP does not extend more than
300-400 km above the CMB, with the strongly reduced part (dlnVS < 2%) limited to an
even thinner region. Such a denser pile would correspond to buoyancy numbers between 0.9 and 1.1 according to fig.4. Higher above the CMB, this region appears as a zone of
Figure 10. Resolution test with a 1800 km-tall pile under the Pacific. The top panels show the input model, and the bottom panels show the output model, after passing through the resolu-tion matrix computed for the last iteraresolu-tion of the construcresolu-tion of model SEMUCB-WM1.
manuscript submitted to Tectonics
Figure 12. Resolution test for a plume rooted at the CMB at the location of the Hawaian hotspot. The input plume has a diameter of 400 km and a shear velocity reduction of 2%. The output of the resolution test (multiplication by the resolution matrix as in figs 10 and 11) shows the broadening of the plume and loss of amplitude by a factor of 4 in this location. However, the plume is not distorted and its height is well recovered.
Figure 13. (A-B) Depth cross-sections (as in figures 7-8) under Africa showing at least three tubular, distinct quasi vertical conduits extending from the CMB to the mid-mantle. The black dashed contours have been drawn by hand and represent a qualitative interpretation of the to-mographic images. (C-D) Resolution tests with, in each panel: (top) input model and (bottom) output model after passing through resolution matrix, showing that the inversion can resolve the difference between a fat pile (C) and a collection of individual low velocity conduits (D). The cross-section is the same as in (A). The result of the test in (D) indicates that the top part of the two left plumes contoured in (A) and (B) may be wider than considered in the test model (plume heads?).
manuscript submitted to Tectonics
Figure 14. Depth cross-sections of shear velocity perturbations, expressed in percent relative to global average at each depth, in model SEMUCB-WM1, across a quiet region of the Pacific LLSVP. Insets show location of the cross-sections with the background map showing the model at 2800 km depth with the locations of major hotspots in green. Depth tick marks are every 500 km. In both cross sections, the zone of strongly reduced VS (< -2%) extends at most 200 km
above the CMB. In (A) this zone appears continuous in this model, while in (B), it is separated into two parts with a large hole in between. The halos of the Samoa and Hawaii plumes (e.g. fig.7b) appear as diffuse zones of mildly reduced VSabove the LLSVP in panel (B).
much smaller VS anomaly, which can be interpreted as either a broad and high zone of
slightly elevated temperature (less than 200oC) or a collection of weaker, poorly resolved
narrower plumes. Distinguishing between these two possibilities is not possible with the current resolution of the model. However, it is clear that, if compositionally distinct pile there is, it does not extend very high above the CMB, and possibly much less than 200 km, accounting for some vertical smearing, imposed by a combination of the chosen ver-tical parametrization of the model, data coverage, and the long period content of the wave-forms (periods > 30 s). Moreover, the base of the Pacific LLSVP is broken up into pieces with at least one big ”hole” a little further east, as shown in fig.14b.
The Indo-Atlantic LLSVP also shows the same type of discontinuous structure with some lateral gaps, for example between Cape Verde and the rest of the African slow anomaly, between Cape Verde and Iceland, or between the South Atlantic hot anomalies and the Indian Ocean ones (e.g. fig.5, fig. 15, fig.16a,b).
Figure 15. The 9 thermochemical instabilities proposed by Davaille et al (2005) superimposed on model SEMUCB-WM1 at 2800 km depth. 1- thermochemical plume beneath Iceland (see also Kumagai et al, 2008), 2- dying plume beneath Afar, 3- plume beneath Reunion, 4-plume below Kerguelen, 5- thermochemical dome beneath a plume cluster under Marion and Crozet, 6- fading plume below Tristan, 7- ”banana-shaped” thermochemical pile (Ni and Helmberger, 2003), 8-thermochemical dome beneath a plume cluster under Cape Verde, Azores, Canaries and Madeira, 9- thermochemical upwelling below central Africa. The surface hotspots are superimposed in green.
3.4 Any hot instabilities outside the LLSVPs?
Fig.5 shows that some slower than average areas appear outside of the main LLSVPs. The ”PERM” anomaly below Eurasia has been recognized for some time (e.g. Lekic et al, 2012), but at least 15 other slow anomalies are present in model SEMUCB-WM1, es-pecially around the main LLSVPs. Their amplitude is often less than within the main LLSVPs. Most of them do not correspond to a hotspot at the surface. Some of them have been confirmed in detailed regional studies (e.g. Suzuki et al., 2016). Fig.6 shows that their spacing distribution is similar to what is observed inside the main LLSVPs, with a most common spacing around 800-1000 km. So they could again be explained by in-stabilities from the hot TBL at the bottom of the mantle (fig.3) and could correspond to the nascent plumes observed in the laboratory (e.g. fig.2B), which develop out of the
manuscript submitted to Tectonics
Figure 16. Model SEMUCB-WM1. a) and b) 3D views of the Indo-Atlantic LLSVP between 2800 km and 1250 km. In orange the −0.8% isosurface. The four black ellipses outline the loca-tions where there is a continuous and vertical slow anomaly of less than −0.8% from the CMB to 1250 km at least. c) 3D cross-section (20oE-45oE) from South Africa to Afar showing a
succes-sion of at least 3 vertical upwellings extending at least between 2800 km and 500 km.The green bars show the surface hotspots.
main plumes bundle but never reach the surface. Under the action of the cold downwellings, they either lose their heat and buoyancy rapidly, or get pushed towards the bundle within the LLSVPs and feed one of the major plumes there (Androvandi et al, 2011; Heyn et al, 2018).
3.5 A bundle of thermochemical upwellings in the Indo-Atlantic That the LLSVPs were not laterally uniform but possessed lateral structures was already visible in a number of tomographic models in the early 2000’s. Comparing the observations in the Indo-Atlantic domain with predictions from laboratory experiments, Davaille et al (2005) proposed that, in fact, the African LLSVP consisted of about 9 ther-mochemical instabilities at different stages of their development (fig.15). We can now re-evaluate this analysis.
If the presently active volcanoes in Iceland, Afar, Kerguelen, Reunion and Tristan are projected radially downwards on the CMB, they are all in the vicinity of a slow anomaly. Their conduits are still difficult to trace with certainty, being only mildly slow (∼ −0.5%), with some patches of slower velocities (fig.8c,d, and fig.16a,b). This could correspond either to thermal plumes that are still too thin to be fully resolved (fig.4Aa or g, i.e. B∼0 or B>1) or to thermochemical plumes with contorted morphologies such as fig.4Ac,d,e (i.e. B∼0.3-0.65). The patches with the slowest velocities could be patches of compo-sitionally denser material which would need to be hotter to rise with the plume. Note that in this case, they could still be hot but sinking, rather than rising with the plume, as was proposed for the Iceland plume (Kumagai et al, 2008). But with informations on VS alone, we cannot discriminate between a rising or a descending patch.
Fig.16a shows that Cape Verde is a very prominent anomaly that can be traced across the whole lower mantle (fig.8A, 9).There is also a slow anomaly in the lowermost mantle below Canaries. Fig.16a suggests that both anomalies merge around 1250 km depth. It could be because they reach there their level of neutral buoyancy (e.g. fig.4C, D, F), which would then correspond to buoyancy numbers B∼0.45-0.7. The hotspot cluster of Cape Verde, Canaries and Azores describes a ”crown” above the lower mantle slow anoma-lies (fig.16a,b), as is seen in the laboratory experiments when secondary plumes are gen-erated from the top of a spreading thermochemical instability (fig.4F).
The lower mantle beneath Africa also shows some large features (more than 1000 km in diameter), with at least three individual locations where there is a continuous slow anomaly of less than −0.8% from the CMB to at least 1250 km (fig.13a, fig. 16c). As already discussed, the resolution tests (fig.13c,d) suggest that the ”holes” separating the slow anomalies are real. So, instead of the long tilted slow anomaly going from South Africa to Afar suggested by some earlier studies (e.g. Ritsema et al, 1999), SEMUCB-WM1 (fig.13a,b, fig.16) shows at least 3 or 4 distincts vertical anomalies, notably one just below the East Africa volcanism (fig.8C, 16c). Given the lateral extent of the LLSVP below Africa (> 5000 km), the development of several distinct upwellings is more in line with fluid mechanics constraints, as already discussed in section 2.
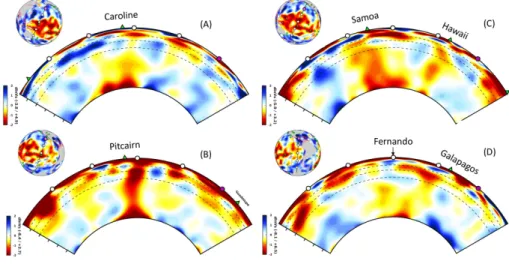
3.6 A bundle of thermochemical upwellings and plumes in the Pacific Figure 17 shows a 3D view of the Pacific LLSVP together with the active hotspots according to Clouard and Bonneville (2001). As already noticed, this LLSVP is not in one piece but hosts several individual tubular slow anomalies (numbered on fig. 17):
- To the west, there is a prominent slow anomaly (1) beneath Caroline hot spot in the lower mantle with a diameter >1000 km. It seems to spread around 1250km depth, and there is no corresponding large anomaly in the upper mantle. However, the existence of the Caroline hotspot suggests that there should exist a secondary plume between the lower mantle slow anomaly and the surface. Since the upper mantle viscosity is typically
manuscript submitted to Tectonics
Figure 17. 3D view of the Pacific LLSVP between 2800 km and 1250 km. In orange, the −1.0% isosurface. The names indicate the active hotspots in the Pacific according to Clouard and Bonneville (2001). The numbers indicate the different upwellings discussed in the text. The black arrows point towards the surface hotspots.
Figure 18. Depth cross sections in model SEMUCB-WM1, presented as in figs 7-8, a) north of Marquesas and b) going through Louisville and Easter, which may be plumes with weak inten-sity, or not as well resolved as others. The numbers refer to fig.17.
manuscript submitted to Tectonics
at least 30 times lower than the lower mantle’s, the diameter of this secondary plume could be as thin as 100 km (fig.3a) and therefore would not be resolved by SEMUCB-WM1. Caroline would therefore be produced by a thermochemical plume such as in fig.4Ad-f, C or D, pointing towards buoyancy numbers between 0.45 and 0.7.
- The lower mantle below Hawaii (2) hosts a mild slow anomaly and some much slower patches (fig.7b ; French and Romanowicz, 2015). These could correspond to the thermochemical patches seen on fig.4Ac-e, B, C, with buoyancy numbers around 0.3-0.6. Galapagos (7), Easter (8), and Louisville (9) present the same type of patchy morphol-ogy, although their anomalies are fainter than in the Hawaiian case (fig.18b). As already discussed for the Indo-Atlantic long-lived hot-spots, this could correspond either to plumes still too thin to be fully resolved (fig.2Ba,b or g) or to thermochemical plumes with con-torted morphologies such as fig.2Bc,d,e. The absence of a clear slow anomaly at the root of Louisville on the CMB could suggest that Louisville has exhausted all the hot mate-rial from the TBL and is therefore a dying plume. That would fit well with its recent very weak activity (e.g. Clouard and Bonneville, 2001).
- The center of Pacific LLSVP hosts 3 distinct large slow anomalies continuous over the lower mantle: Samoa (4) is distinct from the large upwelling (5) north west of Tahiti, Rurutu and Rarotonga. These three hotspots could be a cluster of secondary plumes born in the upper mantle on top of the lower mantle upwelling (5) (Davaille, 1999; Kumagai et al, 2007 ; Suetsugu et al, 2009), a situation already described for Cape Verde and sug-gesting buoyancy numbers B∼0.45-0.7. East of them, Pitcairn and McDonald appear to stem from another large upwelling (6) of the same type. This whole area from Tahiti to Pitcairn is covered by a ”super swell”, where the seafloor topography is abnormally high. It has been long interpreted as the signature of a large upwelling in the lower man-tle (e.g. McNutt, 1998) ; SEMUCB-WB1 suggests that it is in fact constituted of at least two distinct thermochemical upwellings.
- North-east of Tahiti, in between Hawaii and Marquesas, (fig.18b), there is also another strong low anomaly in the bottom lower mantle (3b) linked by a weaker one to another slower patch (3a) below the 1000 km depth horizon. At the surface, this area corresponds to a low in the geoid and in the seafloor topography, which had led Cadio et al (2011) to propose the existence of a hot but denser downwelling in the upper lower mantle to explain the data. SEMUCB-WM1 model see a slower patch (3a) at the same place. So this area could be another thermochemical upwelling which, after producing the Line Islands 40 Myr ago, has lost its buoyancy and is on its descent (Cadio et al, 2011) , an evolution similar to fig.4B, corresponding to a buoyancy number around 0.45.
3.7 Two main plumes bundles and the mantle compositional structure The previous sections suggest that the Atlantic and the Pacific LLSVPs both host at least 9 individual upwelling instabilities. On the tomographic present-day snapshots, these upwellings can present rather different morphologies. This can be due to their ferent compositional structure (i.e. different buoyancy numbers), but also to their dif-ferent stage of development as the shape of a thermochemical plume is strongly time-dependent (fig.4).
According to our geodynamic interpretation of the tomographic images, the plume buoyancy numbers may range between 0.3 and 0.7, possibly even 1. So this gives a re-lationship between the density anomaly of compositional origin ∆ρX and the
temper-ature anomaly ∆Te at the base of the upwelling (equation 3). For ∆Te= 750oC, ∆ρX
would range between 0.4% (B=0.3)and 1.5% (B=1). This suggests that the LLSVPs are also heterogeneous in composition, which could be the result of convective stirring of sev-eral components. However, we cannot go further yet in the analysis from inverting dVS
alone, as dVS depends on the tomographic model resolution (i.e. on the method, the ray
coverage, and the size of the anomaly), the composition (e.g. iron, SiO2, Perovskite or
MORB enrichment), the phase (e.g. post-perovskite), and the temperature (e.g. Deschamps et al, 2012). Adding informations from attenuation, or the gravity field, should help nar-row down the properties of these thermochemical plumes.
4 Conclusion
At the present level of resolution in seismic shear velocity tomography, it is pos-sible to assert that the LLSVPs are broken up into bundles of thermochemical plumes, some of which are well resolved, and others, likely weaker or thinner, are only suggested. The well resolved plumes have a surface expression (i.e. a hotspot) which is not always located immediately vertically above them, while some of the less well resolved, presently only ”suggested” ones may not correspond to any active feature at the surface of the Earth. There is evidence for plume-like features rooted near the CMB trying to ”make their way” through the regions covered by ancient slabs. This indicates that plumes are strongest and best developed outside of the ring of present and past subduction, thus forming two bundles of plumes, of which the LLSVPs represent the long wavelength expression with strong degree 2 and 3 components. Plumes are mostly where the slabs do not suppress them and their spatial distribution is governed by the distinct configuration of slabs within the ring of fast velocities passing through the Earth’s rotation poles. The LLSVPs can-not be described as two compact, continuous structures of distinct composition from their surroundings, and extending high above the CMB. Instead, (1) they are each composed of several thermochemical upwellings probably enriched in denser than average mate-rial, the roots of which can even host large ULVZs as evidenced for at least four man-tle plumes : Hawaii (Cottaar and Romanowicz, 2012), Samoa (Thorne et al., 2013), Ice-land (Yuan and Romanowicz, 2017) and Marquesas (Kim and Lekic, 2020); (2) their over-all morphology is dictated by subduction position, and (3) their dynamics should strongly depend on time. This should be taken into account when developing scenarios for their origin, while awaiting further improvements in the resolution of deep mantle 3D seismic structure.
Acknowledgments
This paper resulted from discussions that started during the Symposium on ”50 Years of Plate Tectonics” at the Coll`ege de France, Paris, in June 2018. It was improved thanks to the comments of two anonymous reviewers. BR acknowledges support from NSF CSEDI grant EAR-1464014, and AD support from LabEx PALM (ANR-10-LABX-0039-PALM, project MESOPLANET) and the Programme National de Plan´etologie (PNP) of CNRS/INSU, co-funded by CNES. The SEMUCB-WM1 tomography model can be downloaded at:
http://seismo.berkeley.edu/wiki br/Broad plumes rooted at the base of the mantle beneath major hotspots.
5 REFERENCES
Anderson, D. L. (1982) Hotspots, polar wander, Mesozoic covection and the geoid, Nature, 297, 391-393.
Androvandi S, Davaille A, Limare A, Fouquier A, and Marais C (2011) At least three scales of convection in a mantle with strongly temperature-dependent viscosity. Physics of the Earth and Planetary Interiors, 188, 132-141.
Austermann, J., Kaye, B.T., Mitrovica, J.X., Huybers, P. (2014) A statistical anal-ysis of the correlation between large igneous provinces and lower mantle seismic struc-ture, Geophysical Journal International, 197, 1-9.
manuscript submitted to Tectonics
Ballmer, M.D., Davies, D. R., S. Goes, J. H. Davies, BS.A. Schuberth, H. P. Bunge, and J. Ritsema (2012) Reconciling dynamic and seismic models of Earth’s lower man-tle: the dominant role of thermal heterogeneity, Earth Planet. Sci. Lett., 253,353-369. Ballmer, M.D., Houser, C., Hernlund, J.W., Wentzcovitch, Hirose, K. (2017) Per-sistence of strong silica-enriched domains in the Earth’s lower mantle, Nature Geosc., 10, 236-241. DOI: 10.1038/NGEO2898.
Becker, T. Boschi, L. (2002) A comparison of tomographic and geodynamic man-tle models. Geophys. Geochem. Geosyst. 3, 1003.
Bull, A.L., McNamara, A.K., Ritsema J. (2009) Synthetic tomography of plume clusters and thermochemical piles, Earth Planet. Sci. Lett. 278, 152-162.
Burke, K., Steinberger, B., Torsvik, T. H. Smethurst, M. A. (2008) Plume gen-eration zones at the margins of large low shear velocity provinces on the core-mantle bound-ary. Earth Planet. Sci. Lett. 265, 49-60.
Cadio, C., Panet, I., Davaille, A., Diament, M., Metivier, L., de Viron, O. (2011) Pacific geoid anomalies revisited in light of thermochemical oscillating domes in the lower mantle. Earth and Planetary Science Letters 306: 123-135.
Clouard, V., Bonneville, A. (2001) How many Pacific hotspots are fed by deep-mantle plumes? Geology, 29, 695-698.
Cottaar, S. and B. Romanowicz (2012) An unusually large ULVZ at the base of the mantle near Hawaii, Earth. Planet. Sci. Lett., 355-356, 213-222.
Cottaar, S. and V. Lekic (2016) Morphology of seismically slow lower- mantle struc-tures, Geophys. J. Int., 207, 1122-1136.
Dannberg, J. and S. V. Sobolev (2015) Low-buoyancy thermochemical plumes re-solve controversy of classical mantle plume concept, Nat. Comm., doi:10.1038/ncomms7960
Davaille, A. (1999) Simultaneous generation of hotspots and superswells by con-vection in a heterogeneous planetary mantle. Nature, 402, 756-760.
Davaille, A., Girard, F., Le Bars, M. (2002) How to anchor plumes in a convect-ing mantle? Earth Planet. Sci. Lett. 203, 621-634.
Davaille, A., Stutzmann, E., Silveira, G., Besse, J., Courtillot, V. (2005) Convec-tive patterns under the Indo-Atlantic ”box”. Earth Planet. Sci. Lett. 239, 233-252.
Davaille, A., Limare, A. (2015) Laboratory Studies of Mantle Convection, in Trea-tise on Geophysics, 2nd edition, vol. 7, pp. 73-144.
Davies, D.R., Goes, S., Davaies, J.H., Schuberth, B.S.A., Bunge, H.-P., Ritsema, J. (2012) Reconciling dynamic and seismic models of Earth’s lower mantle: The dom-inant role of thermal heterogeneity, Earth Planet. Sci. Lett., 353-354, 253-269.
Deschamps, F., Cobden, L., Tackley, P.J. (2012) The primitive nature of large low shear-wave velocity provinces, Earth Planet. Sci. Lett, 349-350, 198-208.
Deschamps, F., Li, Y. (2019) Core-mantle boundary dynamic topography: influ-ence of postperovskite viscosity. J. Geophys. Res., Solid Earth 124 (8), 9247-9264.
Deschamps, F., Rogister, Y., Tackley, P.J. (2017) Constraints on core-mantle bound-ary topography from models of thermal and thermochemical convection. Geophys. J. Int. 212 (1), 164-188.
Dziewonski, A. M. (1984) Mapping the Lower Mantle: Determination of Lateral Heterogeneity in P Velocity up to Degree and Order 6, J. Geophys. Res., 89, 5929-5952.
Dziewonski, A. M., B. H. Hager and R. J. O’Connell (1977) Large-scale heterogeneities in the lower mantle, J. Geophys. Res., 82, 239-255.
Dziewonski, A. M., V. Lekic and B. Romanowicz (2010) Mantle Anchor Structure: an Argument for Bottom up Tectonics, Earth and Planetary Science Lett., 299, 69-79.
French, S. and B. Romanowicz (2014) Whole-mantle radially anisotropic shear-velocity structure from spectral-element waveform tomography, GJI, 199, 1303-1327.
French, S. W. and B. Romanowicz (2015) Broad plumes Rooted At The Base Of The Earth’s Mantle Beneath Major Hotspots, Nature, 525, 95-99.
Garnero, E., A. K. McNamara and S-H. Shim (2016) Continent-sized anomalous
zones with low seismic velocity at the base of Earth’s mantle, Nat. Geosc., Doi:10.1038/NGEO2733. Gonnermann, H.M., Jellinek, A.M., Richards, M.A., Manga, M. (2004)
Modula-tion of mantle plumes and heat flow at the core mantle boundary by plate-scale flow: Re-sults from laboratory experiments. Earth Planet. Sci. Lett. 226, 53-67.
Greff-Leftz, M., Besse J. (2014) Sensitivity experiments on True Polar Wander, Geochem. Geophys. Geosyst., 15, 4599?4616, doi:10.1002/ 2014GC005504.
Heyn, B.H., Conrad, C.P., Trnnes, R.G. (2018) Stabilizing effect of compositional viscosity contrasts on thermochemical piles. Geophys. Res. Lett. 45 (15), 7523-7532.
Hirose, K., Takafuji, N., Sata, N., Ohishi, Y. (2005) Phase transition and density of subducted MORB crust in the lower mantle, Earth Planet. Sci. Lett., 237, 239-251. Howard, L.N. (1964) Convection at high Rayleigh number. In: Grtler H (ed.) Ap-plied Mechanics. Proceedings of 11th International Congress. Berlin: Springer.
Ishii, M., Tromp, J. (1999) Normal-mode and free-air gravity constraints on lat-eral variations in velocity and density of Earth’s mantle. Science, 285, 1231-1236.
Jackson, M.G., Becker, T.W., Konter, J.G., 2018. Evidence for a deep mantle source for EM and HIMU domains from integrated geochemical and geophysical constraints. Earth Planet. Sci. Lett. 484, 154-167.
Kastle, E. D., M. Weber, and F. Krger (2017) Complex Deep Structure of the African Low-Velocity zone, Bull. Seism. Soc. Amer., 107, 1688-1703.
Kellogg, L., Hager, B., van der Hilst, R. (1999). Compositional stratification in the deep mantle. Science 283 (5409), 1881-1884.
Kennett, B.L.N., Widiyantoro, S., van der Hilst, R.D., 1998. Joint seismic tomog-raphy for bulk sound and shear wave speed in the Earth’s mantle. J. Geophys. Res. Solid Earth 103, 12469-12493.
Kim, D., V. Lekic , B. Mnard, D. Baron, M. Taghizadeh-Popp (2020) Sequencing seismograms: A panoptic view of scattering in the core-mantle boundary region, Science, 368, 1223-1228.
Koelemeijer, P., Deuss, A. Ritsema, J. (2017) Density structure of Earth’s low-ermost mantle from Stoneley mode splitting observations, Nat. Com. 8, 15241.
Koelemeijer, P. (2020). Towards consistent seismological models of the core-mantle boundary landscape. AGU monograph ”Mantle Convection and Surface Expressions”, edited by Marquardt, Ballmer, Cottaar Konter, doi.org/10.1002/essoar.10502426.1.
manuscript submitted to Tectonics
Kumagai, I., Davaille, A., Kurita, K. (2007) On the fate of mantle thermal plumes at density interface. Earth Planet. Sci. Lett., 254, 180-193.
Kumagai, I., Davaille, A., Kurita, K., Stutzmann, E. (2008) Mantle plumes: Thin, fat, successful, or failing? Constraints to explain hot spot volcanism through time and space. Geophys. Res. Lett. 35, L16301.
Kuo, C., and B. Romanowicz (2002) On the resolution of density anomalies in the Earth’s mantle using spectral fitting of normal mode data, Geophys. J. Int., 150, 162-179.
Kustowski, B., Ekstrom, G. Dziewo?nski, A.M., 2008. Anisotropic shear- wave ve-locity structure of the Earth’s mantle: a global model, J. geophys. Res., 113, B06306, doi:10.1029/2007JB005169.
Lau, H. C. P. , J. X. Mitrovica, J. I. Davis, J. Tromp, H-Y.. Yang and D. Al-Attar (2017) Tidal tomography constrains Earth’s deep-mantle buoyancy. Nature, 551, 321-326.
Le Bars, M., Davaille, A. (2004b) Whole-layer convection in an heterogeneous plan-etary mantle. J. Geophys. Res.109, B07402.
Lei, W., Y. Ruan, E. Bozdag et al. (2020) Global adjoint tomography - model GLAD M-25, Geophys. J. Int., 223, 1-21.
Lekic, V., S. Cottaar, A. Dziewonski and B. Romanowicz (2012) Cluster analysis of global lower mantle tomography: anew class of structure and implications for chem-ical heterogeneity Earth. Planet. Sci. Lett 357-358, 68-77.
Li, M., McNamara, A.K. (2013) The difficulty for subducted oceanic crust to ac-cumulate at the Earth’s core-mantle boundary, J. Geophys. Res. Solid Earth, 118, 1807-1816.
Li, Z.-X., Zhong, S. (2009) Supercontinent-superplume coupling, true polar wan-der and plume mobility: Plate dominance in whole-mantle tectonics, Phys. Earth Planet. Int., 176, 143-156.
Li, M., McNamara, A.K., Garnero, E.J. (2014) Chemical complexity of hotspots caused by cycling oceanic crust through mantle reservoirs. Nat. Geosci. 7, 366-370.
Lithgow-Bertelloni, C., Richards, M., (1998). The dynamics of Cenozoic and Meso-zoic plate motions. Rev. Geophys. 36 (1), 27?78.
Loper, D.E., Stacey F.D. (1983) The dynamical and thermal structure of deep man-tle plumes, Phys. Earth Planet. Int. 33, 304-317.
Masters, G., Laske, G., Bolton, H. Dziewonski, A. M. (2000) in Earth’s Deep In-terior (eds Karato, S. et al.) Geophysical Monograph Series Vol. 117, American Geophys-ical Union, 63-87.
McNamara, A.K., Zhong, S.J., 2004. Thermochemical structures within a spher-ical mantle: Superplumes or piles? J. Geophys. Res. B 109. http://dx.doi.org/10.1029/ 2003jb002847.
McNamara, A.K., Zhong, S.J., 2005. Thermochemical structures beneath Africa and the Pacific Ocean. Nature 437, 1136-1139.
McNamara, A.K. (2018) A review of large low shear velocity provinces and ultra low velocity zones, Tectonophysics, 760, 199-220.
McNutt, M. K. (1998), Superswells, Rev. Geophys., 36, 211-244.
Meschede, M., Romanowicz, B. (2015) Lateral heterogeneity scales in regional and global upper mantle shear velocity models, Geophys. J. Int., 200, 1076-1093.
Montelli, R., G. Nolet , F. A. Dahlen, G. Masters, E. R. Engdahl, and S.-H. Hung (2004), Finite-frequency tomo-graphy reveals a variety of plumes in the mantle, Science, 303, 338-343.
Mulyukova, E., Steinberger, B., Dabrowski, M., Sobolev, S.V., (2015). Survival of LLSVPs for billions of years in a vigorously convecting mantle: replenishment and de-struction of chemical anomaly. J. Geophys. Res. B 120, 3824-3847.
Nakagawa, T., Tackley, P. J. (2005) Deep mantle heat flow and thermal evolution of the Earth’s core in thermochemical multiphase models of mantle convection. Geochem. Geophys. Geosyst., 6, Q08003.
Nakagawa, T., Tackley, P.J., Deschamps, F., Connolly, J.A.D., (2010). The influ-ence of MORB and harzburgite composition on thermo-chemical mantle convection in a 3-D spherical shell with self-consistently calculated mineral physics. Earth Planet. Sci. Lett. 296, 403-412.
Ni, S., Tan, E., Gurnis, M., Helmberger, D., (2002). Sharp sides to the African su-perplume. Science (80-. ). 296, 1850-1852.
Ni, S.D., Helmberger, D.V., (2003). Ridge-like lower mantle structure beneath South Africa. J. Geophys. Res. B 108. http://dx.doi.org/10.1029/2001jb001545.
Ricard, Y., Richards, M., Lithgow-Bertelloni, C., Stun, Y.L., (1993). A geodynamic model of mantle density heterogeneity. J. Geophys. Res. 98, 21895-21910.
Richards, M. and D. Engebretson (1992) Large-scale mantle convection and the his-tory of subduction, Nature, 355, 437-440.
Ritsema, J., H. J. van Heijst and J. J. Woodhouse (1999) Complex Shear Wave Ve-locity Structure Imaged Beneath Africa and Iceland, Science 286, 1925.
Romanowicz, B. (2001) Can we resolve 3D density heterogeneity in the lower man-tle?, Geophys. Res. Lett., 28(6), 1107-1110.
Rouby, H., Greff-Lefftz, M., Besse, J. (2010), Mantle dynamics, geoid, inertia and TPW since 120 Ma, Earth Planet. Sci. Lett., 292(3-4), 301-311.
Schaeffer, N., Manga, M. (2001) Interaction of rising and sinking mantle plumes. Geophys. Res. Lett., 21, 765-768.
Schubert, G., Masters, G., Olson, P. Tackley P. J. (2004) Superplumes or plume clusters? Phys. Earth Planet. Inter. 146, 147-162.
Schuberth, B.S.A., H. P. Bunge and J. Ritsema (2009) Tomographic filtering of high-resolution mantle circulation models: Can seismic heterogeneity be explained by tem-perature alone?, G-Cubed, 10, Q05W03.
Simmons, N.A., Forte, A.M., Boschi, L., Grand, S.P., 2010. GyPSuM: A joint to-mographic model of mantle density and seismic wave speeds. J. Geophys. Res. 115, B12310.
Stacey, F.D., Loper, D.E. (1983) The thermal boundary-layer interpretation of D” and its role as a plume source, Phys. Earth Planet. Int., 33, 45-55.
Su, W.-J. and A. M. Dziewonski (1997) Simultaneous inversion for 3-D variations in shear and bulk velocity in the mantle, Phys. Earth Planet. Inter. 100, 135-156.
manuscript submitted to Tectonics
Suetsugu, D., T. Isse, S. Tanaka, M. Obayashi, H. Shiobara, H. Sugioka, T. Kanazawa, Y. Fukao, G. Barruol, and D. Reymond (2009), South Pacific mantle plumes imaged by seismic observation on islands and seafloor, Geochem. Geophys. Geosyst., 10, Q11014.
Suzuki, Y., K. Kawai, R. J. Geller, A. F E. Borgeaud, and K. Konishi (2016) Wave-form inversion for 3-D S-velocity structure of D” beneath the Northern Pacific: Possi-ble evidence for a remnant slab and a passive plume, Earth Planets Space, 68, 198-206.
Tackley, P.J. (2002) Strong heterogeneity caused by deep mantle layering. Geochem. Geophys. Geosyst. 3. http://dx.doi.org/10.1029/2001gc000167.
Tackley, P.J. (2012) Dynamics and evolution of the deep mantle resulting from ther-mal, chemical, phase and melting effects. Earth Sci. Rev. 110, 1-25.
Thorne, M. S., E. J. Garnero, G. Jahnke, H. Igel, A. K. McNamara (2013), Mega-ultra low velocity zone and mantle flow, Earth Planet. Sci. Lett. 364,59-67.
To, A., B. Romanowicz, Y. Capdeville and N. Takeuchi (2005) 3D effects of sharp boundaries at the borders of the African and Pacific Superplumes: observation and mod-eling, Earth and Planet. Sci. Lett.,233, 137-153.
Torsvik, T. H., M A. Smethurst, J. Burke and B. Steinberger (2008) Long term sta-bility in deep mantle structure: evidence from the 300 Ma Skagerrak-centered large ig-neous province (the SCLIP), Earth Planet. Sci. Lett., 267, 444-452.
Torsvik, T. H., Burke, K., Steingerger, B., Webb, S.J., Ashwal, L.D. (2010) Dia-monds sampled by plumes from the core-mantle boundary, Nature, 466, 352-355.
Wang, Y., Wen, L. (2004) Mapping the geometry and geographic distribution of a very low velocity province at the base of the Earth’s mantle. J. Geophys. Res. 109. https://doi.org/10.1029/2003JB002674
Williams, C. D., S. Mukhopadhyay, M. Rudolph and B. A. Romanowicz (2019) Prim-itive Helium is Sourced from Seismically Slow regions in the lowermost mantle, G-Cubed, doi: 10.1029/2019GC008437.
Yuan, K. and B. Romanowicz (2017) Seismic evidence for partial melting at the root of Major Hotspot Plumes, Science, 357, 393-397.
Zhong, S., Zhang, N., Li, Z.-X., Roberts, J.H. (2007) Supercontinent cycles, true polar wander, and very long-wavelength mantle convection, Earth Planet. Sci. Lett., 261, 551-564.
Zhong, S, Liu, X. (2016) The long-wavelength mantle structure and dynamics and implications for large-scale tectonics and volcanism in the Phanerozoic, Gondwana Res., 29, 83-104.